Sample Category Title
Trade Idea: AUD/USD – Stand aside
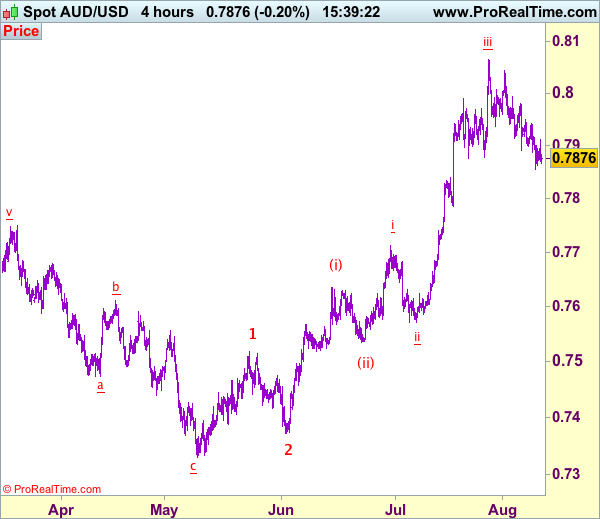
AUD/USD – 0.7875
Recent wave: Wave 5 ended at 1.1081 and major correction has commenced for fall to 0.7000 and then towards 0.6500-10
Trend: Near term up
New strategy :
Stand aside
Position: -
Target: -
Stop:-
As aussie has remained under near term pressure after recent anticipated retreat, adding credence to our bearishness and further consolidation below recent high of 0.8066 would be seen, hence mild downside bias remains for this move to bring retracement of recent rise in wave iv to 0.7839 (previous resistance tuned support), however, downside should be limited to 0.7786 and price should stay well above wave i top at 0.7712.
In view of this, would not chase this fall here and would be prudent to stand aside for now. On the upside, expect recovery to be limited to 0.7940-45 and bring another decline later. Only break of indicated resistance at 0.7980 would suggest low is formed, bring a stronger rebound to 0.8000, then towards 0.8043 resistance, break there would signal the pullback from 0.8066 top has ended instead, bring retest of this level first. We are keeping our latest bullish count that recent impulsive waves is unfolding as (1 2, (i)(ii), i ii) and may extend headway towards 0.8150.
On the 4-hour chart, the move from 0.8066 is the wave 5 with i: 0.8860, ii: 0.8315, wave iii is an extended move ended at 1.0183, iv: 0.9706 and wave v has ended at 1.1081 (also the top of entire wave 5). The subsequent selloff is the major correction which is unfolding as ABC-X-ABC and 2nd A leg has ended at 0.8848, followed by a-b-c wave B which ended at 0.9758, hence, 2nd C wave is now in progress and indicated downside target at 0.7000 and 0.6950 had been met, so further fall to 0.6710-20 cannot be ruled out.
EUR/GBP Candlesticks and Ichimoku Analysis
Weekly
• Last Candlesticks pattern: N/A
• ime of formation: N/A
• Trend bias: Near term up
Daily
• Last Candlesticks pattern: Doji
• Time of formation: 21 Jul 2017
• Trend bias: Up
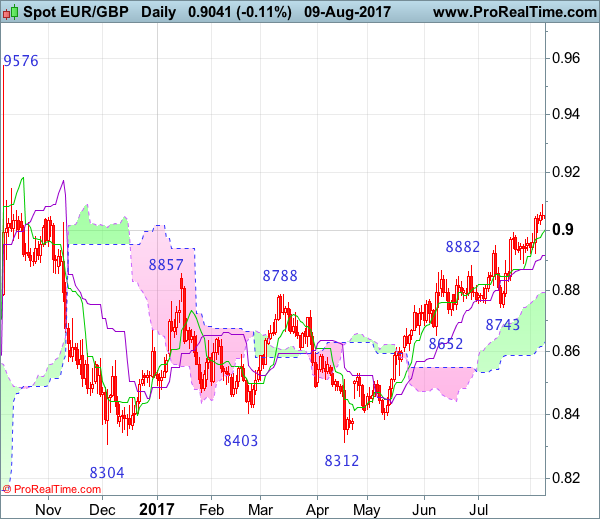
EURGBP – 0.9045
Although the single currency edged higher again this week, the quick retreat from 0.9088 formed a doji star on the daily chart (with relatively long upper shadow), suggesting 1-2 weeks of consolidation below this level would be seen and mild downside bias is for test of support at 0.8923, however, a daily close below the Kijun-Sen (now at 0.8916) is needed to signal a temporary top is formed, bring retracement of recent upmove to 0.8875-80, then 0.8830-35, having said that, renewed buying interest should emerge around 0.8795-00, bring another rise later.
On the upside, above said resistance at 0.9088 would extend recent erratic rise from 0.8304 low to 0.9150-60, however, loss of momentum should prevent sharp move beyond 0.9140-45 and reckon upside would be limited to 0.9200-10, price should falter below 0.9290-00, risk from there has increased for another retreat later.
Recommendation: Buy again at 0.8795 for 0.8995 with stop below 0.8695.
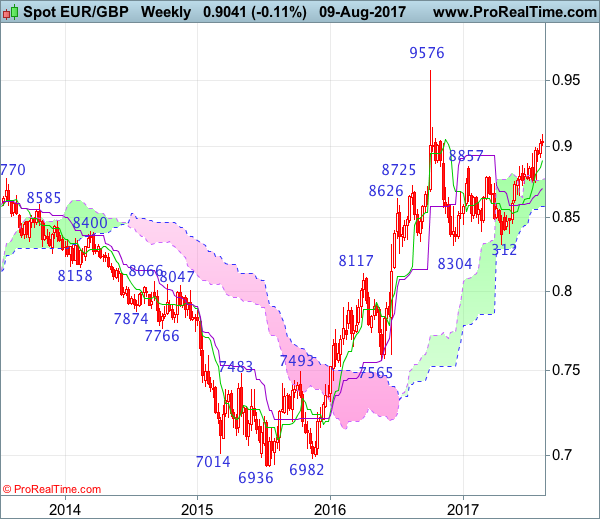
On the weekly chart, as the single currency has eased after rising to 0.9088 this week, suggesting minor consolidation would be seen and initial downside bias is seen for pullback to 0.8950-60, then towards the Tenkan-Sen (now at 0.8904), break there would bring minor correction to 0.8891 support and later 0.8840-50, however, reckon 0.8795-00 would limit downside and bring another rise later. Above said resistance at 0.9088 would add credence to our bullish view that the rise from 0.8304 is still in progress and extend gain to minor resistance at 0.9142. Looking ahead, break there is needed to retain bullishness and signal the entire correction from 0.9576 top has ended at 0.8304 and encourage for further subsequent gain to 0.9200-10.
On the downside, although pullback to the Tenkan-Sen (now at 0.8904) cannot be ruled out, reckon downside would be limited to 0.8795-00 and bring another rise later. Below support at 0.8743 support would defer and risk correction to the Kijun-Sen (now at 0.8700) but reckon downside would be limited to 0.8650-55 and the lower Kumo (now at 0.8571) should remain intact, bring another rally later.
EUR/CHF Candlesticks and Ichimoku Analysis
Weekly
• Last Candlesticks pattern: Long white candlestick
• Time of formation: 24 Jul 2017
• Trend bias: Up
Daily
• Last Candlesticks pattern: Morning doji
• Time of formation: 25 Jul 2017
• Trend bias: Up
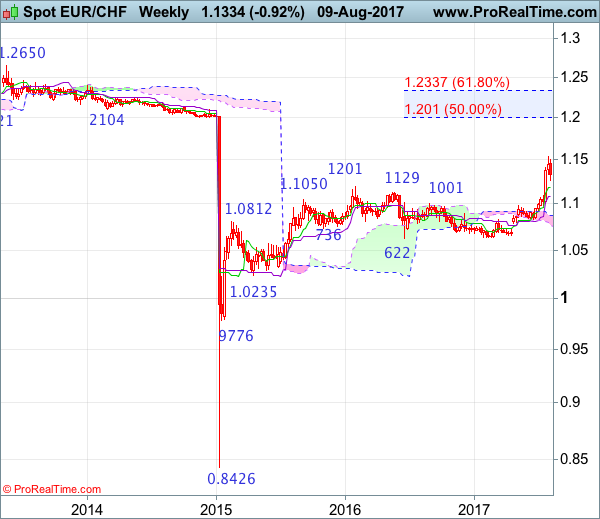
EUR/CHF – 1.1335
Despite rising to 1.1538 late last week, the subsequent sharp retreat suggests a temporary top has possibly been formed there and consolidation with mild downside bias is seen for test of the Kijun-Sen (now at 1.1238), however, a daily close below there is needed to add credence to this view, bring retracement of recent upmove to 1.1185 (50% Fibonacci retracement of 1.0833-1.1538), however, near term oversold condition should limit downside and reckon 1.1100-05 (61.8% Fibonacci retracement) would hold, bring rebound later.
On the upside, whilst initial recovery back towards the Tenkan-Sen (now at 1.1400) cannot be ruled out, reckon upside would be limited to 1.1440 and price should falter below 1.1500, bring another retreat later. Only a break of said last week’s high at 1.1538 would confirm recent upmove has resumed and extend headway to 1.1600-10, however, further sharp move beyond 1.1700 should not be repeated and price should falter below 1.1770-80, bring retreat later this month.
Recommendation: Exit long entered at 1.1335 and stand aside for this week.

On the weekly chart, although the single currency extended recent upmove to as high as 1.1538 late last week, the subsequent retreat looks set to form a black candlestick this week, suggesting consolidation below this level would be seen and pullback to 1.1250-60, then towards the Tenkan-Sen (now at 1.1186) cannot be ruled out, however, a weekly close below the Tenkan-Sen is needed to signal a temporary top is formed, bring retracement of recent upmove to 1.1100-05 (61.8% Fibonacci retracement of 1.0833-1.1538) then test of the Kijun-Sen (now at 1.1085) but reckon support at 1.0987 would remain intact.
On the upside, although initial recovery to 1.1400-10 cannot be ruled out, reckon upside would be limited to 1.1440-50 and price should falter below 1.1500, bring another retreat later. Only a break of said last week’s high at 1.1538 would revive bullishness and extend the major rise from 0.8426 low for headway to 1.1590-00, then towards 1.1700-10, however, near term overbought condition should prevent sharp move beyond 1.1800 and reckon 1.1900-10 would hold from here, risk from there has increased for a retreat to take place later this month.
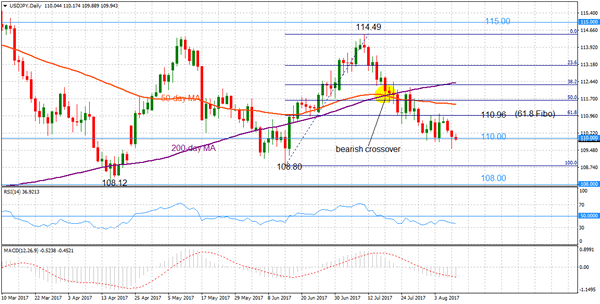
USDJPY Sees Increasing Risk Of Shifting From Neutral To Bearish Phase
USDJPY maintains risk to the downside as momentum indicators are bearish and not yet oversold, giving scope for further declines. The market has been neutral in the past two months and has not closed below the key 110.00 level since June 14.
After dipping to 109.55 yesterday, prices bounced back but a daily close below the critical 110.00 level would increase downside pressure for a move towards the June 14 low of 108.80, bringing a shift to a bearish phase, with scope to target the April 17 low of 108.12.
Only a move back above 110.96 would weaken downside pressure. It would be a challenge to break this level which has acted as strong resistance in the past week. It is the 61.8% Fibonacci retracement level of the rise from 108.80 to 114.49. The next target resistance would be the 50% Fibonacci at 111.60, which is close to the 50-day moving average. A break above the 200-day moving average and a move into the 113.00 handle would improve the odds for a re-test of the June 11 high of 114.49 and bring a resumption of the June to July uptrend.
The bearishly aligned moving averages after the crossover of the 50-day below the 200-day MA on July 17, along with the bearish momentum signals, increase the risk of a shift to a bearish phase from the current neutral one.
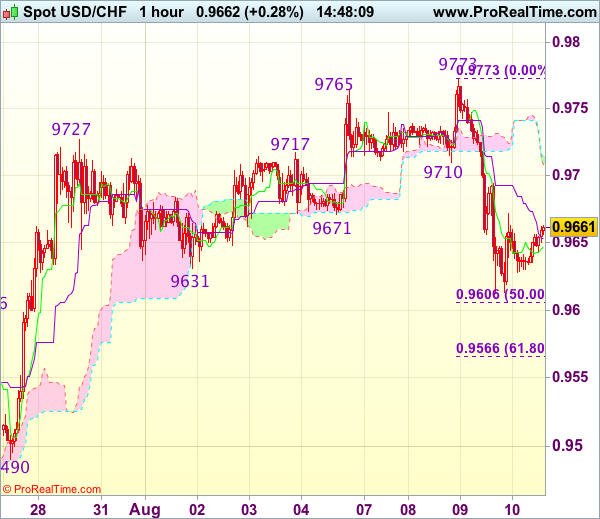
Trade Idea : USD/CHF – Sell at 0.9725
USD/CHF - 0.9663
Most recent candlesticks pattern : N/A
Trend : Near term up
Tenkan-Sen level : 0.9652
Kijun-Sen level : 0.9693
Ichimoku cloud top : 0.9715
Ichimoku cloud bottom : 0.9708
Original strategy :
Sell at 0.9725, Target: 0.9625, Stop: 0.9760
Position : -
Target : -
Stop : -
New strategy :
Sell at 0.9725, Target: 0.9625, Stop: 0.9760
Position : -
Target : -
Stop : -
As the greenback recovered after yesterday’s selloff to 0.9612, suggesting consolidation above this level would be seen and gain to 0.9700 cannot be ruled out, however, as top has been formed at 0.9773, reckon upside would be limited to 0.9720-25 and bring another decline, below said support at 0.9612 would add credence to this view and extend the fall from 0.9773 top for retracement of recent upmove to 0.9605-10 (50% Fibonacci retracement of 0.9438-0.9773), then 0.9580 but reckon 0.9665 (61.8% Fibonacci retracement) would hold from here.
In view of this, we are looking to sell dollar on subsequent recovery as 0.9725-30 should limit upside. Only a break of this week’s high at 0.9773 would abort and revive bullishness for the rise from 0.9438 to extend gain to 0.9800-10.
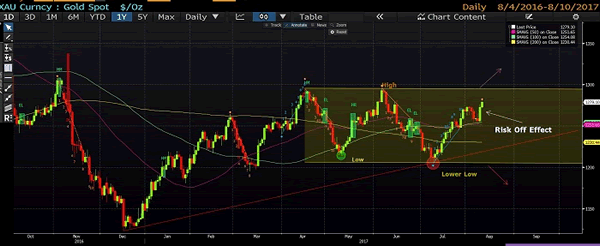
Gold Continue To Shine On North Korean Tension
Fundamental Analysis
- The war of words between the two countries US and North Korea is helping the yellow metal to score more gains.
- The momentum would remain strong as long as the rhetorical brinkmanship between President Trump and North Korea does not come to end
Technical Analysis
- The Price above the 100 and 200-day moving average confirms that the uptrend is in intact
- The Price has broken the Augst resistance and this explains that the bull trend is strong
- Candle session (which marks the end/start of new trend at 8,10 & 13) is at 10 which means caution
Levels To Watch
- Next Resistance is at 1295
- Next support is at 1243
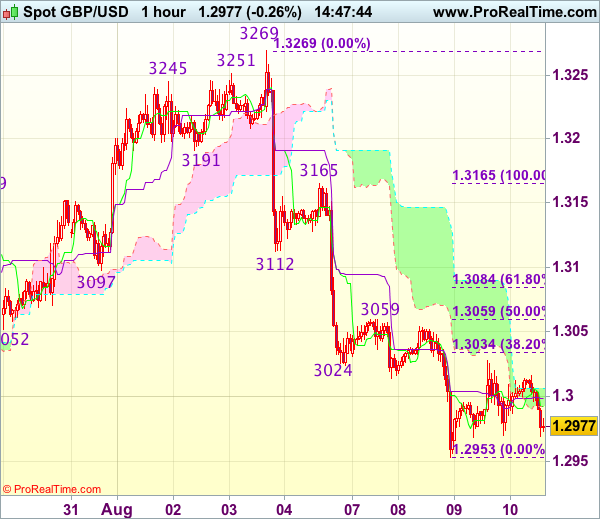
Trade Idea : GBP/USD – Hold long entered at 1.3000
GBP/USD - 1.2980
Most recent candlesticks pattern : N/A
Trend : Near term down
Tenkan-Sen level : 1.2993
Kijun-Sen level : 1.2999
Ichimoku cloud top : 1.3006
Ichimoku cloud bottom : 1.2992
Original strategy :
Bought at 1.3000, Target: 1.3100, Stop: 1.2965
Position : - Long at 1.3000
Target : - 1.3100
Stop : - 1.2965
New strategy :
Hold long entered at 1.3000, Target: 1.3100, Stop: 1.2965
Position : - Long at 1.3000
Target : - 1.3100
Stop : - 1.2965
Although cable has retreated again today, as long as 1.2965-70 holds, further consolidation above yesterday’s low at 1.2953 would be seen and prospect of another rebound remains and gain to 1.3059 resistance is likely, however, break there is needed to signal low is possibly formed at 1.2953, bring test of 1.3080-85 (61.8% Fibonacci retracement of 1.3165-1.2953), break there would add credence to this view, bring a stronger rebound to 1.3110-20 but resistance at 1.3165 should remain intact.
In view of this, we are holding on to our long position entered at 1.3000. Below 1.2965-70 would signal decline has resumed and extend the fall from 1.3269 top towards previous chart support at 1.2933 but reckon 1.2900 would hold from here, risk from there has increased for a rebound to take place later.
US-Korean Tensions Rattle Markets
Markets were cautious on Wednesday, as safe-haven assets pushed higher after tensions grew between the US and North Korea. Markets are concerned, as President Trump said, in response to a Washington Post report on North Korea’s nuclear capabilities, that “North Korea best not make any more threats to the United States. They will be met with fire and fury like the world has never seen”. North Korea has claimed it is examining an operational plan for firing a ballistic missile toward Guam. With concern mounting of a potential conflict the markets turned to a risk off sentiment with Gold, JPY and CHF gaining against USD, as investors entered into holding safe-haven assets.
More positive economic data came out from the US with Unit Labour costs lower and Nonfarm Productivity increasing in Q2. Initially the markets reacted with another round of USD buying, before giving back gains. With weakening oil prices, and doubts about OPEC’s ability to reduce production, the US EIA reported another surprising drawdown in US oil inventories of 6.5 million barrels for the week to August 4 – helping push Oil higher on the day.
EURUSD, following positive US data, traded down to 1.16887 before trading higher to 1.17634. Currently, EURUSD is trading around 1.1740.
As risk-off trades persists, USDJPY initially traded down to 109.559 on Wednesday, its lowest level in 2 months, before rebounding higher to 110.356. USDJPY is currently trading around 110.00.
GBPUSD continued to trade around 1.30 in relatively lackluster trading on Wednesday. Currently, GBPUSD is trading around 1.2985.
Risk trends will dominate USDCHF, which is currently trading around 0.9660.
Gold traded 1% higher to reach $1,276.06 on the day. Gold has continued pushing higher overnight and is currently trading around $1,279.
A further drop in US crude stocks raised hopes that an OPEC-led effort to wipe out a three-year, price-sapping supply glut is working, with WTI gaining 0.5% on Wednesday to trade as high as $49.75pb. WTI has continued trading higher overnight and is currently trading around $49.90.
At 09:30 BST, UK National Statistics will release a plethora of data for June: Manufacturing Production (MoM) & (YoY), Industrial Production (YoY) & (MoM), Goods Trade Balance, Total Trade Balance and non-EU Trade Balance. Recent indications are calling for a slight improvement in Industrial production and a reduction in the UK’s Trade Balance. Data significantly worse will see GBP come under downward pressure, conversely a release much better than expectations is likely to see GBP in demand.
At 13:30 BST the US Bureau of Labor statistics will release PPI data, Initial Jobless Claims and Continuing Jobless Claims. Expectations are calling for an improvement in all PPI data, with Jobless Claims holding steady at 240K. Positive data will help bolster USD and underscore US economic growth, which may help the Fed in hiking rates one more time this year. Poor data will see USD come under selling pressure.
At 15:00, FOMC Member & Federal Reserve Bank of New York President Dudley will deliver opening remarks and join a panel of New York Fed economists to answer questions, after the presentation of the Economic Press Briefing on Wage Inequality in the Region, in New York.
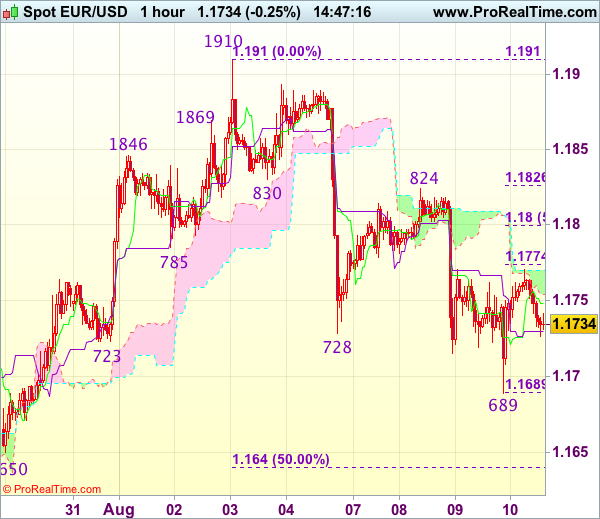
Trade Idea : EUR/USD – Hold short entered at 1.1770
EUR/USD - 1.1727
Most recent candlesticks pattern : N/A
Trend : Near term up
Tenkan-Sen level : 1.1744
Kijun-Sen level : 1.1730
Ichimoku cloud top : 1.1770
Ichimoku cloud bottom : 1.1754
Original strategy :
Sold at 1.1770, Target: 1.1670, Stop: 1.1770
Position : - Short at 1.1770
Target : - 1.1670
Stop : - 1.1770
New strategy :
Hold short entered at 1.1770, Target: 1.1670, Stop: 1.1770
Position : - Short at 1.1770
Target : - 1.1670
Stop : - 1.1770
As the single currency found support at 1.1689 yesterday and rebounded, suggesting consolidation above this level would be seen, however, as long as resistance at 1.1770 holds, bearishness remains for the fall from 1.1910 top to bring retracement of early upmove, hence further weakness to 1.0670 would be seen but reckon support at 1.1650 would remain intact due to oversold condition.
In view of this, we are holding on to our short position entered at 1.1770. Above 1.1800-05 would risk another test of 1.1824-30 resistance but only break there would signal the erratic fall from 1.1910 has ended, bring further gain to 1.1855-60 first.
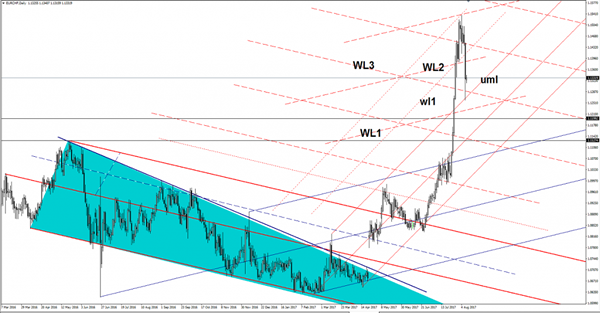
EUR/CHF Is The Retreat Completed?
EUR/CHF plunged in the yesterday's session and touched the upper median line (uml) of the minor ascending pitchfork. Has closed much above the mentioned support level and above the third warning line (WL3) of the former descending pitchfork. Personally, I still believe that will come down to test and retest the confluence area formed at the intersection between the WL3 with the upper median line (wl1), only a rejection will signal a rebound.