Sample Category Title
Trade Idea: GBP/USD – Buy at 1.3145
GBP/USD – 1.3236
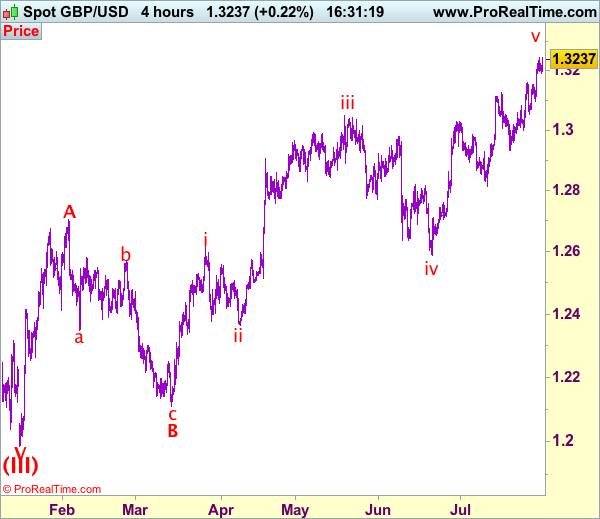
Recent wave: Wave V of larger degree wave (III) has ended at 1.1986 and major correction has commenced from there for gain to 1.3000 and 1.3140-50
Trend: Near term up
Original strategy :
Buy at 1.3130, Target: 1.3330, Stop: 1.3070
Position: -
Target: -
Stop: -
New strategy :
Buy at 1.3145, Target: 1.3345, Stop: 1.3085
Position: -
Target: -
Stop:-
As sterling has maintained a firm undertone after recent rally above previous resistance at 1.3126, adding credence to our bullishness for recent upmove to extend further gain to 1.3250, then towards 1.3300, having said that, as this move is still viewed as the final wave v of larger degree wave C, reckon upside would be limited to 1.3340-50 and price should falter below 1.3390-00, then sterling shall retreat sharply from there.
Our preferred count on the daily chart is that cable's rebound from 1.3500 (wave (A) trough) is unfolding as a wave (B) with A ended at 1.7043, followed by triangle wave B and wave C as well as wave (B) has ended at 1.7192, the subsequent selloff is the larger degree wave (C) which is still unfolding with minor wave (III) of larger degree wave 3 ended at 1.1986, hence wave (IV) correction is in progress which could either be a triangle wave (IV) of a complex formation but upside should be limited to 1.3500 and price should falter well below 1.4000, bring another decline in wave (V) of 3 for weakness to 1.1500, then 1.1200.
On the downside, whilst pullback to 1.3170-80 cannot be ruled out, reckon 1.3130-40 would hold and bring another rise. Only below said support at 1.3097 would abort and signal top is formed instead, bring retracement of recent rise to 1.3052 support but break there is needed to add credence to this view, bring correction to 1.3000, then 1.2980.
Trade Idea: GBP/JPY – Hold long entered at 145.55
GBP/JPY - 146.60
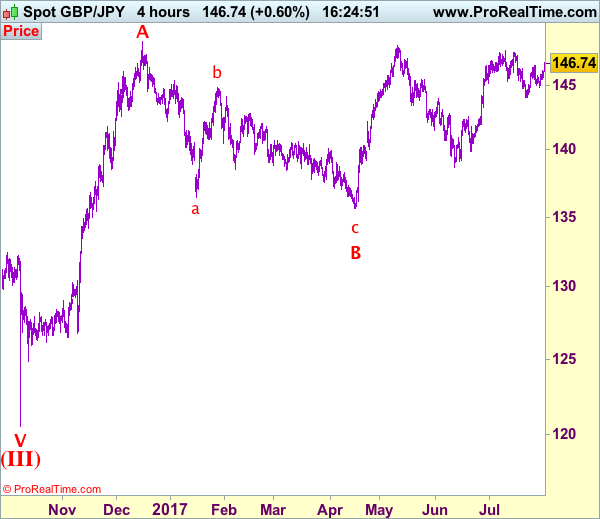
Recent wave: Medium term low formed at 120.50 and (A)-(B)-(C) major correction has commenced with (A) leg ended at 148.45, hence wave (B) is unfolding for retreat to 131.00-10.
Trend: Near term up
Original strategy:
Bought at 145.55, Target: 147.55, Stop: 144.95
Position: - Long at 145.55
Target: - 147.55
Stop: - 144.95
New strategy :
Hold long entered at 145.55, Target: 147.55, Stop: 144.95
Position: - Long at 145.55
Target: - 147.55
Stop:- 144.95
Sterling did find renewed buying interest at 145.50 yesterday (we recommended to buy at 145.55 and a long position was entered) and has rallied again since, adding credence to our bullish view that the pullback from 147.75 has ended at 144.05 and consolidation with upside bias remains for further gain towards said resistance, however, break there is needed to confirm recent upmove has resumed for headway towards previous chart resistance at 148.45 (2016 high) which is likely to hold from here.
In view of this, we are holding on to our long position entered at 145.55 and would exit on such rise. Below said support at 145.50 would defer and risk test of support at 144.85 but only break there would abort and prolong consolidation, risk weakness to 144.45-50, however, said support at 144.05 would hold from here, bring recovery later. A break of said support at 144.05 would add credence to our view that a temporary top has been formed at 147.75 earlier last month, bring retracement of recent upmove to 143.50, then towards support at 143.30.
Our preferred count is that larger degree wave V with circle is unfolding from 251.12 with wave (I) 219.34, (II): 241.38 and wave (III) is subdivided into 1: 192.60, 2: 215.89 (23 Jul 2008) and wave 3 ended at 118.87 earlier in 2009. The correction from there to 162.60 is wave 4 which itself is a double three and is labeled as first a-b-c ended at 151.53, followed by wave x at 139.03, 2nd a ended at 162.60, 2nd b at 146.75 and 2nd c leg of wave 4 ended at 163.00. Therefore, the decline from 163.00 to 116.85 is now treated as wave 5 which also marked the end of larger degree wave (III), hence wave (IV) major correction has commenced for retracement of the wave (III) from 241.38 and upside target at 183.95-00 (50% Fibonacci retracement of the wave (II) from 241.38) had been met, a drop below 160.00 would suggest wave (IV) has ended at 195.85, bring decline in wave (V) for initial weakness to 130 (already met) and 120.
Kiwi Dollar Approaching Crucial Support Vs US Dollar
Key Highlights
- The New Zealand Dollar after trading towards 0.7550 against the US Dollar started a downside correction.
- The NZD/USD pair is now approaching a crucial bullish trend line support near 0.7400 on the 4-hours chart.
- Today in New Zealand, the Employment Change for Q2 2017 released by the Statistics New Zealand posted a decline of 0.2%.
- The Unemployment Rate declined from 4.9% to 4.8% in Q2 2017.
NZDUSD Technical Analysis
The New Zealand Dollar after an impressive ride towards 0.7550-60 against the US Dollar found offers. The NZD/USD pair started a correction and now approaching a major support near 0.7400.
The pair traded below the 23.6% Fib retracement level of the last wave from the 0.7201 low to 0.7558 high recently. It has opened the doors for further losses towards 0.7420-00.
At the moment, the pair is attempting a break below a connecting bullish trend line at 0.7435 on the 4-hours chart. On the downside, there is a crucial bullish trend line with support near 0.7400.
The 100 simple moving average (H4) is also at 0.7385. Lastly, the 50% Fib retracement level of the last wave from the 0.7201 low to 0.7558 high is at 0.7379. Overall, the 0.7400-0.7380 is a major support area and it won't be easy for sellers to break it. Therefore, there are high chances of NZD/USD resuming its uptrend from the current or 0.7400-0.7380 levels.
New Zealand Employment Change
Today in New Zealand, the Employment Change for Q2 2017 was released by the Statistics New Zealand. The market was looking for a change of +0.7% compared with the last +1.2%.
However, the actual result was on the lower side, as the Employment Change came in at -0.2% in Q2 2017. The last reading was revised down from +1.2% to +1.1%. On the other hand, the Unemployment Rate posted a decline from 4.9% to 4.8% in Q2 2017.
Commenting on the figures, the labor market and households' senior manager, Diane Ramsay, stated:
In the June 2017 quarter, 3,000 fewer people were unemployed. The unemployment rate for women fell to 4.9 percent, with 10,000 fewer women unemployed - the lowest it's been since March 2009." In contrast, the male unemployment rate rose to 4.7 percent (7,000 more men unemployed).
Overall, the figures were mixed and weighed on the NZD/USD pair. There can be more dips towards 0.7400, but the stated level might act as a strong support in the near term.
US ADP Employment Change
Today, the US will see the release of the Employment Change for July 2017 by the Automatic Data Processing, Inc. The forecast is slated for a change of 185K, more than the last 158K. If the actual change is more than 180K, the US Dollar might gain bids in the short term.
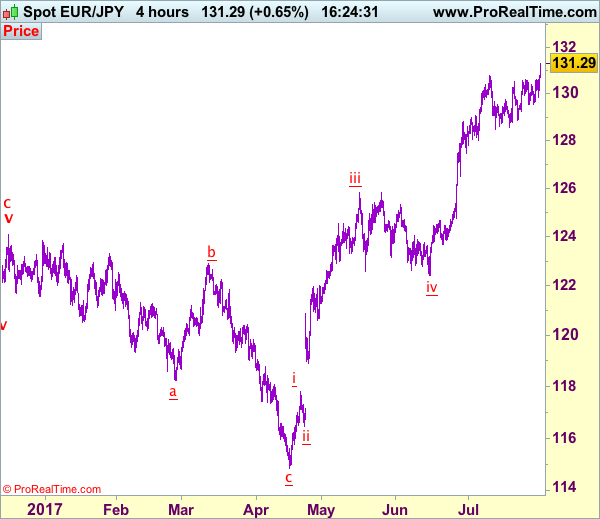
Trade Idea: EUR/JPY – Buy at 130.70
EUR/JPY - 131.28
Recent wave: wave v of (C) ended at 94.12 and major correction in wave A has ended at 149.79
Trend: Near term up
New strategy :
Buy at 130.70, Target: 132.50, Stop: 130.10
Position: -
Target: -
Stop:-
The single currency finally broke above recent high at 130.77, confirming upmove has resumed and upside bias is seen for further gain to 131.50-60, then 132.00-10, however, loss of upward momentum should prevent sharp move beyond 132.50-60 and reckon 132.90-00 would hold from here, risk from there is seen for a retreat later.
In view of this, would not chase this move here and would be prudent to buy euro on pullback as 130.55-60 should limit downside. Below 130.10-15 would risk test of support at 129.84 but break of latter level is needed to suggest a temporary top is possibly formed, bring test of 129.54, below there would provide confirmation, bring correction to 129.00 first.
Our latest preferred count is that wave (ii) is ABC-X-ABC which ended at 123.33 and wave (iii) is unfolding with wave iii ended at 100.77, followed by wave iv at 111.57 and wave v as well as the wave (iii) has ended at 97.04, followed by wave (iv) at 111.43 and wave (v) has ended at 94.12 which is also the end of the larger degree v, this also implied the major wave (C) has also ended there, hence major correction has commenced from there with (A) leg unfolding in its lower degree wave c which has possibly ended at 145.69. Under this count, A-B-C wave (B) has commenced with A leg ended at 136.23, wave B at 143.79 and wave C has possibly ended at 149.79.
Our larger degree count is that the decline from 139.26 is wave (C) and is sub-divided into a diagonal triangle i-ii-iii-iv-v with wave i - 105.44, wave ii- 123.33, wave iii - 97.03, wave iv - 111.43, followed by the final wave v as well as the end of wave (C) at 94.12, this also mark the bottom of larger degree wave B. Under this count, major rise in wave C has commenced as an impulsive wave with minor wave III ended at 145.69, wave V is still in progress for further gain to 150.00. Having said that, this so-called wave V could well be the first leg of larger degree 5-waver wave C and this wave C should bring at least a retest of wave A top at 169.97 (July 2008).
New Zealand’s Jobs Data Disappoint, Kiwi Tumbles
The Kiwi dollar came under selling pressure overnight, following the release of New Zealand's employment data for Q2. Even though the unemployment rate ticked down as expected, the labor force participation rate dropped significantly, missing its forecast for an uptick. This implies that the number of unemployed people may have fallen, but that was probably owed to a decline in the total number of people looking for work. As such, these are likely downbeat news for RBNZ officials, who meet next week to decide on policy. Coming on top of the decline in the CPI rate for Q2, which now lies notably below the RBNZ's own forecasts, we believe that these soft data are enough to keep the Bank from turning hawkish anytime soon.
In case the RBNZ appears less optimistic on the economy next week, or if it revises down its economic forecasts, the latest pullback in NZD could continue as investors push further back their expectations for the timing of a rate hike by the Bank. That said, our favorite proxy for exploiting further NZD weakness is EUR/NZD, given that we expect the euro to keep performing well as opposed to the greenback, which may continue bleeding, perhaps even more than the Kiwi. Finally, we should note that on Monday, ahead of the RBNZ's policy meeting on Thursday, the Bank will release its 2-year inflation expectations for Q3. This is a critical indicator that has prompted policy action in the past, and thus it could set the tone for the Bank's meeting.
NZD/USD fell below the support (now turned into resistance) barrier of 0.7460 (R1) overnight, to stop slightly above the key hurdle of 0.7400 (S1). The price structure on the 4-hour chart continues to suggest a short-term uptrend and as such, we would treat the overnight slide as a corrective phase for now. If the bulls manage to take control near the 0.7400 (S1) zone, we would expect them to aim for the 0.7460 (R1) line, where a clear break may open the way for another test near 0.7575 (R2).
Zooming out to the daily chart, we see that the 0.7400 (S1) hurdle acted as the upper bound of the long-term sideways range that was in place from the 3rd of June 2016 until the 20th of July 2017. Thus, as long as the rate is trading above that hurdle, the medium-term outlook remains positive as well. A dip below that line is needed to change the outlook back to flat, while a break below 0.7330 (S2) may be the trigger point for larger declines within the aforementioned range.
Oil tumbles on reports of rising OPEC production & inventories
Oil prices pulled back yesterday, following several reports that OPEC's production rose in July, despite May's output-cut deal. This suggests that either some countries pumped more than what was agreed in May, or the nations that were exempted from that deal (Libya and Nigeria) continued to raise their production. On top of that, the weekly US API data showed that inventories rose, which added further fuel to WTI's slide. Today's official EIA inventory data could also be pivotal for the near-term path of oil.
Looking ahead, we believe investors will focus on how well OPEC and non-OPEC members comply with their agreed quotas. In this respect, a meeting in Abu Dhabi on Monday may attract attention, as OPEC and non-OPEC officials are expected to discuss why some members are falling behind in their pledges to cut production.
WTI tumbled yesterday after it hit resistance at 50.35 (R2). Nevertheless, the slide was stopped near the crossroads of the 48.40 (S1) support and the upper bound of the downside channel that contained the price action from the beginning of February until the 27th of July. This makes us believe that there is the prospect for a rebound from that key support zone. A break back above 49.20 (R1) would confirm the case and is possible to set the stage for another test near the 50.35 (R2) area. Having said that though, we remain mindful with regards to the establishment of a healthy long-term uptrend. We believe that any further gains may be capped by the 51.00-55.00 range, where we believe US shale producers may be attracted to increase production.
Today's highlights:
During the European morning, we get the UK construction PMI for July and the forecast is for the index to have declined, albeit slightly. In Eurozone, the PPI for June is due out.
From the US, we get the ADP employment report for July, two days ahead of nonfarm payrolls. The forecast is for the private sector to have added 185k jobs, notably more than the 158k in June. Such a solid print could heighten speculation that Friday's NFP may also meet its forecast of 183k and thereby, reverse some of the dollar's latest losses. Having said this though, we have to sound a note of caution. Even though the ADP print is the only major gauge of the NFP, the correlation between the two figures has fallen notably in recent months.
We have two speakers on the agenda: Cleveland Fed President Loretta Mester and San Francisco Fed President John Williams.
NZD/USD
Support: 0.7400 (S1), 0.7330 (S2), 0.7260 (S3)
Resistance: 0.7460 (R1), 0.7525 (R2), 0.7560 (R3)
WTI
Support: 48.40 (S1), 47.55 (S2), 46.85 (S3)
Resistance: 49.20 (R1), 50.35 (R2), 51.50 (R3)
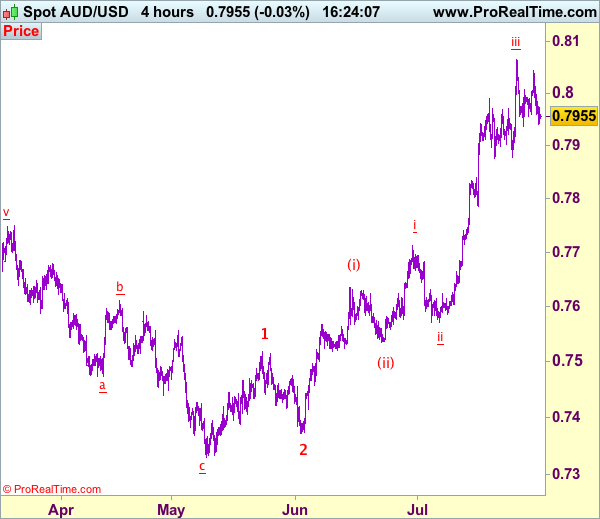
Trade Idea: AUD/USD – Hold short entered at 0.8030
AUD/USD – 0.7963
Recent wave: Wave 5 ended at 1.1081 and major correction has commenced for fall to 0.7000 and then towards 0.6500-10
Trend: Near term up
Original strategy :
Sold at 0.8030, Target: 0.7880, Stop: 0.8090
Position: - Short at 0.8030
Target: - 0.7880
Stop: - 0.8090
New strategy :
Hold short entered at 0.8030, Target: 0.7880, Stop: 0.8030
Position: - Short at 0.8030
Target: - 0.7880
Stop:- 0.8030
As aussie met renewed seeing interest at 0.,8043 yesterday and has retreated, retaining our view that further consolidation below recent high at 0.8066 (last week’s high) would be seen and near term downside bias remains for another retreat, below support at 0.7937 would add credence to our view that wave iii top is possibly formed at 0.8066, bring correction in wave iv to 0.7900, however, reckon previous support at 0.7875-78 would hold and renewed buying interest should emerge there, bring another rise later. Above said resistance at 0.8066 would signal recent upmove is still in progress for headway to 0.8100, then 0.8140-50 but overbought condition should limit upside to 0.8190-00, bring retreat later. We are keeping our latest bullish count that recent impulsive waves is unfolding as (1 2, (i)(ii), i ii) and may extend headway to aforesaid upside targets.
In view of this, we are holding on to our short position entered at 0.8030. A sustained breach below support at 0.7875 would defer and risk correction to 0.7810-20, however, still reckon downside would be limited to 0.7786 and price should stay well above wave i top at 0.7712.
On the 4-hour chart, the move from 0.8066 is the wave 5 with i: 0.8860, ii: 0.8315, wave iii is an extended move ended at 1.0183, iv: 0.9706 and wave v has ended at 1.1081 (also the top of entire wave 5). The subsequent selloff is the major correction which is unfolding as ABC-X-ABC and 2nd A leg has ended at 0.8848, followed by a-b-c wave B which ended at 0.9758, hence, 2nd C wave is now in progress and indicated downside target at 0.7000 and 0.6950 had been met, so further fall to 0.6710-20 cannot be ruled out.
Dow Eye 22K While Apple Sees Revival In iPhone
Investors could be caught on the wrong side of the trade
Apple too optimistic about iPhone8 but NASDAQ is happy
Investors are completely immune to all the drama which is taking place over in Washington because if you look at the performance of the Dow, it appears everything is hunky dory. Although one can never underestimate the possibility of the president getting impeached, but again that could mean more favourable trade relations with other countries and things moving back to normal. Thus, the impeachment trade itself could be positive for the equity market after a knee jerk reaction as the Trump trade would unwind. For now, the only thing which matters the most is how far we are in touching the level of 22k for the Dow index.
In earnings, it is all about Apple. The firm comfortably topped its forecast and produced stellar numbers for its revenue and profit. The big news was about the production of the iPhone 8, the flagship product for the firm will hit the market on time with no issues around production. The Apple Store has improved its revenue as more and more people got hooked on the new products. The sale increased to 22% during the first quarter.
As for the currency market, the dollar weakness continues as the odds of the Fed increasing the rate this year have abated further. The economic data is consistently giving the signal that the core PCE number is not showing any urgency. The US consumer income has also dropped further to 0% in June from the previous reading of 0.3%. The odds are just not lining up for any support for the dollar.
The ADP number will set the tone for the US Non-Farm data due on Friday. The ADP for the last month was not encouraging at all and if we get a sign that the US Labour is slowing down, then we have a big problem.
The Sterling is getting its confidence from the economic numbers. The manufacturing PMI number released yesterday has shown a much more encouraging number for the Q3. The export numbers are showing growing signs of confidence as this number climbed to its best level in nearly seven years. Of course, the job market has also improved. Later today we will have the construction PMI and a positive number will reinforce that growth is picking up some momentum. However, labour shortage could prompt a decline in this number to 54.3 from 54.8.
Daily Technical Analysis: EURUSD, GBPUSD, USDJPY, USDCHF
EURUSD
The EURUSD was corrected lower yesterday bottomed at 1.1785. Price is still moving strongly above the trend line support and EMA 200 as you can see on my H1 chart below suggests a clear and valid bullish trend. The bias is neutral in nearest term probably with a little bearish bias testing 1.1775 – 1.1720 support area which is a good place to buy. Immediate resistance is seen around 1.1875. A clear break and daily close above that area would expose 1.2000 key resistance. Overall I remain bullish and only a clear break back below 1.1650/00 and the trend line support could interrupt the bullish outlook and activate my neutral mode.
GBPUSD
The GBPUSD was indecisive yesterday. Overall price is still in a valid bullish trend, moving above EMA 200 and trend line support as you can see on my H1 chart below. The bias is neutral in nearest term. Immediate support is seen around 1.3160. A clear break below that area could trigger further bearish correction testing 1.3125 – 1.3075 support area which is a good place to buy. Immediate resistance is seen around 1.3250. A clear break and daily close above that area would expose 1.3350 region. Overall I remain bullish and only a clear break back below 1.3000 would interrupt the bullish outlook and activate my neutral mode.
USDJPY
The USDJPY was indecisive yesterday. The bias is neutral in nearest term probably with a little bullish bias testing 110.80 region. A clear break above that area could trigger further bullish pressure testing 111.30/50 area. Immediate support is seen around 110.25. A clear break below that area could trigger further bearish pressure testing the trend line support located around 109.50/00 region which remains a good place to buy with a tight stop loss as a clear break below the trend line support would activate my bearish mode.
USDCHF
The USDCHF had another indecisive movement yesterday. The bias remains neutral in nearest term. Immediate resistance is seen around 0.9700. A clear break and daily close above that area could trigger further bullish pressure testing 0.9756 – 0.9807 key resistance which remains a good place to sell. Immediate support is seen around 0.9620. A clear break and daily close below that area could trigger further bearish pressure testing 0.9550 region but key support remains at 0.9450.
Foreign Exchange Market Commentary: EUR/USD, USD/JPY, GBP/USD, GOLD, WTI CRUDE, DJIA, FTSE100, DAX
EUR/USD
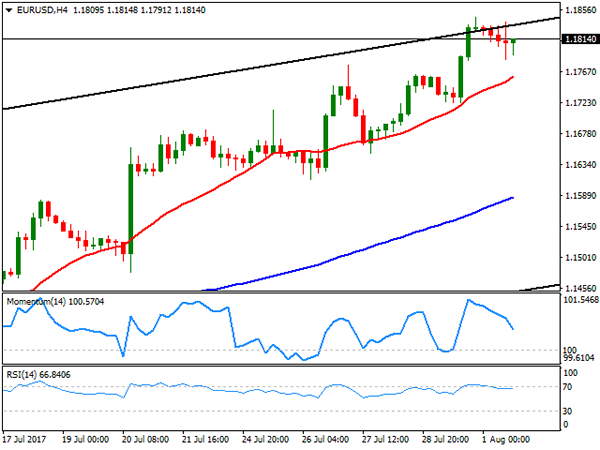
The EUR/USD pair settled lower this Tuesday, but not far below a fresh 2017 high of 1.1845, on a pretty busy macroeconomic day. Data coming from both economies was mixed, with some ups and some downs, nothing however, defining. In the EU, preliminary Q2 GDP came as expected at 06%, up from a previously revised 0.5%, recording the strongest annual growth in six years. The final Markit manufacturing PMI for the region index came in at 56.6 from a flash estimate of 56.8 and June final reading of 57.4, growing at a slower pace, but still indicating expansion in the region.
In the US, personal spending decreased by 0.1% in June, while incomes remained flat when compared to a month earlier, although the PCE index, brought some relief to the greenback posting an annual growth of 1.4%, whilst the core figure resulted at 1.5%, matching previous, but above the expected 1.3%. Given the poor quarterly released attached to GDP last Friday, the inflation component was almost dollar's supportive. More relevant, the ISM manufacturing PMI for July ended at 56.3, down from previous 57.8, a sign of steady growth in the country.
From a technical point of view, the 4 hours chart shows that the pair remained contained below the roof of the ascendant channel, but above bullish moving averages, with the 20 SMA currently around 1.1760. The Momentum indicator pulled sharply lower from overbought territory, while the RSI indicator also heads modestly lower, but holding around 65, yet given the shallow price retracement, chances remain towards the upside, with a bullish breakout of the daily high favoring an extension towards 1.1900 and beyond for this Wednesday.
Support levels: 1.1780 1.1750 1.1715
Resistance levels: 1.1845 1.1870 1.1910
USD/JPY
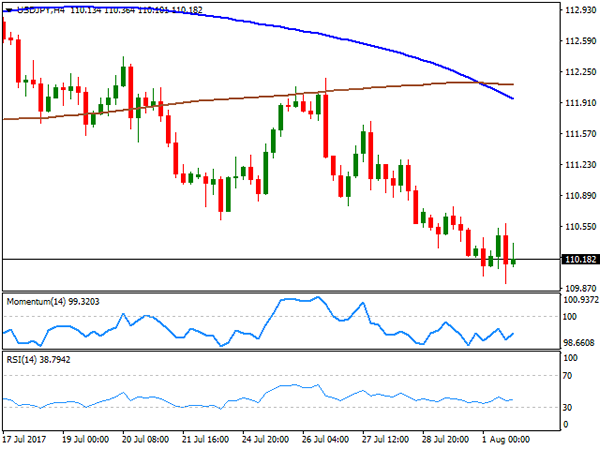
The USD/JPY pair fell for a third consecutive day, reaching a daily low of 109.91 before settling a few pips above the 110.00 threshold, its lowest settlement since mid June. The pair took little cues from US mixed data, lead mostly by a decline in US Treasury yields. After struggling around their Friday's closing levels, yields turned south this Tuesday, with the 10-year note benchmark down to 2.26% from previous 2.29%. Japan will release its July consumer confidence index for July during the upcoming Asian session, expected at 43.6 from previous 43.3. The pair has been posting lower lows and lower highs daily basis since July 26th, which keeps the risk towards the downside. In the shorter term, and according to the 4 hours chart, the risk is also towards the downside, given that the 100 SMA has crossed below the 200 SMA well above the current level, while technical indicators hover directionless within negative territory. June's low of 108.80 is still a possible bearish target, with speculative interest probably taking some profits out of the table once reached.
Support levels: 109.90 109.40 108.80
Resistance levels: 110.35 110.80 111.20
GBP/USD
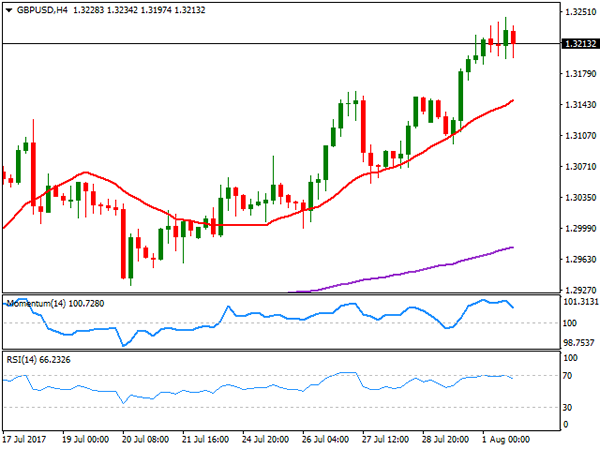
The GBP/USD pair maintained the positive tone, extending its advance up to 1.3243 in a mixture of dollar's weakness and strong local data. The UK manufacturing sector grew at a faster-than-expected pace in July, with the Markit PMI up to 55.1 in the month, beating expectations of 54.3 and above previous 54.2, boosted by stronger inflows of new work, higher levels of production, improved job creation, longer supplier delivery times and a slight increase in inventory holdings, according to the official report. Intraday pullbacks met buying interest at the 1.3190 region, the immediate support, with the downward potential limited to a corrective movement, as in the 4 hours chart, technical indicators are retreating modestly from overbought territory, whilst the price remains firmly above a bullish 20 SMA. Additional gains beyond the mentioned daily high will have an immediate target at 1.3280, where the pair presents multiple daily highs from last August, with a break above it favoring an extension pass 1.3300.
Support levels: 1.3190 1.3150 1.3120
Resistance levels: 1.3245 1.3280 1.3310
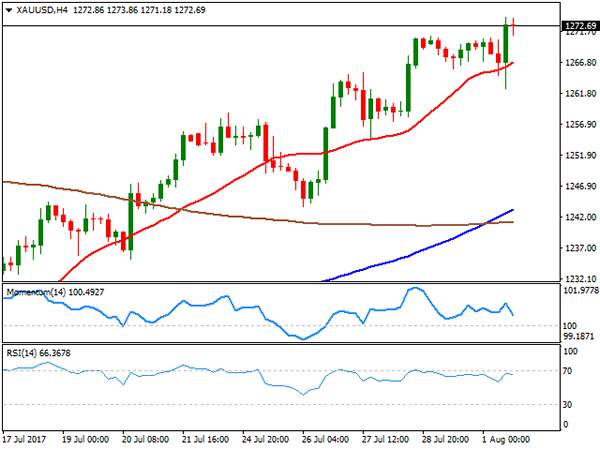
GOLD
Gold prices extended their advances to near 2-month highs, with spot settling at $1,272.80 a troy ounce, not far from a daily high of 1,274.04. The bright metal gained most ground during the US session, as despite not negative, US data released earlier on the day failed to back the case for another rate hike ahead. Also, backing the advance of the metal were easing equities at the end all of the day, as despite closing in the green, US indexes spent most of the session retreating from their early peaks. Spot's daily chart shows that it's still biased north, extending further its advance above all of its moving average, and with the shortest gaining upward momentum well below the current level, whilst technical indicators present a neutral-to-bullish stance within overbought territory. In the 4 hours chart, the price remains above a bullish 20 SMA, with a short-lived slide below it being quickly reverted, and technical indicators retreating within positive territory, hardly enough to confirm a downward move.
Support levels: 1,266.90 1,257.30 1,246.40
Resistance levels: 1,274.05 1,283.30 1,290.10
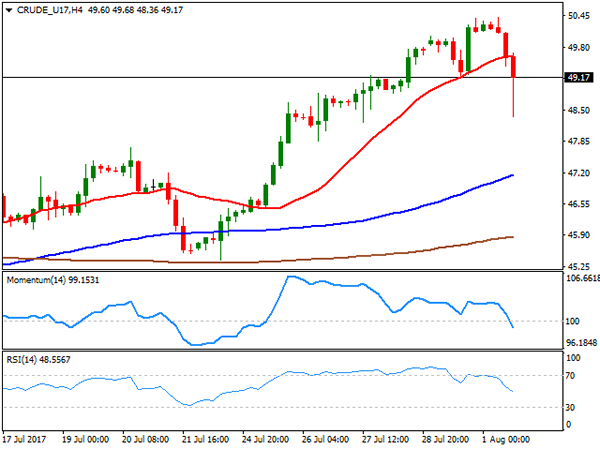
WTI CRUDE OIL
West Texas Intermediate crude oil futures advanced up to $50.41 a barrel at the beginning of the day, but ended the day lower around 49.15, on another report indicating that OPEC's output rose in July, despite the organization output cut deal. After Reuters reported a 90,000 barrels per day increase on Monday, Bloomberg estimated this Thursday that the cartel's output rose by 210,000 barrels a day, while Petro-Logistics said the producer group's output was up by 145,000 barrels a day last month. Ahead of the US stockpiles reports, WTI plunged to 48.36 intraday, retreating from its 200 DMA in the daily chart after flirting with it late Monday, whilst technical indicators in the same chart have turned sharply lower from overbought readings. Still, the price holds above its 20 and 100 SMAs, with the shortest maintaining its bullish slope. In the 4 hours chart, the commodity has turned short-term bearish as technical indicators head south within negative territory, whilst the price broke below a now flat 20 SMA.
Support levels: 48.80 48.30 47.70
Resistance levels: 49.60 50.20 50.85
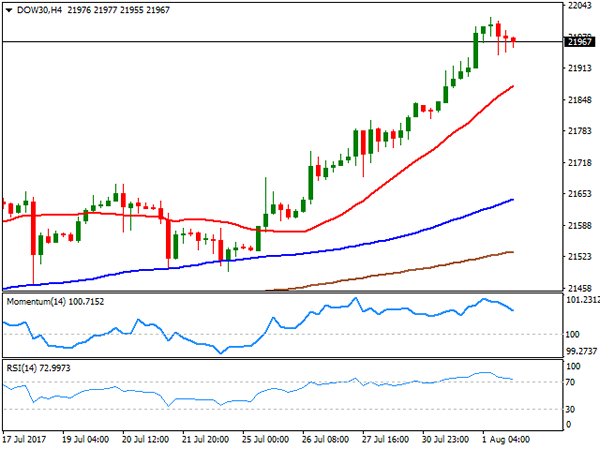
DJIA
US indexes closed in the green, with the Dow Jones Industrial Average reaching an all-time intraday high of 22,018 early session, and settling at 21,963.92, up 72 points or 0.33%. The Nasdaq Composite added 14 points, to settle at 6,362.94, while the S&P gained points to 2,476.35. Within the Dow, Intel Corp was the best performer up 2.48%, followed by Chevron that added 1.46%. Boeing was the worst performer, down 1.25%, followed by Caterpillar that shed 0.75%. Up for a sixth consecutive session , the daily chart for the Dow shows that the RSI indicator advanced further within overbought territory, currently heading north around 74, whilst the Momentum indicator keeps consolidating well above its mid-line, lacking upward strength. In the same chart, the 20 DMA has accelerated its advance, but stands well below the current level, around 21,660. In the 4 hours chart, technical indicators are easing from extreme oversold readings, but the RSI indicator remains above 70, while the 20 SMA advanced further below the current level, all of which maintains the risk towards the upside for the upcoming sessions.
Support levels: 21,940 21,895 21,841
Resistance levels: 21,977 22,030 22,070
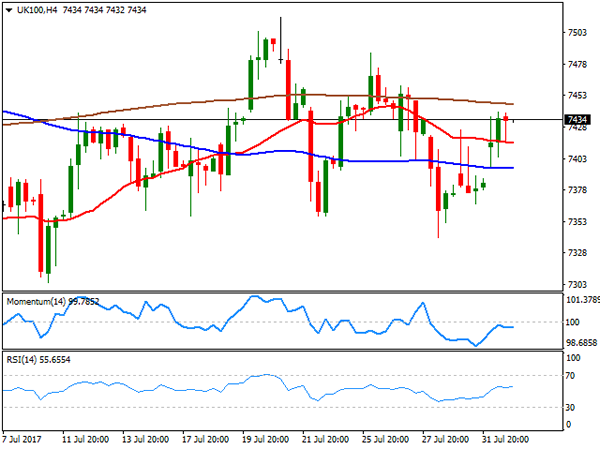
FTSE100
The FTSE 100 closed at 7,423.66, up 52 points this Tuesday, boosted by a positive mood among investors, and strong earnings reports. Rolls Royce was the best performer, up 10.25% after the company reported a 12% raise in revenues to £7.57bn for the first six months of the year, helped by a 27% increase in large engine deliveries. Intertek Group followed, up 9.16% on news that its half-year profits rose more than 20% to £210.3m. Fresnillo was the worst performer, down 2.60%, followed by Mediclinic International that shed 2.03%. The index recovered above its 20 and 100 SMAs in the daily chart, but remains previous highs and with moving averages still lacking directional strength, mostly in a consolidative phase. Technical indicators in the mentioned chart stuck around their mid-lines, also confirm the neutral stance. In the shorter term, and according to the 4 hours chart, the index continues developing between horizontal moving averages, whilst technical indicators continued recovering from near oversold levels before turning flat right below their mid-lines, in line with the longer term perspective.
Support levels: 7,340 7,294 7,257
Resistance levels: 7,440 7,587 7,610
DAX
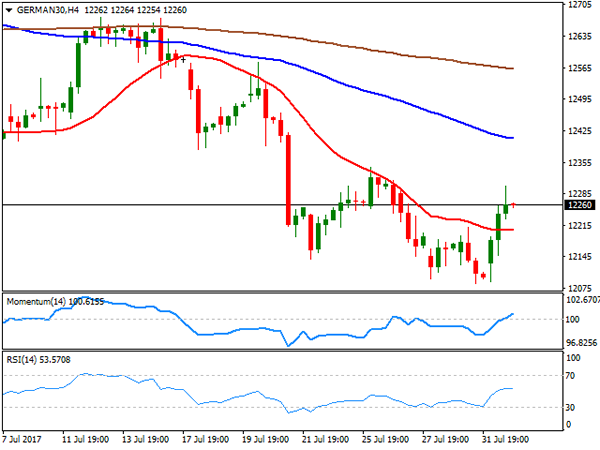
The German DAX added 134 points or 1.10%, to close at 12,251.29, backed by solid local growth reports and the positive momentum among Asian equities. According to Markit, German manufacturing remained in a strong expansionary phase at the start of the second half of 2017, with the PMI printing 58.1 in July, slightly below previous. The best performer was Deutsche Lufthansa, up 3.30%, followed by E.ON that gained 2.79%. Only two members closed lower, Adidas that lost 0.62% and Merck, which closed down 0.61%. In the daily chart, the index remains well below its 20 and 100 DMAs, with the shortest extending below the larger, while technical indicators are barely bouncing from oversold territory, not enough to indicate a steadier recovery ahead. In the 4 hours chart, the upside looks a bit more constructive, as the index settled above its 20 SMA, whilst the Momentum indicator heads north above its 100 level and the RSI consolidates around 53.
Support levels: 12,215 12,161 12,120
Resistance levels: 12,302 12,347 12,383
Technical Outlook: EURUSD Holds Steady Near Fresh Highs Ahead Of US Jobs Data
The Euro stays firm on Wednesday and holding just under Mon/Tue fresh highs at 1.1845 and target at 1.1848 (FE 161.8% of the wave C from 1.1312 trough).
Easing after repeated rejection at 1.1845 on Tuesday was short-lived and contained at 1.1785, with fresh acceleration higher on Wednesday, keeping near-term bulls intact.
Lift above 1.1850 zone would trigger stops parked just above and spark fresh upside extension towards 1.1900 zone (FE 176.4%) and key targets at 1.1950 (monthly cloud base) and psychological 1.2000 barrier.
Overbought daily studies warn of pullback but so far without clearer signal.
Tuesday's low at 1.1785 marks initial support, followed by rising 10SMA at 1.1728, which guards 20SMA at 1.1586.
US jobs data (ADP report today and NFP on Friday) are eyed for signals.
Res: 1.1850, 1.1900, 1.1950, 1.1975
Sup: 1.1785, 1.1728, 1.1671, 1.1638