
Sample Category Title
USD/CAD Continued Decline
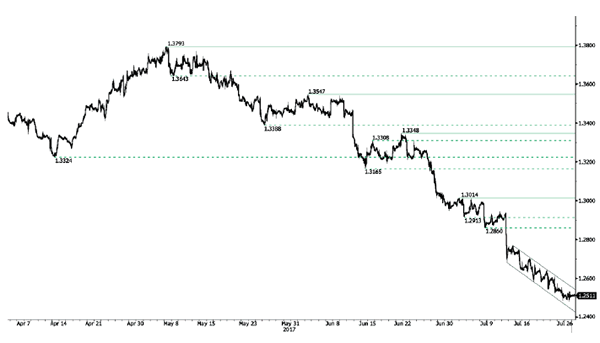
USD/CAD is going lower and the pair remains in a strong bearish momentum. Hourly resistance is given at 1.2701 (17/07/2017). Expected to show continued bearish pressures.
In the longer term, the pair is now monitoring long-term support that can be found at 1.2461 (16/03/2015 low). Strong resistance is given at 1.4690 (22/01/2016 high). The pair should head lower.
USD/CHF Short-Term Surge
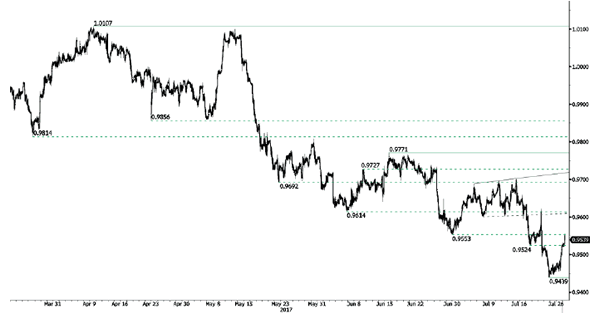
USD/CHF is trading higher. Hourly resistance can be found at 0.9620 (20/07/2017 high). Strong resistance is given at 1.0107 (10/04/2017 high). Expected to to show further bearish consolidation
In the long-term, the pair is still trading in range since 2011 despite some turmoil when the SNB unpegged the CHF. Key support can be found 0.8986 (30/01/2015 low). The technical structure favours nonetheless a long term bullish bias since the unpeg in January 2015.
USD/JPY Bouncing Higher
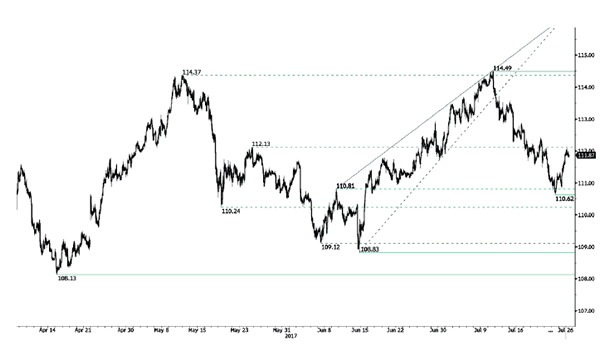
USD/JPY has bounced higher invalidating short-term bearish downtrend. Hourly support is given at 110.62 (24/06/2016 low). Stronger support is located at a distance at 108.83 (17/04/2017 low). Expected to show continued continued upside pressures.
We favor a long-term bearish bias. Support is now given at 96.57 (10/08/2013 low). A gradual rise towards the major resistance at 135.15 (01/02/2002 high) seems absolutely unlikely. Expected to decline further support at 93.79 (13/06/2013 low).
GBP/USD Sideways Price Action
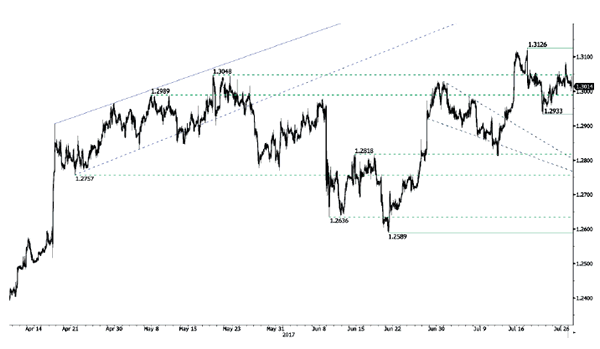
GBP/USD is trading above the 1.3000 mark. Hourly resistance is given at 1.3126 (16/07/2017 high). Hourly support is given at 1.2933 (20/07/2017 low). Expected to show continued bearish pressures.
The long-term technical pattern is even more negative since the Brexit vote has paved the way for further decline. Long-term support given at 1.0520 (01/03/85) represents a decent target. Long-term resistance is given at 1.5018 (24/06/2015) and would indicate a long-term reversal in the negative trend. Yet, it is very unlikely at the moment
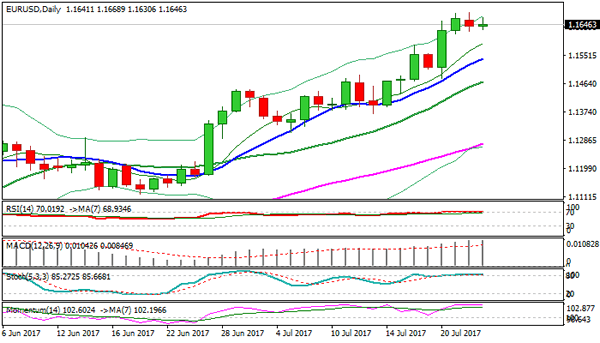
EUR/USD Consolidating After Breaking 1.1700
EUR/USD bullish pressures continue. Hourly resistance is given at 1.1712 (25/07/2017 high). Hourly support can be found at 1.1371 (13/07/2017 high). Stronger support lies at 1.1292 (28/06/2017 low). Expected to show continued bullish pressures.
In the longer term, the momentum is clearly negative. We favour a continued bearish bias towards parity. Key resistance holding at 1.1714 (24/08/2015 high) is on target while strong support lies at 1.0341 (03/01/2017 low).
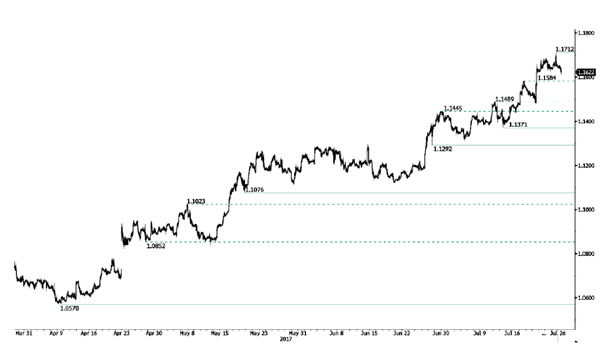
Technical Outlook: EURUSD Eases Further As Dollar Regains Traction
The Euro stands at the back foot on Wednesday and probes below last Friday’s low at 1.1618, which marks significant support.
Strong upside rejection on Tuesday after posting fresh two-year high at 1.1712 that left Doji daily candle with long upper shadow, generated initial negative signal, with single currency also being dragged lower by firmer dollar.
Reversal of daily RSI and slow stochastic from overbought zone generates additional bearish signal.
Dips may extend towards next solid support at 1.1570 zone (Fibo 23.6% of 1.1188/1.1712 upleg), reinforced by rising 10SMA which guards pivot at 1.1485 (Fibo 38.2% / rising 20SMA).
Firm break here would confirm reversal and trigger deeper correction.
The Euro is holding in larger uptrend and current easing is seen as correction before fresh push higher after initial attack at strong resistance zone between 1.1713 and 1.1735 failed.
Deeper correction would signal healthier uptrend with final break above 1.1713/35 pivots expected to spark stronger upside action.
The pair is awaiting comments from Fed later today for fresh direction signals.
Res: 1.1653, 1.1684, 1.1712, 1.1735
Sup: 1.1600, 1.1570, 1.1550, 1.1514
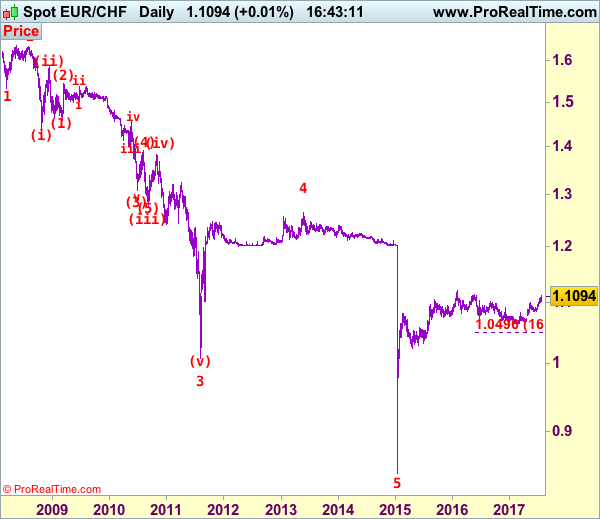
EUR/CHF Elliott Wave Analysis
EUR/CHF : 1.1107
EUR/CHF: Major wave 5 trough ended at 0.8426 and correction has commenced from there for subsequent gain towards 1.1400-1.1500.
The single currency has resumed recent upmove in line with our bullish expectation and our long position entered at 1.0905 finally met our indicated upside target at 1.1105 (with 200 points profit). This anticipated rally adds credence to our view that upmove from 1.0622 low (2016 low) is still in progress and upside bias remains for test of 2016 high of 1.1129, break there would encourage for headway to 1.1200-10, then towards 1.1300, however, loss of upward momentum should prevent sharp move beyond later level and price should falter well below 1.1500.
To recap our preferred count, the decline from 1.6828 (end wave (B)) is labeled as the beginning of wave (C) which should unfold as an impulsive move with 1: 1.5326, 2: 1.6377 and wave 3 is sub-divided into (i): 1.4300, (ii): 1.5880 and wave (iii) is still unfolding with (1): 1.4577, (2): 1.5448 and wave (3) is an extended 3rd with i: 1.5006, ii: 1.5383, wave iii: 1.3073, then wave iv ended at 1.3925 and wave v at 1.3073, wave (4) ended at 1.3925 and wave (5) has ended at 1.2765 which also marked the low of wave (iii) and wave (iv) has ended at 1.3835 and wave (v) as well as larger degree wave 3 has ended at 1.0075. The selloff from 1.2650 signals wave 4 has ended there and we are taking a view that the wave 5 could also have ended 0.8426, hence consolidation is seen with mild upside bias for rebound to 1.1000 first (already met), then towards 1.1400.
On the downside, although initial pullback to 1.1070 is likely, reckon downside would be limited to 1.1000 and support at 1.0980-85 should hold, bring another rise later to aforesaid upside targets. A daily close below 1.0960-65 would defer and suggest a temporary top is possibly formed instead, bring retracement of recent upmove to 1.0900-10, however, still reckon support at 1.0833 would remain intact, bring another upmove next month.
Recommendation: Long entered at 1.0905 met target at 1.1105 with 200 points profit and would stand aside for now.
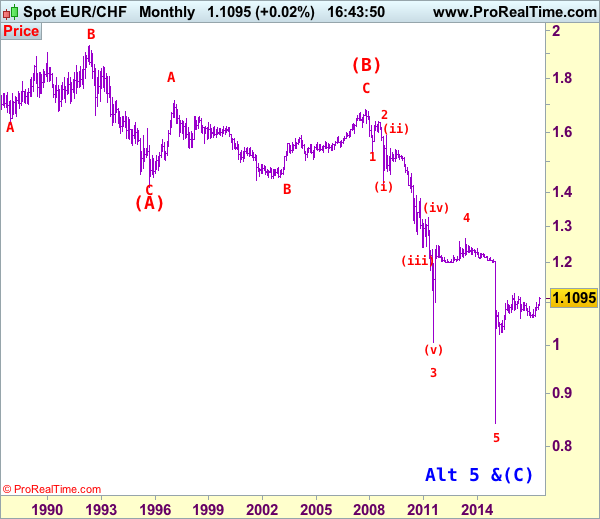
The long-term downtrend started from 1.9626 (Apr 1985) to 1.4166 (Sep 1995) is treated as wave (A) with A:1.6285 (Dec 1987), B: 1.9342 (May 1992) and C: 1.4166, then wave (B) ended at 1.6828 with A: 1.7147 (Feb 1997), B: 1.4398 (Sep 2001), C: 1.6828 (Nov 2007), therefore, wave (C) is now in progress with the breakdown indicated as above. This wave (C) already met indicated downside target at 1.1455/60 and 1.1300, it could have ended at 0.8426, consolidation with mild upside bias is seen for gain to 1.1000 and later towards 1.2000.
FOMC Meeting In Focus, AUD Slides Amid Inflation Weak Data
AUD/USD slides after 2Q CPI misses expectations
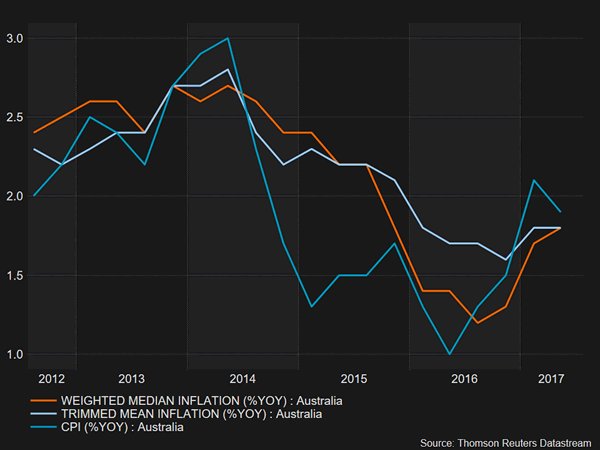
The headline inflation measure fell unexpectedly in the second quarter, printing at 1.9%y/y versus 2.2% expected and down from 2.1% in the previous quarter. This lacklustre reading should be viewed in the context of significantly overly optimistic market participants about the eventuality of a tightening move from the Reserve Bank of Australia. AUD/USD slid 0.50% to 0.7878 this morning as investors priced in the info.
Looking at the details, there is no reason to panic as the core measure remained stable, with the trimmed mean holding up at 1.8%y/y while the weighted mean edged up to 1.8% from 1.7%. Most of the decline in the headline measure is to falling automotive fuel and food and non-alcoholic beverage prices. Overall, tradable components fell 0.3%q/q, while non-tradable components rose 0.4%q/q.
Despite a minor reversal, the Aussie held ground on Wednesday as investors continue to anticipate the RBA will start lifting borrowing costs as soon as Q2 2018. We take a more cautious approach as we believe the central bank is also keen to keep the Australian economy competitive on the international level and with falling inflation measure across the globe, a delay in the tightening process is more than likely.
In the FX market, the Australian dollar had a nice ride since early May. The Aussie rose more than 7% against the greenback, 6.40% against the pound sterling and 5.30%against the Japanese yen. However, we believe there is room for a correction, especially against the US dollar. Indeed, speculators have bet heavily on the Aussie as highlighted by the latest CFTC’s COT report. Long AUD speculative positions rose the highest level since 2013, reaching 43.60% of total open positions. This extreme positioning together with the AUD’s recent sharp rally will likely trigger some significant profit taking. AUD/USD has been unable to break the 0.80 threshold to the upside. From our standpoint, a correction towards the 0.76 area would be more than healthy.
FOMC up next
The divergence between surveys and hard data in the US continued yesterday. The Conference board’s index of consumer confidence increase to 121.1 in July assent expectations for marginal decline. When you compare this to the negative trend in retail sales investors, have a distorted perspective of the US economy. We take a way two key points in this situation, first is that the real economy is underperforming expectations and second that the Fed threshold of reducing their blotted balance sheet is significantly lower than increasing interest rates.
Weak USD was built on the expectations of no hikes in 2017 but seems to sidestep the potentially more destabilizing effect of exit on global yields. Yield spread differentials between US and G10 nations have narrow while VIX index has fallen to new historical lows. Reads suggest that there is limited risk with the Feds current policy path. Markets are uniquely focused on inflation to their detriment, as in our perspective the Fed will continue to tighten via balance sheet reduction regardless of inflations levels.
For today’s FOMC meeting we don’t see any real market impact. We anticipated slight adjustment in languages highlight the transitory weakness inflation and stronger labor markets. More importantly we don’t expect any additional clarity on the fed exit strategy which will likely come in September. USD has become increasingly sensitive to interest rates and with limited expectations for repricing Feds interest rate path, today a reversal in USD is unlikely. Yet additional USD weakness is unlikely do to overstretch short position unless the Fed becoming meaningfully dovish.
Aussie Pulls Back On Softer Growth In Australian Consumer Prices
The aussie weakened in the middle of Asian trading as statistics out of Australia indicated that consumer prices experienced a surprisingly softer increase in the June quarter, justifying the RBA’s last decision to hold interest rates steady and lengthening the odds for another rate hike.
On Wednesday, in the middle of the Asian session, the Australia Bureau of Statistics published CPI readings for the second quarter of the year. According to the numbers, headline CPI grew by 0.2% on a quarterly basis, instead of 0.4% as expected, falling below the previous month’s mark of 0.5% and reaching the lowest growth since the beginning of 2016. The main driver of this adjustment was the decrease in travel and accommodation prices (-3.2%) as well as in automobile prices (-2.5%) which offset price rises in hospital and medical services (4.1%). On a yearly basis, CPI fell to 1.9%, surprising analysts who anticipated that inflation would climb to 2.2% from 2.1% in the previous quarter.
Excluding 30% of the volatile products, the trimmed mean CPI was in line with expectations, standing flat at 0.5% quarter-on-quarter, while the annual figure slipped from 1.9% to 1.8%. Reducing price volatility even more (50%), the weighted median CPI was higher at 0.5% compared to 0.4% in the previous quarter, as analysts anticipated. The yearly change beat the forecast of 1.7% which was also the first quarter’s figure, rising slightly to 1.8%.
After the data release, the RBA Governor Philip Lowe said in Sydney he was “very comfortable” with holding interest rates steady at 1.5%, as inflation does not show any signs of approaching the target range of 2-3% so far. Instead, he stated, he was satisfied with the RBA’s accommodative policy as this strategy expands employment and therefore assists households to repay their debts which currently amount to 190% of their disposable income. Note that, full employment in June touched a multi-year high with unemployment remaining flat at 5.6%, while wage growth in the March quarter rose by 1.9% year-on-year for the third consecutive quarter. As the RBA Chief Philip Lowe and Deputy Governor Guy Debelle, who recently supported the view that there is no reason for the bank to follow its peers by tightening monetary policy, are in no rush to change their monetary strategy, the odds for another rate hike in the near future are receding.
Turning to the forex markets, the aussie reacted immediately to the data sinking by 0.50% against the dollar to $0.7896 and touching a one-week low.
AUD/USD Elliott Wave Analysis
AUD/USD – 0.7903
AUD/USD – Wave 5 of C and (B) has possibly ended at 1.1081
Aussie has rallied after finding decent demand at 0.7571 earlier this month and upmove has accelerated after breaking resistance at 0.7750 as well as last year’s high at 0.7835, adding credence to our bullish count for the medium term erratic rise from 0.6827 (2016 low) to bring retracement of early downtrend, hence gain to 0.8000 psychological level would be seen, break there would encourage for subsequent rise to 0.8100 but previous resistance at 0.8163 would hold from here due to near term overbought condition.
We are keeping our count that top has been formed at 1.1081 (wave 5 of V) and major correction (A-B-C-X-A-B-C) has commenced, indicated downside targets at 0.7945 (61.8% Fibonacci retracement of entire rise from 0.6007-1.1081) and 0.7750 had been met and downside bias is seen for further weakness to 0.6800, then 0.6700 but reckon 0.6500 would hold from here.
Our preferred count is that the rally from 0.6007 to 0.7270 (7 Jan 2009) is marked as wave A, the retreat to 0.6248 (2 Feb 2009) is wave B and the subsequent upmove is labeled as wave C with wave (iii) and wave (iv) ended at 0.8265 and 0.7700 respectively and wave (v) as well as 3 ended at 0.9407, then wave 4 ended at 0.8066 (instead of 0.8578). The wave 5 has met our indicated projection target of 1.1060 and could ended at 1.1081, this level is now treated as the peak of wave (C) as well as larger degree wave B, hence major fall in wave C has commenced, our initial downside target at psychological support at 0.7000 has just been met and further weakness to 0.6500 would be seen later.
On the downside, whilst initial pullback to 0.7830 (38.2% Fibonacci retracement of 0.7571-0.7990) cannot be ruled out, reckon 0.7780-86 (50% Fibonacci retracement and previous support) would hold and bring another rise later to aforesaid upside targets. A daily close below there would defer and risk correction to 0.7730-35 (61.8% Fibonacci retracement) but only break of another previous resistance at 0.7712 (wave i top) would confirm top has been formed.
Recommendation: Buy at 0.7800 for 0.8000 with stop below 0.7700.

Our alternate count on the daily chart treated the top formed in 2008 at 0.9851 could be a larger degree wave I and was followed by a deep and sharp correction in wave II to 0.6007 and wave III is unfolding from there.
The long-term uptrend started from 0.4775 (2 Apr 2001) with an impulsive structure. Wave I is labeled as 0.4775 to 0.9851 (15 Jul 2008), wave II has ended at 0.6007 (Oct 2008) and wave III is still in progress which may extend further gain to 1.1265.
