
Sample Category Title
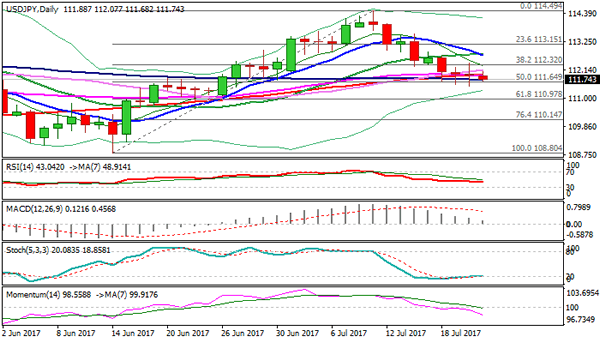
Technical Outlook: USDJPY – Pivotal Supports At 111.64/48 Remain Under Pressure
The pair stays at the back foot on Friday and keeps near-term risk shifted lower, despite repeated failure to close below Fibo support at 111.64 (50% of 108.80/114.49 upleg).
Double-Doji on Wed/Thu signaled indecision of bears from 114.49 (11 July high) but strong upside rejections of recovery attempts kept the pair under pressure.
Bear-cross of 10/20SMA which is forming above is increasing bearish pressure.
Firm break below 111.64 would open next supports at 111.23 (daily cloud top), 110.97 (Fibo 61.8% of 108.80/114.49 upleg) and 110.76 (daily cloud base).
The pair is on track for the second weekly bearish close which signals strong bearish stance.
Alternative scenario requires sustained lift above 112.70 to sideline bears and signal stronger recovery.
Res: 112.07, 112.67, 112.70, 113.00
Sup: 111.64, 111.48, 111.23, 110.97
The Euro Analysis Like No Other
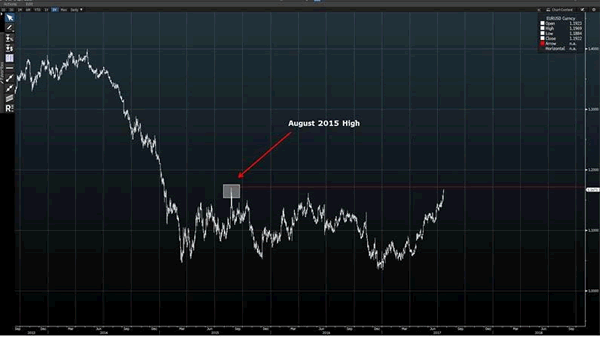
It was Halloween for Draghi yesterday. Whatever Draghi was selling yesterday no one was buying it, or perhaps he has the worst selling skills. The euro-dollar pair has touched another high for this year and it appears that the pair is ready to rip apart any resistance which is in its way. The next major resistance is at 1.1714, the August 2015 high. We are up 10.78% YTD and that is a remarkable performance for the currency, especially when many were talking about the euro parity against the dollar. The Euro was the best performer yesterday among the G10.
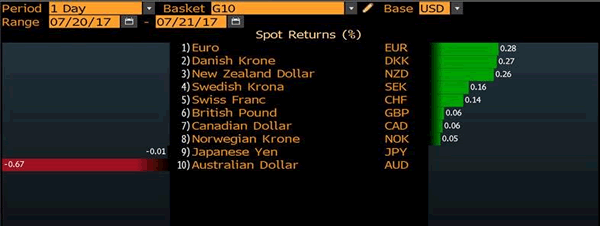
It was Halloween for Draghi yesterday. Whatever Draghi was selling yesterday no one was buying it, or perhaps he has the worst selling skills. The euro-dollar pair has touched another high for this year and it appears that the pair is ready to rip apart any resistance which is in its way. The next major resistance is at 1.1714, the August 2015 high. We are up 10.78% YTD and that is a remarkable performance for the currency, especially when many were talking about the euro parity against the dollar. The Euro was the best performer yesterday among the G10.
The relationship which matters the most is the one between the euro and the equity market. If the currency traders loved the fact that the ECB's head is against the ceiling and they will have no choice but scale back, the equity traders are apprehensive of the fact that a higher euro is going to eat up their profit.
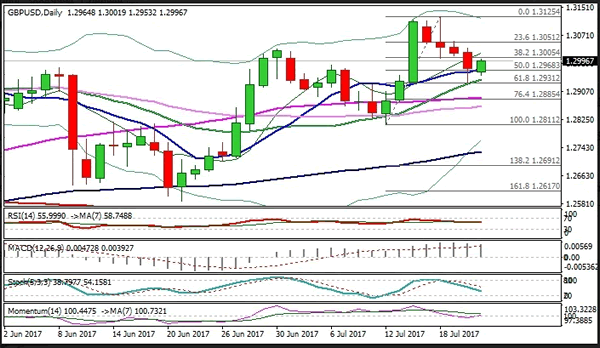
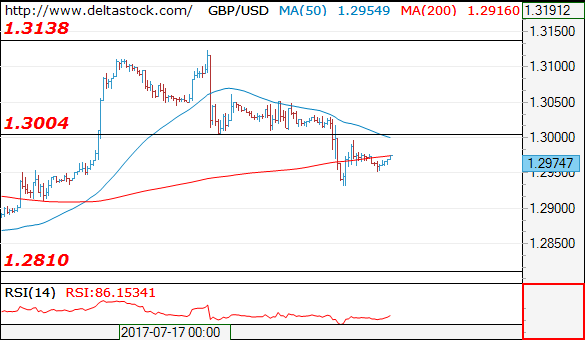
Technical Outlook: Cable Is Consolidating Above Strong Support At 1.2931, N/T Risk Remains Skewed Lower
Cable is trading higher on Friday and pressuring 1.3000 level, now reverted to resistance, after four-day weakness off 1.3125 peak found footstep at strong 1.2931 support (Fibo 61.8% of 1.2811/1.3125 upleg/rising 20 SMA). Sterling remains under pressure on weaker than expected UK inflation numbers which have reduced the risk of BoE rate hike and may extend weakness, as daily cloud is twisting next week (1.2760) and may attract for fresh bears. Sustained break below 1.2931 pivot would open targets at 1.2885 (55SMA) and 1.2857 (daily Kijun-sen). Corrective upticks should be ideally capped at 1.3000 zone, as descending hourly cloud (1.3010/1.3040) weighs on near-term action. Only firm break above 1.3050 (Fibo 61.8% of 1.3125/1.2932 pullback) would neutralize existing downside threats and shift near-term focus higher
Res: 1.3000, 1.3040, 1.3050, 1.3080
Sup: 1.2953, 1.2931, 1.2885, 1.2857
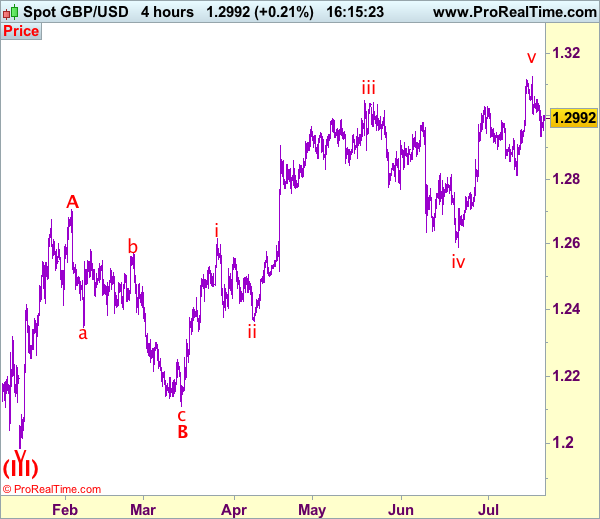
Trade Idea: GBP/USD – Sell at 1.3050
GBP/USD – 1.2997
Recent wave: Wave V of larger degree wave (III) has ended at 1.1986 and major correction has commenced from there for gain to 1.3000 and 1.3140-50
Trend: Near term up
Original strategy :
Sell at 1.3050, Target: 1.2850, Stop: 1.3110
Position: -
Target: -
Stop: -
New strategy :
Sell at 1.3050, Target: 1.2850, Stop: 1.3110
Position: -
Target: -
Stop:-
Although cable has recovered after finding support at 1.29\33 yesterday and consolidation above this level would be seen today, if our view that a temporary top is possibly formed at 1.3126 is correct, upside should be limited to 1.3040-50 and bring another decline later, below said support would add credence to this view, bring retracement of recent upmove to 1.2910-15, break there would provide confirmation, then further fall to 1.2870-80 would follow but reckon support at 1.2812 would remain intact, bring rebound later.
Our preferred count on the daily chart is that cable's rebound from 1.3500 (wave (A) trough) is unfolding as a wave (B) with A ended at 1.7043, followed by triangle wave B and wave C as well as wave (B) has ended at 1.7192, the subsequent selloff is the larger degree wave (C) which is still unfolding with minor wave (III) of larger degree wave 3 ended at 1.1986, hence wave (IV) correction is in progress which could either be a triangle wave (IV) of a complex formation but upside should be limited to 1.3500 and price should falter well below 1.4000, bring another decline in wave (V) of 3 for weakness to 1.1500, then 1.1200.
On the upside, whilst recovery to 1.3010-20 cannot be ruled out, price should falter below resistance at 1.3062 and bring another retreat later. A break above this week’s high of 1.3126 would signal recent upmove is still in progress and may extend headway to 1.3150, then towards 1.3190-00 but loss of upward momentum should limit upside to 1.3250, bring another retreat later.
Forex Technical Analysis: EUR/USD, USD/JPY, GBP/USD
EUR/USD
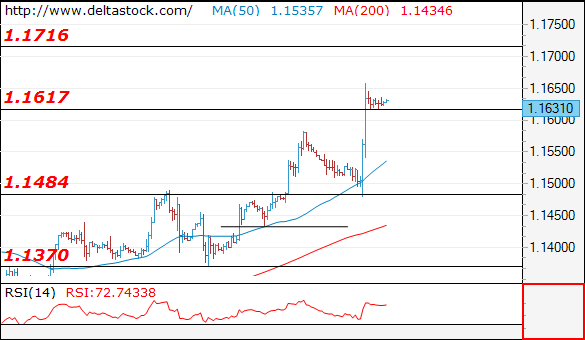
Current level - 1.1631
Yesterday's precise test at 1.1480 has finalized the consolidation pattern below 1.1580 and the uptrend was renewed, breaking beyond 1.1610 hurdle. The bias remain bullish above 1.1580, for a rise towards 1.1720. Crucial on the downside is 1.1480 low.
| Resistance | Support | ||
| intraday | intraweek | intraday | intraweek |
|
1.1350 |
1.1720 |
1.1580 |
1.1370 |
|
1.1720 |
1.1720 |
1.1480 |
1.1290 |
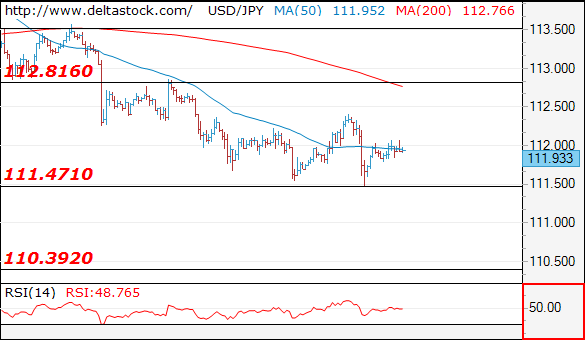
USD/JPY
Current level - 111.93
My outlook remains negative, for a break through 111.47 low, towards 110.30 area. Initial resistance lies at 112.40.
| Resistance | Support | ||
| intraday | intraweek | intraday | intraweek |
|
112.40 |
114.50 |
111.50 |
111.75 |
|
112.80 |
115.50 |
110.30 |
110.20 |
GBP/USD
Current level - 1.2974
The downtrend from 1.3125 is still intact while below 1.3004 minor resistance, but my outlook is already counter-trend against 1.2910, for a reversal and rise towards 1.3130 zone.
| Resistance | Support | ||
| intraday | intraweek | intraday | intraweek |
|
1.3004 |
1.3260 |
1.3910 |
1.2810 |
|
1.3130 |
1.3500 |
1.2810 |
1.2480 |
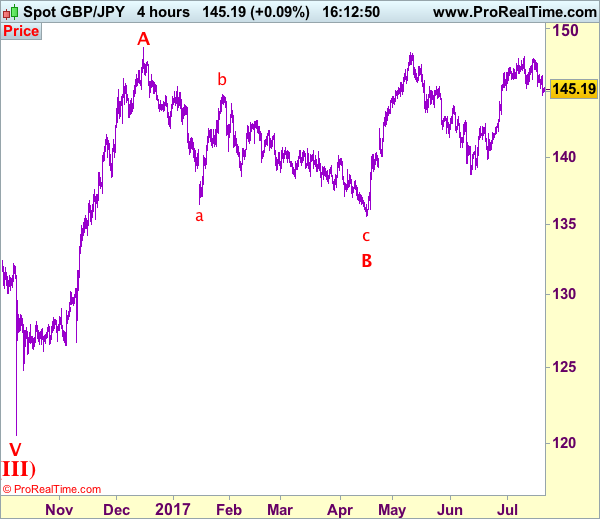
Trade Idea: GBP/JPY – Sell at 147.00
GBP/JPY - 145.23
Recent wave: Medium term low formed at 120.50 and (A)-(B)-(C) major correction has commenced with (A) leg ended at 148.45, hence wave (B) is unfolding for retreat to 131.00-10.
Trend: Near term up
Original strategy:
Sell at 147.00, Target: 145.00, Stop: 147.60
Position: -
Target: -
Stop: -
New strategy :
Sell at 147.00, Target: 145.00, Stop: 147.60
Position: -
Target: -
Stop:-
Sterling has fallen again after brief recovery, adding credence to our view that further consolidation below last week’s high at 147.75 would be seen and mild downside bias remains for retracement of recent upmove and weakness to 144.70, then 144.50 is likely, however, near term oversold condition should limit downside to 144.20 and price should stay well above 143.30, bring rebound later.
In view of this, would not chase this fall here and we are looking to sell sterling on recovery as 147.00 should limit upside, bring another decline. Above 147.60 would risk test of said resistance at 147.75 but break there is needed to revive bullishness and extend recent upmove to previous resistance at 148.10, above there would bring headway to 148.50, then towards 149.00.
Our preferred count is that larger degree wave V with circle is unfolding from 251.12 with wave (I) 219.34, (II): 241.38 and wave (III) is subdivided into 1: 192.60, 2: 215.89 (23 Jul 2008) and wave 3 ended at 118.87 earlier in 2009. The correction from there to 162.60 is wave 4 which itself is a double three and is labeled as first a-b-c ended at 151.53, followed by wave x at 139.03, 2nd a ended at 162.60, 2nd b at 146.75 and 2nd c leg of wave 4 ended at 163.00. Therefore, the decline from 163.00 to 116.85 is now treated as wave 5 which also marked the end of larger degree wave (III), hence wave (IV) major correction has commenced for retracement of the wave (III) from 241.38 and upside target at 183.95-00 (50% Fibonacci retracement of the wave (II) from 241.38) had been met, a drop below 160.00 would suggest wave (IV) has ended at 195.85, bring decline in wave (V) for initial weakness to 130 (already met) and 120.
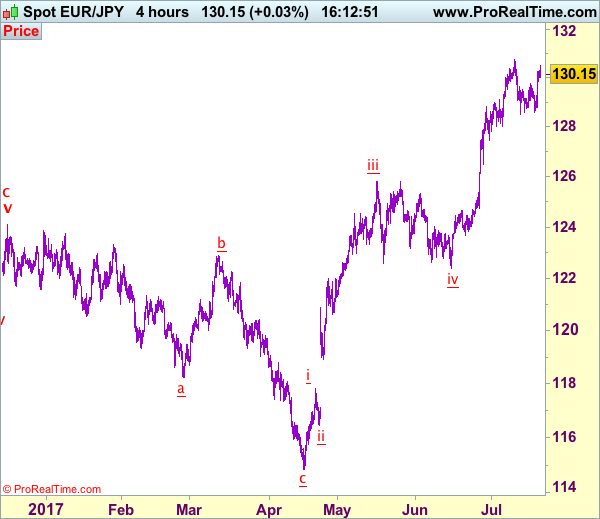
Trade Idea: EUR/JPY – Stand aside
EUR/JPY - 130.09
Recent wave: wave v of (C) ended at 94.12 and major correction in wave A has ended at 149.79
Trend: Near term up
Original strategy:
Sold at 129.70, stopped at 130.30
Position: - Short at 129.70
Target: -
Stop: - 130.30
New strategy :
Stand aside
Position: -
Target: -
Stop:-
Although euro’s rebound turned out to be stronger than expected and upside risk is seen for a retest of recent high at 130.77, however, break there is needed to retain bullishness and signal recent upmove has resumed for headway to 131.00-10, then towards 131.50, however, loss of upward momentum should prevent sharp move beyond latter level and reckon 132.00 would hold from here, risk from there is seen for a retreat later.
In view of this, would not chase this rise here and would be prudent to stand aside in the meantime. Below 129.35 (previous minor resistance) would prolong consolidation and bring weakness to 128.80-85, then test of previous support at 128.49, only break there would signal top has been formed at 130.77 early last week, bring retracement of recent upmove to 128.00, then towards previous support at 127.44.
Our latest preferred count is that wave (ii) is ABC-X-ABC which ended at 123.33 and wave (iii) is unfolding with wave iii ended at 100.77, followed by wave iv at 111.57 and wave v as well as the wave (iii) has ended at 97.04, followed by wave (iv) at 111.43 and wave (v) has ended at 94.12 which is also the end of the larger degree v, this also implied the major wave (C) has also ended there, hence major correction has commenced from there with (A) leg unfolding in its lower degree wave c which has possibly ended at 145.69. Under this count, A-B-C wave (B) has commenced with A leg ended at 136.23, wave B at 143.79 and wave C has possibly ended at 149.79.
Our larger degree count is that the decline from 139.26 is wave (C) and is sub-divided into a diagonal triangle i-ii-iii-iv-v with wave i - 105.44, wave ii- 123.33, wave iii - 97.03, wave iv - 111.43, followed by the final wave v as well as the end of wave (C) at 94.12, this also mark the bottom of larger degree wave B. Under this count, major rise in wave C has commenced as an impulsive wave with minor wave III ended at 145.69, wave V is still in progress for further gain to 150.00. Having said that, this so-called wave V could well be the first leg of larger degree 5-waver wave C and this wave C should bring at least a retest of wave A top at 169.97 (July 2008).
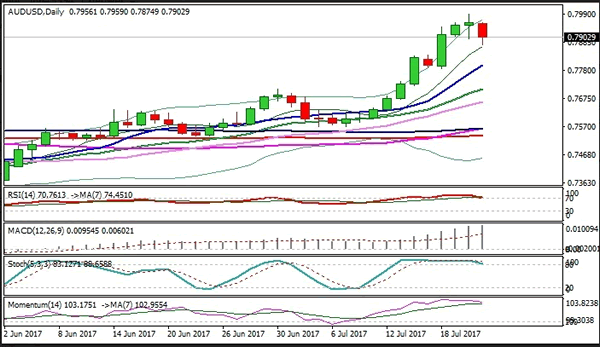
Technical Outlook: AUDUSD Lower On RBA’s Debelle Comments, Reversal Pattern Is Forming
The Aussie fell below 0.7900 handle in Asia on Friday, after RBA Assistant Governor Debelle said there was no automatic reason for rates to rise following recent hawkishness among global policymakers. Debelle cooled markets after the Australian dollar was inflated by hawkish RBA minutes earlier this week, sending the Aussie into correction. Technicals support such scenario after Thursday's trading was shaped in Doji candle (signaling strong indecision ahead of psychological 0.8000 barrier) and fresh easing on Friday is forming reversal pattern. Bearish close below 0.7900 is needed to confirm and open way for deeper correction of steep ascend from 0.7572 (07 July trough) to 0.7983 (20 July peak). Strongly overbought daily studies support the notion, as RSI and slow stochastic south and are about to emerge from o/b zone and generate bearish signal. Deeper pullback could extend towards 0.7830 (Fibo 38.2% of 0.7572/0.7988 rally), which is also the ideal length of the current fourth (corrective) wave, of five-wave cycle from 0.7535 (22 June low).
Res: 0.7959, 0.7988, 0.8000, 0.8044
Sup: 0.7890, 0.7874, 0.7830, 0.7800
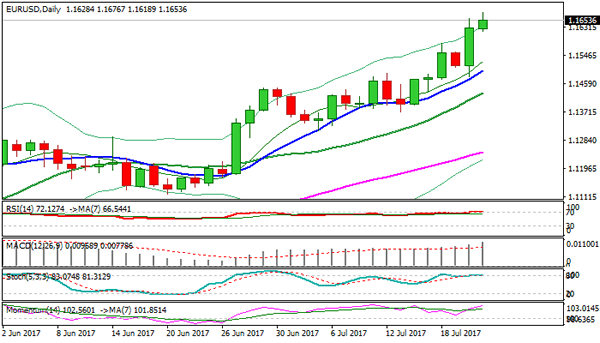
Technical Outlook: EURUSD Remains Firm Post ECB, May Show Hesitation Ahead Of Key 1.1713/35 Barriers On O/B Conditions
The Euro remains firm and extends gains on Friday, heading towards key barriers at 1.1713/35 (Fibo 61.8% of 1.2567/1.0340 downleg / Fibo 38.2% of 1.3992/1.0340 fall).
The Euro was inflated by comments from the ECB President Draghi on Thursday, when the central bank left its interest rates and QE programme unchanged and setting no precise date for discussion about tapering. However, Draghi’s remark about further discussion in autumn was seen as hawkish and boosted the single currency, which holds in an uninterrupted ascend since early April. Shallow dips in the rally of past few month confirm the strength of the rally which may extend further on firm break above 1.1713/35 pivots.
Meanwhile, overbought conditions on larger timeframes (daily / weekly) suggest that the pair may enter consolidative phase under 1.1713/35 barriers. Extended downside attempts should be ideally contained at 1.1500 zone, former strong barrier, now reverted to support.
However, correction could extend towards 1.1350/1.1300 zone before broader bulls resume. Break of key 1.1713/35 barriers is needed to signal base at 1.0350/1.0450 zone and spark stronger correction of 1.3992/1.0340 (May 2014 / Jan 2017 descend) towards psychological 1.2000 barrier, also the base of descending monthly Ichimoku cloud).
Res: 1.1676, 1.1713, 1.1735, 1.1800
Sup: 1.1618, 1.1583, 1.1556, 1.1523
Trade Idea: AUD/USD – Buy at 0.7800
AUD/USD – 0.7901
Recent wave: Wave 5 ended at 1.1081 and major correction has commenced for fall to 0.7000 and then towards 0.6500-10
Trend: Near term up
Original strategy :
Buy at 0.7800, Target: 0.7990, Stop: 0.7740
Position: -
Target: -
Stop: -
New strategy :
Buy at 0.7800, Target: 0.7990, Stop: 0.7740
Position: -
Target: -
Stop:-
As aussie met renewed selling interest at 0.7970 and has retreated again, retaining our view that further consolidation below this week’s high of 0.7990 would be seen and initial downside risk remains for correction to 0.7840-50, however, reckon downside would be limited to 0.7800 and support at 0.7786 should hold, bring another rise later, above 0.7970 would bring retest of 0.7990 but break of psychological resistance at 0.8000 is needed to retain our bullish count for recent impulsive waves (1 2, (i)(ii), i ii) to extend headway to 0.8040-50, having said that, price should falter below 0.8100.
In view of this, would not chase this rise here and we are looking to buy aussie on subsequent pullback as 0.7800 should limit downside, bring another upmove later. Below support at 0.7786 would defer and suggest wave iii top is formed, bring correction in wave iv to 0.7750 but wave i top at 0.7712 should remain intact.
On the 4-hour chart, the move from 0.8066 is the wave 5 with i: 0.8860, ii: 0.8315, wave iii is an extended move ended at 1.0183, iv: 0.9706 and wave v has ended at 1.1081 (also the top of entire wave 5). The subsequent selloff is the major correction which is unfolding as ABC-X-ABC and 2nd A leg has ended at 0.8848, followed by a-b-c wave B which ended at 0.9758, hence, 2nd C wave is now in progress and indicated downside target at 0.7000 and 0.6950 had been met, so further fall to 0.6710-20 cannot be ruled out.
