Sample Category Title
Elliott Wave Analysis: AUDUSD Trading Higher
AUDUSD is making an intra-day rally away from 0.7802 level, where sub-wave iv of 3 had potentially ended. If that is the case, the final wave v of three is in motion, that can search for a top around the upper two channel lines. Once the lower channel line gets taken out, a new three wave reversal into black wave 4 can come in play.
AUDUSD, 1H
USD Struggles Not to Lose Further Ground
- European stock markets trade volatile near opening levels today with the German Dax (-0.35%) underperforming. Markets are mainly counting down to Thursday's ECB meeting. US stock markets opened nearly unchanged.
- Eurozone CPI rose 1.3% Y/Y in June (0.0% M/M), according to the final reading which came in line with an initial estimate. Inflation fell back from 1.4% in May having spiked at a three-year high of 1.9% in April. Details showed stronger services inflation was one of the reasons for a rise in core inflation to 1.1% in June (from 0.9% in May).
- A Bloomberg national poll shows that, in nearly every measure of his performance, Trump's presidency is not wearing well with the public. 55% view him unfavourably, up 12 points since December. The American people do however feel fairly optimistic about their jobs, the strength of the economy and their own fortunes.
- The New York Fed Empire manufacturing index disappointed with a reading of 9.8. in July (consensus of 15.0). A decline from the 19.8 in June was expected but the extent of the decline surprised markets. Indexes assessing the six-month outlook suggest that firms remain positive about the future, though less so than in June.
- Bankers with knowledge of the matter stated that Greece is looking, for the first time in three years, to sell five-year government bonds this week or next. This is remarkable given that Athens has received three bailouts in the past seven years and the debate over whether debt write-downs are needed continues as the IMF deems Greece's debt unsustainable and on an "explosive" path.
Rates
Countdown to ECB policy meeting
Global core bonds traded with a minor upward bias in an uneventful European trading session. European stock markets traded volatile, but couldn't influence the Bund's performance. EMU eco data (final CPI inflation) also failed to trigger a market reaction ahead of Thursday's ECB meeting. Many investors turn more cautious ahead of that meeting. Will Draghi downplay some of his hawkishly interpreted comments in Sintra or will he confirm them? The latter could spark unwanted market volatility as an official announcement on QE tapering is only expected in September.
Core bonds painted an intraday topping off pattern during US dealings despite a weaker-than-expected US Empire Manufacturing index. A JPM report arguing in favour of a Fed balance sheet announcement at the July 26 FOMC meeting might have played a role. We only expect such an announcement at the September meeting.
At the time of writing, the German yield curve drops up to 1.5 bps lower with the belly of the curve outperforming the wings. Changes in the US yield curve vary between -0.4 bps (2-yr) and -1.3 bps (10-yr). On intra-EMU bond markets, 10-yr yield spread changes versus Germany range between -1 bp and +1 bp.
Currencies
USD struggles not to lose further ground
Trading in the major FX cross rates took a very slow start for the new week. EUR/USD settled close to the recent top, but there was no trigger to kick-start a real test. USD/JPY traded with a slightly negative bias intraday as did core bond yields. The pair trades in the 112.40 area.
Chinese data, including Q2 GDP printed stronger than expected this morning. The impact on regional equity sentiment was mixed given headlines that Chinese authorities considered more regulation and less easy financial conditions. USD/JPY stabilized in the 112.40/70 area after Friday's sell-off. AUD/USD held north of 0.78, maintaining last week's impressive gains. EUR/USD (1.1460/75 area) hovered near the recent top, but no test occurred.
There was absolutely no story to guide USD trading this morning. European equities failed to join the positive momentum from the US on Friday. EUR/USD and EUR/JPY fell prey to short-term profit taking as investors looked forward to Thursday's ECB meeting, but the move didn't go far. Dollar weakness still prevailed going into the open of the USD markets. EUR/USD reversed the earlier dip. USD/JPY struggled not the return below the 112.40/50 area. The EMU CPI was confirmed at 1.3% Y/Y but was largely ignored.
By default dollar softness persisted early in US dealings. The Empire manufacturing survey eased from 19.8 to 9.8 (15.0 was expected). The reaction of the dollar was again negligible. USD/JPY trades in the 112.40/50 area. EUR/USD is still going nowhere in the 1.1465/70 area. The dollar continues to trade weak, but there is still no strong enough trigger to push the pair beyond the 1.1489/1.15 resistance. Will this change before Thursday's ECB meeting?
Sterling rebound slows
Last week's sterling rally slowed this morning and the UK currency fell prey to a modest reversal. Last week, there was no high profile story behind the sterling comeback. This was also the case for today's setback. There were plenty of headlines on discord within the UK government going into the next round of negotiations with the EU. Market doubts the UK government's ability to execute a coherent Brexit-strategy which prevents further sterling gains. Cable dropped off this morning's top north of 1.31 and trades currently again in the 1.3070 area. EUR/GBP shows tentative signs of a bottoming out process. The pair is changing hands in the 0.8770 area. EUR/USD strength is also slowing last week's correction of EUR/GBP.
Japan 225 Index Records 10-day Low; Remains Bullish in the Medium-term
The Japan 225 index has declined in the three previous trading days. In today's trading, it recorded a ten-day low of 19,980. Despite this fall in recent days, the index has been in large part moving sideways over the last number of weeks.
The stochastics are pointing to negative momentum over the short-term. Specifically, the %K line is edging further down into bearish territory, while it crossed below the slow %D line.
If the index rises, the area around the middle Bollinger line - a 20-day moving average (MA) line - at 20,100 could pose a barrier to the upside. Notice that the index briefly rose above this level in today's trading before retreating back below it. Further above, the area around the upper Bollinger band at 20,261 could provide additional resistance.
On the downside, the current level of the 50-day MA and lower Bollinger band, ranging from 19,948 to 19,935, might offer support. Below this territory, the focus would shift to the area around the one-month low of 19,840 for additional support.
Regarding the medium-term, it currently looks bullish mostly due to the significant advancing since mid-April and up to the second half of June - the index hit a twenty-three-month high of 20,322 on June 20. The price is above the 50- and 200-day MAs at the moment, while the 200-day MA is steeply upward sloping.
Spot Gold Moved Higher on Monday
Spot Gold moved higher on Monday, extending last Friday's strong rally when yellow metal rallied, supported by weaker dollar, hit by weak US data.
Recovery rally from $1204 (10 July low) is riding on the third wave which commenced from $1214 (Friday's low) and eyes its 100% Fibonacci expansion at $1236, to validate wave principles.
Next strong barrier lies immediately above at $1239 (double Fibonacci resistance, 38.2% of entire $1296/$1204 descend and 61.8% of $1258/$1204 downleg) and sustained break here would trigger fresh extension of recovery after initial reversal signal was generated on Friday's rally above trendline resistance at $1223 (bear-trendline from $1296 peak).
Broken 200SMA offers immediate support at $1233, followed by $1229 (former highs of 5/6 July / top of thick 4-hr cloud) where dips should be ideally contained.
Res: 1236; 1239; 1242; 1244
Sup: 1233; 1229; 1225; 1220
USD/CHF Mid-Day Outlook
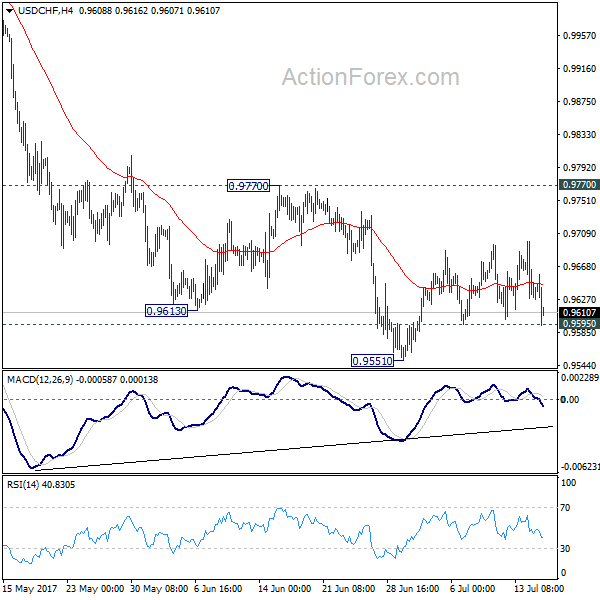
Daily Pivots: (S1) 0.9609; (P) 0.9654; (R1) 0.9680; More...
Intraday bias in USD/CHF remains neutral as consolidation from 0.9551 continues. In case of another rise, upside should be limited by 0.9770 resistance and bring fall resumption. Below 0.9595 minor support will turn bias to the downside. Break of 0.9551 will extend the whole fall from 1.0342 and target 0.9443 key support level next. At this point, we'd expect strong support from there to bring rebound. Meanwhile, firm break of 0.9770 will indicate near term reversal, on bullish convergence condition in 4 hour MACD.
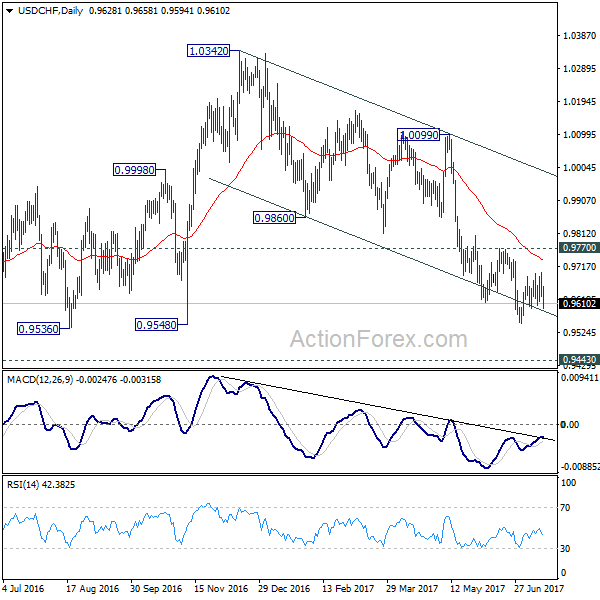
In the bigger picture, USD/CHF is still bounded in medium term range of 0.9443/1.0342 for the moment. Consolidative trading would likely continue and medium term outlook remains neutral. Break of 1.0342 key resistance is needed to confirm underlying bullish momentum in the pair. Meanwhile, downside attempts should be contained by 0.9443 key support level. However, sustained break of 0.9443 will carry larger bearish implication and target 0.9 handle.
EUR/USD Mid-Day Outlook
Daily Pivots: (S1) 1.1415; (P) 1.1443 (R1) 1.1495; More.....
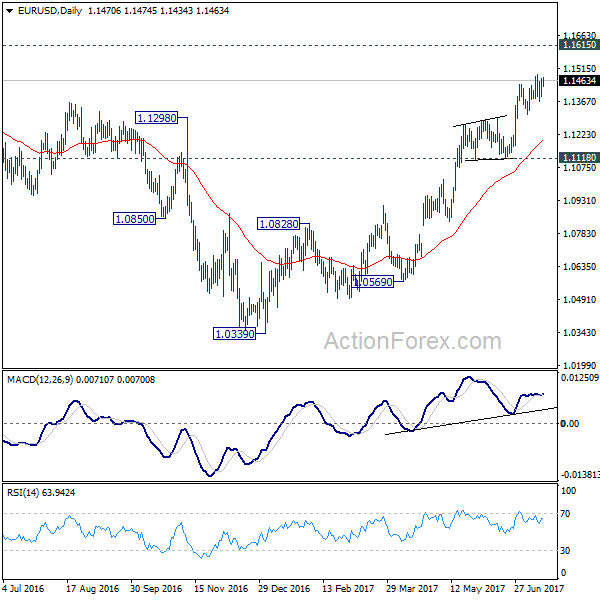
Intraday bias in EUR/USD remains neutral for the moment as consolidation from 1.1489 might extend. Below 1.1312 will bring deeper fall to 55 day EMA (now at 1.1201). In that case, downside should be contained by 1.1118 support to bring rise resumption. On the upside, break of 1.1489 will extend recent rally from 1.0339 to 1.1615 key resistance next.
In the bigger picture, the firm break of 1.1298 resistance further affirm medium term reversal. That is, an important bottom was formed at 1.0339 on bullish convergence condition in weekly MACD. Further rise would be seen to 55 month EMA (now at 1.1763). Sustained break there will pave the way to 38.2% retracement of 1.6039 (2008 high) to 1.0339 (2017 low) at 1.2516 next. This will now remain the favored case as long as 1.1118 support holds.

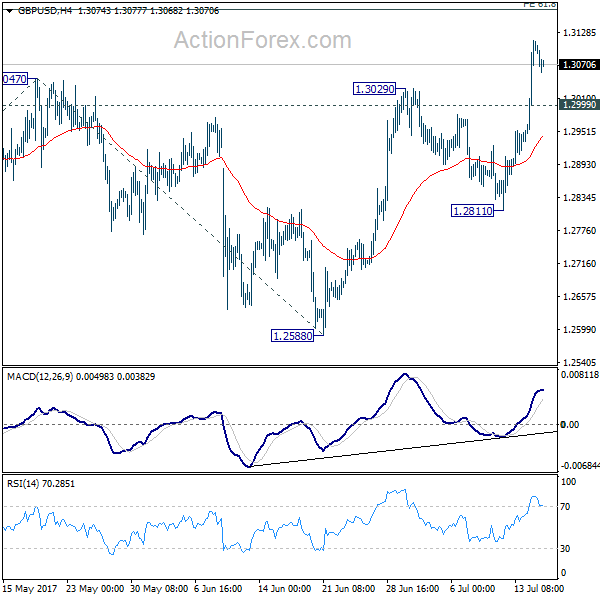
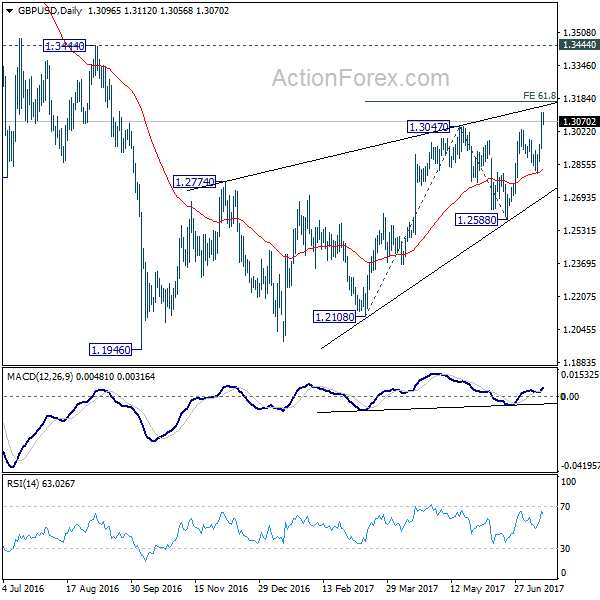
GBP/USD Mid-Day Outlook
Daily Pivots: (S1) 1.2986; (P) 1.3049; (R1) 1.3165; More...
Intraday bias in GBP/USD remains on the upside for 61.8% projection of 1.2108 to 1.3047 from 1.2588 at 1.3168. Overall, choppy rebound from 1.1946 is seen as a corrective pattern, hence, we'd be cautious on strong resistance from 1.3168 to limit upside. But firm break of 1.3168 will bring further rise towards 1.3444 key resistance. On the downside, below 1.2999 minor support will turn intraday bias neutral first.
In the bigger picture, overall, price actions from 1.1946 medium term low are seen as a corrective pattern that is still in progress. While further upside is expected, overall outlook remains bearish as long as 1.3444 key resistance holds. Larger down trend from 1.7190 is expected to resume later after the correction completes. And break of 1.2588 will indicate that such down trend is resuming.
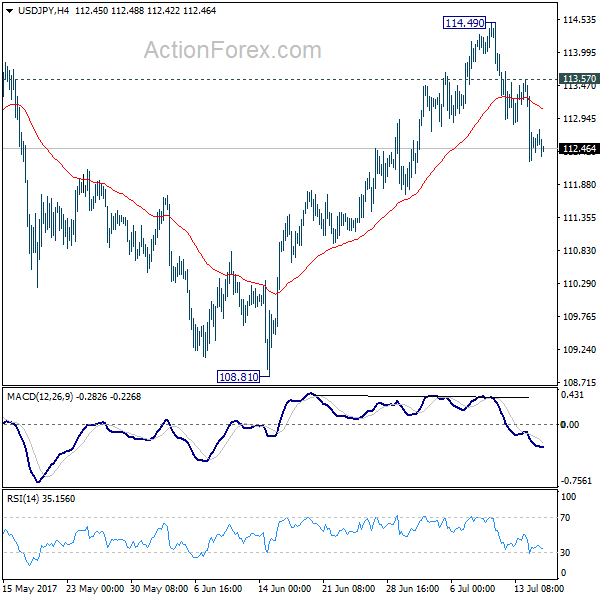
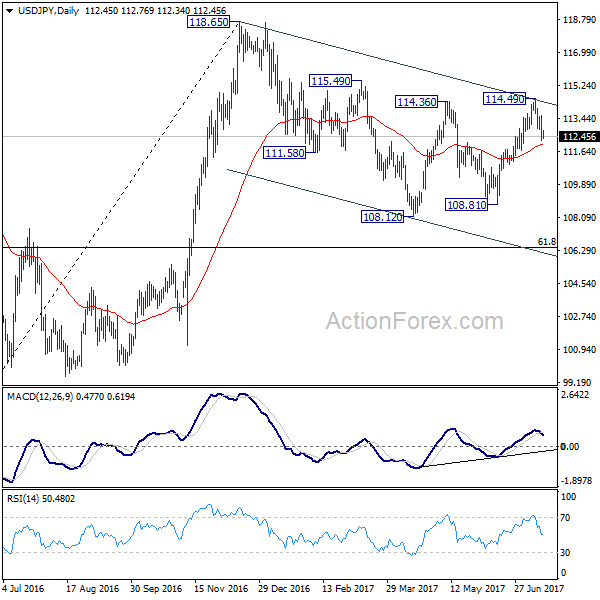
USD/JPY Mid-Day Outlook
Daily Pivots: (S1) 111.98; (P) 112.78; (R1) 113.30; More...
Intraday bias in USD//JPY remains on the downside for 55 day EMA (now at 112.03). The rejection from 114.36 resistance suggests that whole correction from 118.65 is possibly still in progress. Sustained break of 55 day EMA will pave the way to 108.12 and below. On the upside, above 113.57 minor resistance will turn focus back to 114.49 resistance instead.
In the bigger picture, the corrective structure of the fall from 118.65 suggests that rise from 98.97 is not completed yet. Break of 118.65 will target a test on 125.85 high. At this point, it's uncertain whether rise from 98.97 is resuming the long term up trend from 75.56, or it's a leg in the consolidation from 125.85. Hence, we'll be cautious on topping as it approaches 125.85. If fall from 118.65 extends lower, down side should be contained by 61.8% retracement of 98.97 to 118.65 at 106.48 and bring rebound.
Aussie Stands Tall after Chinese GDP Growth Surpasses Expectations
China, the world's second largest economy and a driver of the emerging markets, has overperformed in terms of growth in the second quarter of the year, proving relief to policymakers who are currently engaged in efforts to limit financial risks from soaring debt levels and a brewing property bubble. Following the statistics, the Australian dollar bounced higher, reaching a more than one-a year high.
According to the National Bureau of Statistics of China, the Chinese economy grew at 6.9% year-on-year in the second quarter, beating the target of 6.5% set by the government and surprising analysts who anticipated that GDP will expand by 6.8%. Quarter-on-quarter, GDP growth was in line with expectations at 1.7% but was higher than the 1.3% estimated in the previous quarter.
Part of the expansion was attributed to the manufacturing sector, where the industrial output rose by 7.6% in June year-on-year, restoring the two-year high level reached in March. The figure was far above the forecast of 6.5% which was set at May's reading.
Other data out of China involved fixed asset investments and retail sales. The former was above the forecast but remained stable at the previous level of 8.6%, while the latter increased by 11%, higher than the 10.6% anticipated and the rate of 10.7% observed in May.
Although the above numbers are evidence of a stabilizing and sustainable economic growth, concerns remain around the high-leveraged housing market, where prices are also rising rapidly. Based on OECD calculations, the debt of non-financial entrepreneurs in China was the highest among major economies at 170% of GDP in 2016. To cool the overheated property market, the People's Bank of China (PBOC) has recently decided to restrict liquidity by tightening monetary policy, following the Fed's rate hike in March. Particularly, the PBOC has mainly targeted the short-term rates, increasing the seven-day repo rate (repurchase agreement rate) to a two-year high of 3.18% in the beginning of May.
In the forex markets, the release of the data lifted the Australian dollar against its US counterpart. The aussie surged immediately by 0.73%, hitting a near 15-month high of $0.7833.
AUD/USD Mid-Day Outlook
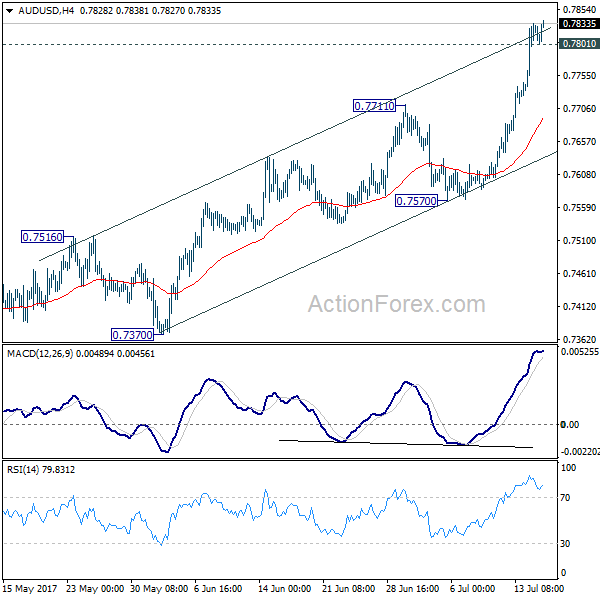
Daily Pivots: (S1) 0.7755; (P) 0.7794; (R1) 0.7864; More...
AUD/USD's rally is still in progress and edges higher to 0.7838. Intraday bias remains on the upside at this point. Firm break of 0.7833 resistance will confirm resumption of whole rebound from 0.6826 bottom. In such case, AUD/USD would target 61.8% projection of 0.6826 to 0.7833 from 0.7328 at 0.7950 next. On the downside, below 0.7801 minor support will turn intraday bias neutral first. But near term outlook will stay cautiously bullish as long as 0.7570 support holds.
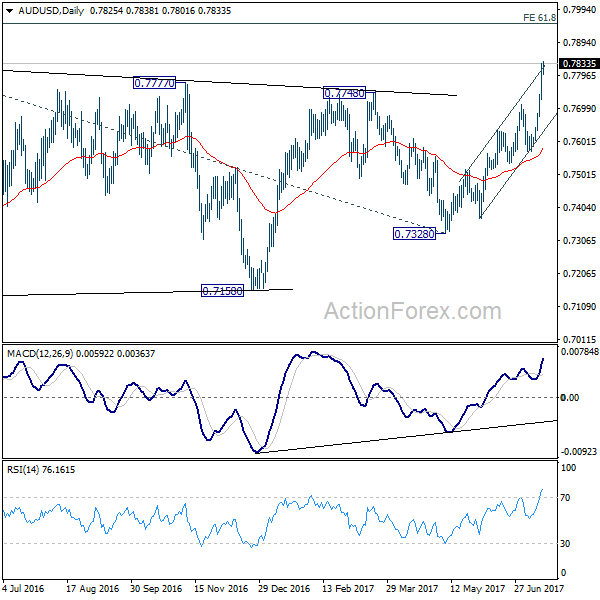
In the bigger picture, current development suggests that rebound from 0.6826 is developing into a medium term rise. There is no confirmation of trend reversal yet and we'll continue to treat such rebound as a corrective pattern. But in any case, further rise is now expected to 55 month EMA (now at 0.8100) or even further to 38.2% retracement of 1.1079 to 0.6826 at 0.8451. Break of 0.7328 support is needed to confirm completion of the rebound. Otherwise, further rise is now in favor.