
Sample Category Title
21 – Understanding Harmonic Price Patterns
Harmonic price patterns comprise another set of chart formations involving Fibonacci retracement and extension levels. The rule of thumb in trading these patterns is to wait for the entire formation to be completed before entering any long or short positions.
There are six main kinds of harmonic price patterns, namely the ABCD, the three-drive, the Gartley, the crab, the bat, and the butterfly. The last three chart pattern names are based on the animals that the chart patterns resemble. This makes it easier for traders to remember what kind of harmonic price pattern is forming.
First off, the ABCD pattern is comprised of lines AB and CD known as the legs and line BC, which is the retracement. Here are the bullish and bearish illustrations of the ABCD pattern.
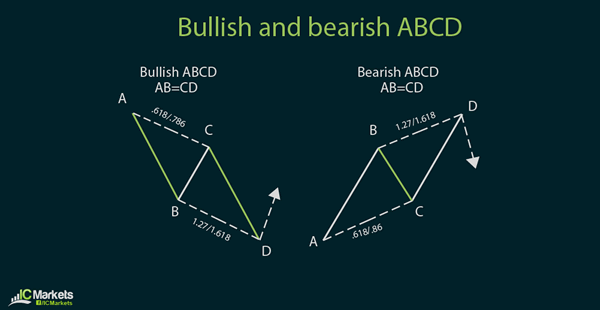
For this pattern to be valid, the length of leg AB should be around the same as the length of leg CD.
Next, the three-drive pattern is similar to the ABCD pattern, except that it has three legs and not just two. This is also a variation of the basic 5-3 Elliott Wave pattern discussed in the previous section.
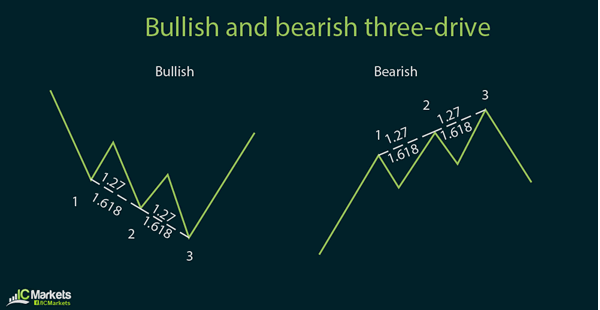
For this pattern to be valid, the legs of the three-drive need to be equal in length. Aside from that, the time it takes for each leg to be completed should also be equal.
In the 1930s, stock market advisor Harold McKinley Gartley applied scientific and statistical methods to come up with a set of harmonic price patterns guiding traders on what to trade and when to enter trades. The most basic among these patterns is the "222 Pattern" found on Gartley's book entitled Profits in the Stock Market.
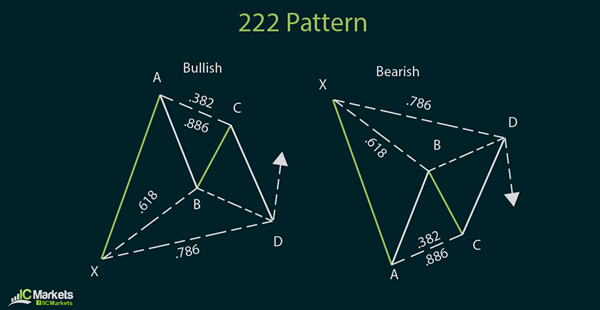
These 222 patterns form as corrective formations in the middle of an overall trend, telling the trader when to take a trade and take advantage of the trend continuation at a bargain price. These reversal points are marked by Fibonacci retracement and Fibonacci extension levels.
For the pattern to be valid, it should have the following characteristics:
- Move AB should be the .618 retracement of move XA.
- Move BC should be either .382 or .886 retracement of move AB.
- If the retracement of move BC is .382 of move AB, then CD should be 1.272 of move BC. If move BC is .886 of move AB, then CD should extend 1.618 of move BC.
- Move CD should be .786 retracement of move XA
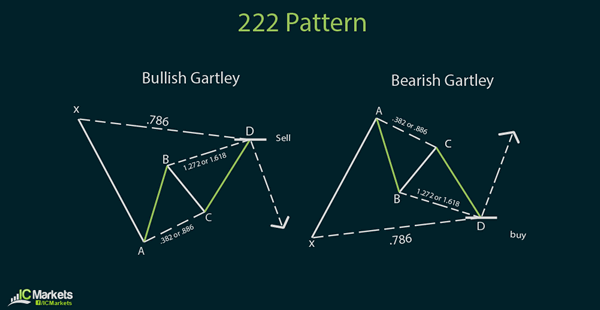
The crab, bat, and butterfly patterns are simply variations of this basic 222 pattern, based on varying levels of the Fibonacci retracement and extension points.
20 – Elliott Wave Analysis 101
A combination of repeating price patterns with Fibonacci analysis yields another branch of technical analysis known as Elliott Waves. This is named after its founder Ralph Nelson Elliott who analyzed 75 years' worth of stock data before formulating and compiling his theories in a book entitled The Wave Principle. He discussed how price movements are not completely random and that markets traded in repeating cycles. He noted that the upward or downward swings in price action are a result of a collective market psychology, central to which are emotions of traders. In his book, he outlined ways in which traders can catch trends at ideal prices as he detailed methods of catching market corrections and continuations. One of the most basic wave patterns discussed in his book is the 5-3 pattern, wherein the first five waves are the impulse waves and the last three waves are corrective waves.
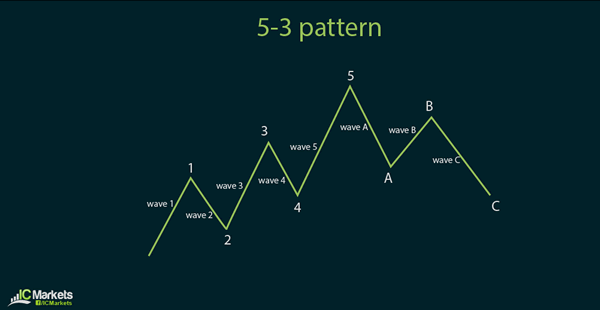
The first wave consists of the initial move upwards (or downwards in a downtrend) which is sparked by a sudden influx of buyers (or sellers), spurred to take long (or short) positions and causing the price to make a big rally (or selloff). The second wave occurs in the opposite direction of the first one as traders book profits off a key inflection point or start to believe that the asset or currency pair is already overvalued (or undervalued). This leads to a move lower (or higher) but not beyond the initial price before the first wave started. The third wave takes place when more buyers (or sellers) pay attention to the asset and see that it is moving in a strong trend. This pullback allows them to get in the trend at a relatively good price so they set their long (or short) orders and push the price up (or down). The fourth wave happens because traders once again think that the asset is becoming overvalued and that it may be time to book profits once again. The fifth and last wave occurs to extend the price rally to a point wherein it becomes extremely overvalued (or undervalued), before the trend starts to reverse. The first, third, or fifth impulse waves may have a chance of being extended, which means that they can be longer than the other two impulse waves. Again, this depends mostly on market psychology or sentiment. Apart from that, fundamental and technical factors may also combine for a stronger push in price action. What's particularly interesting about Elliott Waves is that you can see these impulse and corrective waves occur in longer-term time frames and even as you zoom in to much shorter-term time frames, such as the 1-minute chart. Elliott has mentioned that there are roughly 21 wave patterns illustrating this phenomenon. These depend on the strength of the waves or the sharpness or shallowness of each pullback. These can be in the form of zig-zags, flat formations, or triangle patterns – all of which have the same general appearance as the 5-3 wave pattern. What's important to note about these Elliott Waves are the three cardinal rules. First is that the third wave can never be the shortest impulse wave. Second is that the second wave can never go beyond the start of the first wave. Third is that the fourth wave can never cross into the same area as the first wave.
19 – Basic Forex Chart Formations
Aside from technical indicators and Japanese candlestick patterns, another main component of technical analysis is chart formations. Remember that the concept behind technical analysis is that price patterns tend to repeat themselves, which means that these chart patterns more or less result to the same price behavior later on.
The sheer number of classic chart formations may seem intimidating and difficult to memorize at first but this comes with practice. More often than not, the names of the chart formations describe how the patterns look like on the charts.
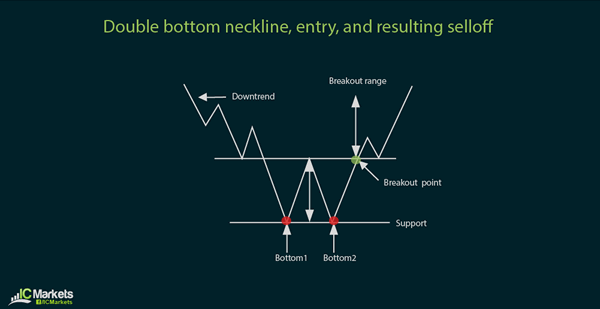
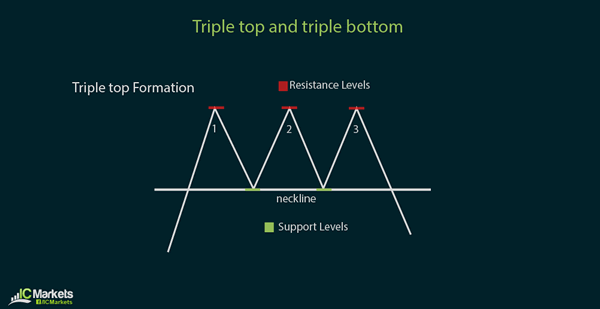
For instance, the double top and double bottom patterns are one of the easiest ones to remember. A double top looks like two peaks in price action while the double bottom looks like two lows.
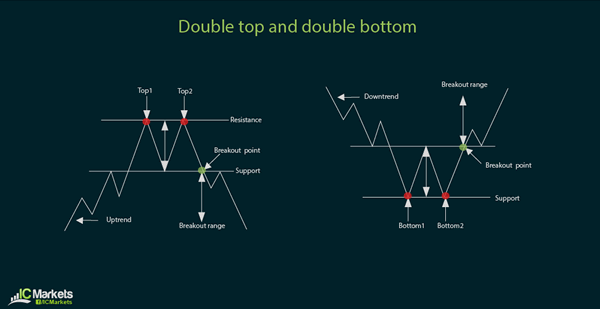
These are considered reversal signals, as a break beyond the neckline of the formation suggests the start of a new trend. To trade this, you can set a buy order above the neckline of a double bottom or set a sell order below the neckline of a double top.
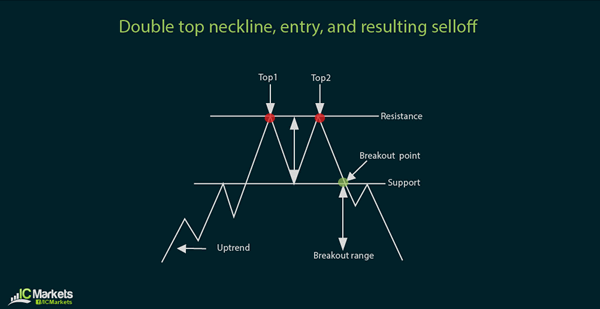
Drawing necklines take practice but a good rule of thumb to remember is to simply connect the price turn in between the bottoms or the tops with a horizontal line.
A variation of the double top and double bottom is the triple top and triple bottom, which are also reversal signals. These are rare finds though but can be potent signals of a new trend.
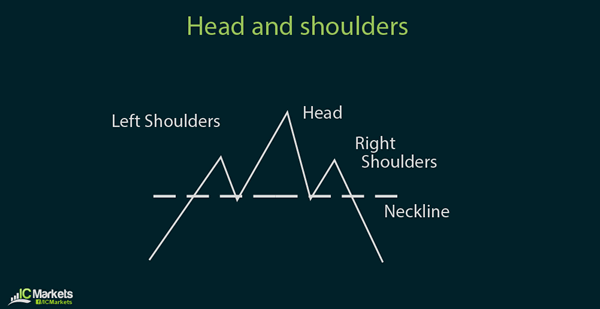
A more complex reversal chart pattern is the head and shoulders. When it forms on top of an uptrend, it is a sign that a selloff might take place if price is able to break below the neckline.
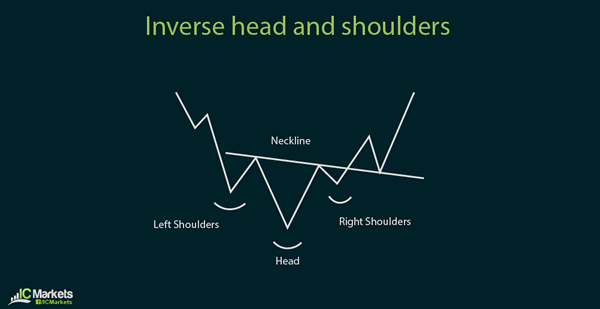
Conversely, an inverse head and shoulders pattern forming at the bottom of a downtrend is a sign that price will turn and may move in an uptrend after breaking above the neckline.
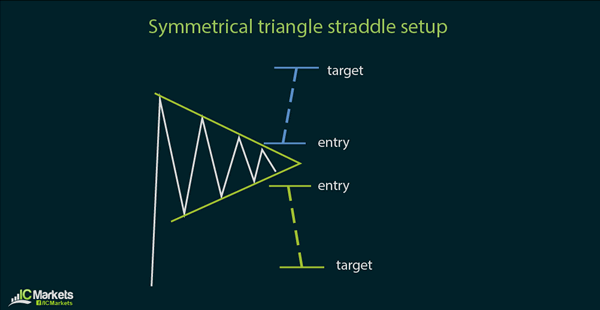
Another group of chart patterns is the triangle formations. These can be descending, ascending, or symmetrical.
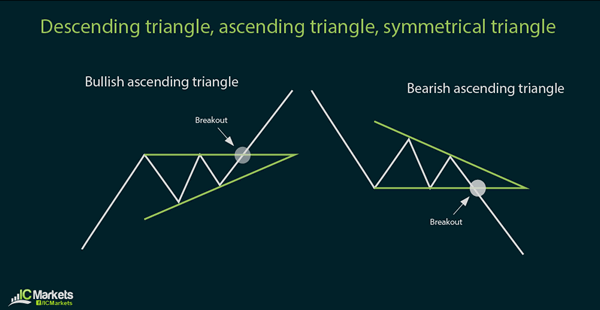
There is no hard and fast rule in saying whether these formations result to reversals or continuations. When price is consolidating tighter towards the rightmost tip of the triangle, it is a sign that a breakout may occur in either direction. Traders try to catch an up or down move by setting buy and sell orders outside the triangle.
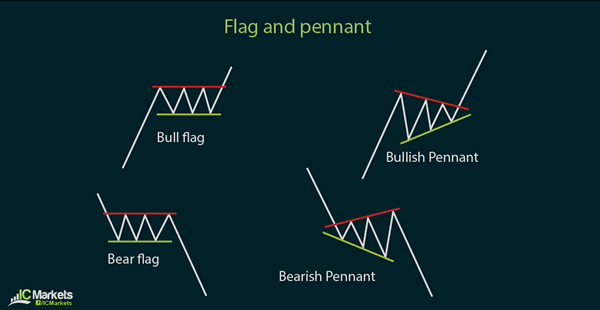
Last but not least, another popular group of chart formations are the flags and pennants. These are typically treated as continuation patterns, as price simply consolidates for a short while inside a flag or pennant before resuming its ongoing trend.
There are other kinds of chart patterns such as wedges or cup and handle formations, which will be covered in a later section.
18 – Using Momentum or Lagging Indicators
As opposed to leading indicators which generate early trade signals, momentum or lagging indicators give confirmation signals when the trend has already found directional momentum. Because of that, lagging indicators are also known as trend-following indicators.
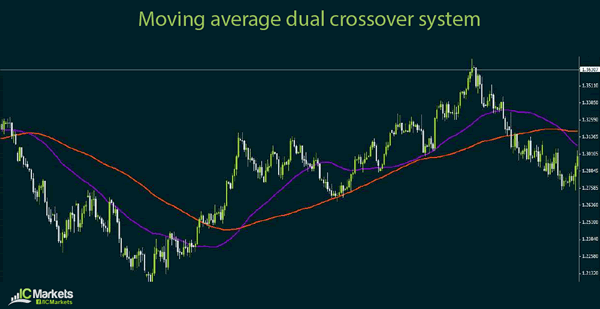
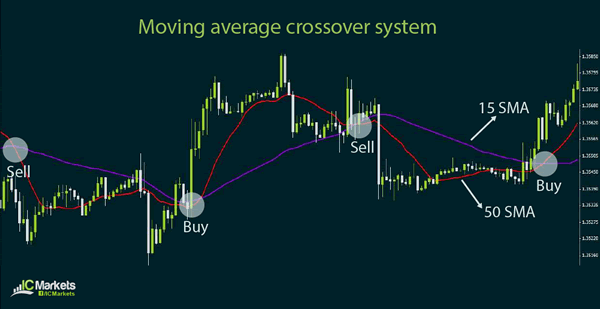
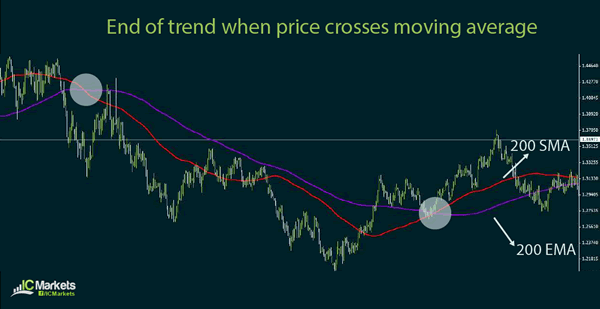
One of the most basic examples of lagging indicators is the moving average crossover system. This can employ either simple or exponential moving averages with different parameters in combination to come up with buy or sell signals. When the shorter-term moving average crosses above the longer-term moving average, it is considered a buy signal. When the shorter-term moving average crosses below the longer-term moving average, it can be a sell signal.
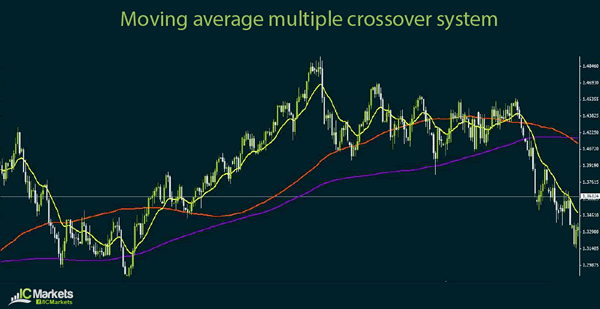
Some traders opt to use a number of moving averages in combination. Conservative rules suggest that when the moving averages are arranged in a descending manner from top to bottom, it could be a sell signal. When moving averages are arranged in an ascending manner from top to bottom, it could be a sell signal.
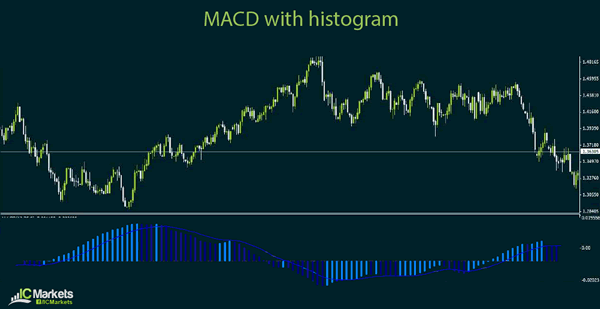
Another kind of lagging indicator is the MACD, which is short for moving average convergence divergence. As the name suggests, this method also makes use of moving averages but focuses more on the convergence or divergence of these indicators.
The MACD chart also includes the histogram, which keeps track of the difference between the moving average. The criss-crossing lines at the bottom, which is the actual MACD, shows the moving average of the difference between the moving averages.
As mentioned in an earlier section, it is not important to memorize how these indicators are derived but that it is more crucial to understand how to apply them. While the MACD may seem like a complicated tool at first, it pretty much functions in the same manner as moving averages.
When the MACD lines move closer to each other, this means that the actual moving averages are converging and that a market turn might be in the cards. On the other hand, when the MACD lines move apart form each other, this means that the actual moving averages are diverging and that the trend is getting stronger. In a way, MACD can also be treated as both a leading and lagging indicator.
Trading using the MACD can also make use of the crossover method. When the MACD lines cross, it indicates the start of a new trend. Waiting for a few histogram bars to grow larger can be a way of getting confirmation that the trend will be strong.
As with leading indicators, the parameters of lagging indicators can also be tweaked to suit the trader's style and preferences. Generally speaking, shorter periods tend to result in more trade signals but with the higher chance of getting false ones. Longer periods generate fewer trade signals, which means that one might miss out on a few good trade opportunities.
17 – Using Oscillators or Leading Indicators
When it comes to using leading indicators, a good way of remembering how they work is to understand that they "oscillate" between two points, hence the name oscillator. This means that they bounce back and forth from point A to point B, which is another way of saying that what goes around comes around.
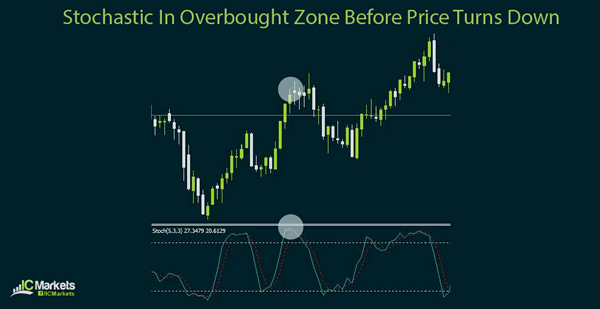
When an oscillator reaches the overbought zone or gives a sell signal, it eventually goes down along with price action. When an oscillator reaches the oversold zone or gives a buy signal, it then moves up along with price action.
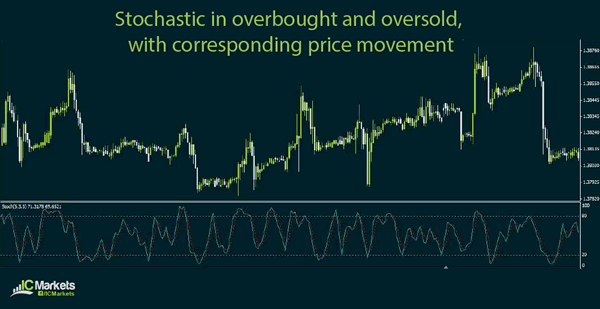
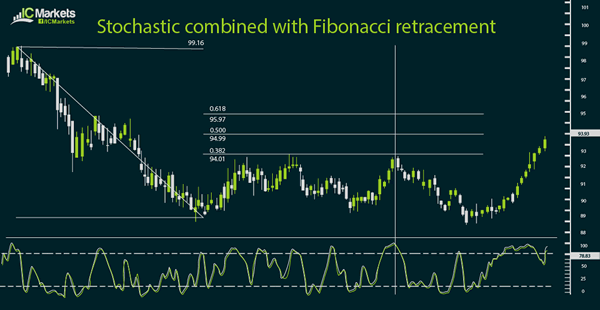
As you can see from the illustration, once stochastic hit the overbought zone above 80.00, price eventually went down along with the oscillator's movement. When stochastic reached the oversold area below 20.00, price eventually went up along with the oscillator's movement.
Of course the magnitude of the move still depends on a number of other technical and fundamental factors, and these are not necessarily indicated by the leading indicator's movement. In other words, the move up can be stronger than the move down or vice versa, depending on the market trend.
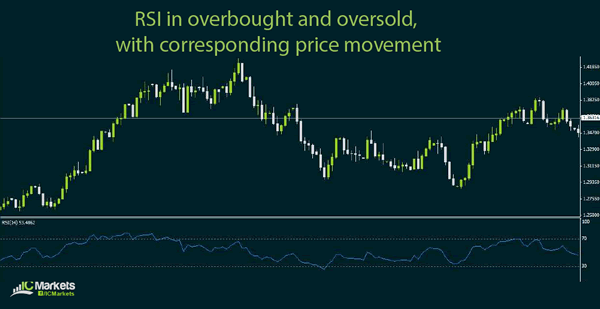
Another example of a leading indicator is the RSI or the relative strength index, which functions mostly like the stochastic. When RSI reaches the overbought area and gives a sell signal, price moves down. When RSI reaches the oversold area and gives a buy signal, price moves up.
The parabolic SAR (stop and reversal) is a special kind of leading indicator which also provides exit signals. Aside from that, this oscillator is usually applied as an overlay on price action to better allow the trader to visualize his entries and exits.
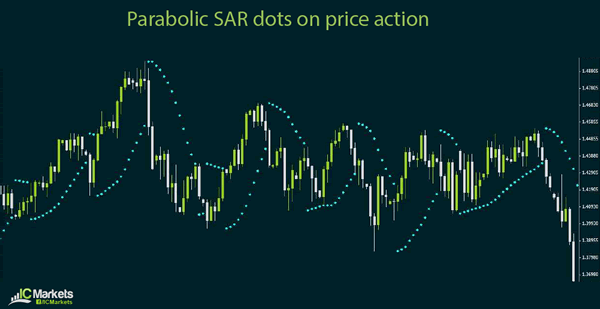
As you can see from the illustration, dots form above the price when a selloff is about to take place. On the other hand, dots form below the price when a rally is about to happen.
It may not be wise to jump in a long or short trade the moment a single dot appears below or above price action. One can wait for two or three dots to form before entering a position on the next candle then exiting when one or two dots form in the other direction.
Stochastic and RSI can also be used to identify trade exits by checking if the oscillator has reached the opposite end and is signaling a possible reversal. For stochastic, a crossover could signify a potential market turn. For RSI, a move below the middle 50.00 level could be an early sign that the trend is weakening.
Of course the parameters of these leading indicators can be tweaked to suit your trading style. More often than not, shorter-term parameters can generate more signals while longer-period ones give fewer signals. You can try different settings to filter out the false signals and to come up with a system that generates optimal results.
16 – Types of Technical Indicators
Technical indicators are grouped into two main classifications: oscillators or leading indicators and momentum or lagging indicators. Moving averages, as discussed in the previous section, typically fall under the category of lagging indicators but the parameters can be modified or shifted to allow it to act as a leading indicator.
As the name suggests, leading indicators give trade signals when the trend is just about to start. In other words, leading indicators give early trade signals.
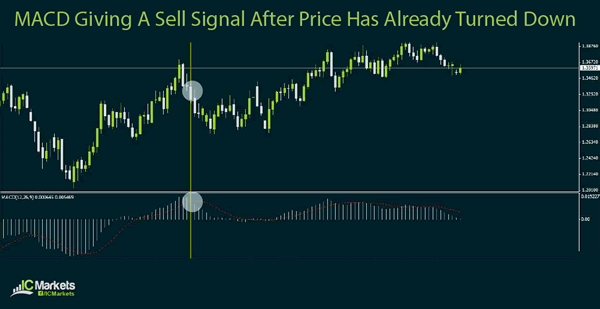
On the other hand, lagging indicators give trade signals when the trend is already taking place. This means that lagging indicators give confirmation trade signals.
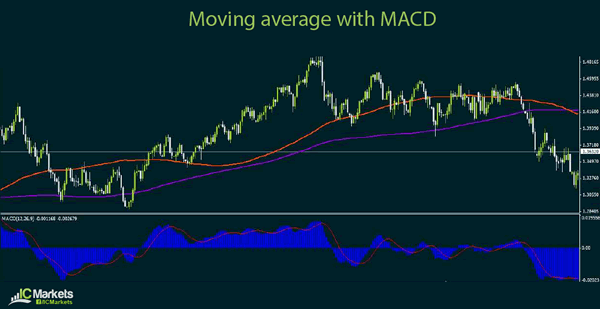
There is no right and wrong when picking whether to use a leading indicator or a lagging indicator. Some traders decide to use a combination of both, with the leading indicator serving as an alert for a new trend and the lagging indicator acting as confirmation for a trade entry.
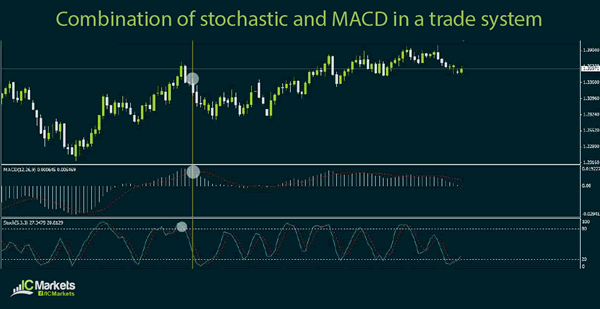
As you can see from the chart above, the stochastic hints that a new trend is about to take place while the MACD gives the go signal for the trader to enter a trade in the direction of the new trend.
Some argue that using only one or the other can give erroneous trade signals. After all, sticking with only a leading indicator can give false signals, telling the trader to enter a trade the moment a new trend seems to start. On the other hand, using only a lagging indicator can give late signals, with the trader not able to take advantage of the majority of the price movement or entering a trade when the trend is almost over.
At the end of the day, it is up to the trader to determine which technical indicators he is most comfortable with and which ones he thinks could yield the best returns. Trial and error is often key to figuring out which indicators and which parameters could lead to profitable results.
In the next sections, the different kinds of leading and lagging indicators will be discussed. Note that it is not important to memorize how the indicators are derived but that it is more crucial to have a clear understanding of how they work and how they can be applied to forex trading.
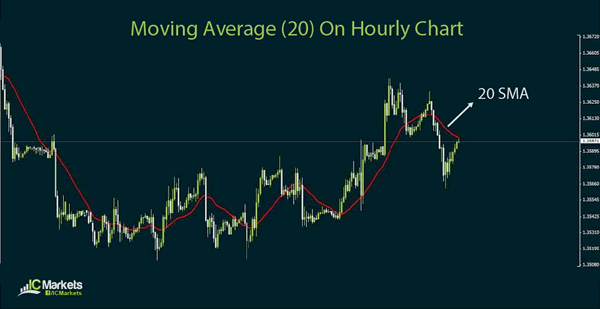
15 – How Moving Averages Work
This section covers the basic technical indicators used in forex trading, the most common of which is the moving average.
As the name suggests, this kind of technical indicator measures the average closing price of the currency pair for a specified period. For example, using the moving average (20) on an hourly chart takes the average of the closing price for the past 20 hours.
There are two main types of moving averages: simple and exponential. This has to do with the method in which the average is generated, with the simple moving average taking the sum of the closing prices then dividing by the number of time periods and the exponential moving average assigning weights to more recent time periods.
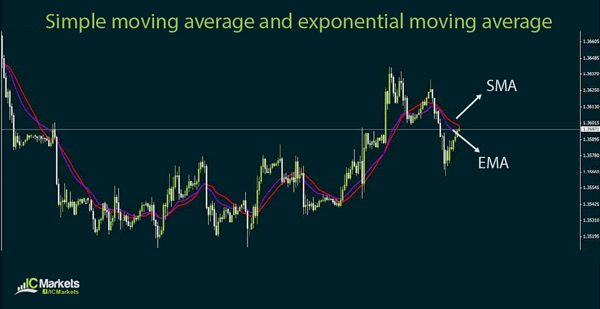
Either way, the goal in using moving averages in technical analysis is to smooth out price action and get a better idea of how future price movement will fare. Simple moving averages allow you to see a general idea of past price action while exponential moving averages incorporate the latest price volatility.
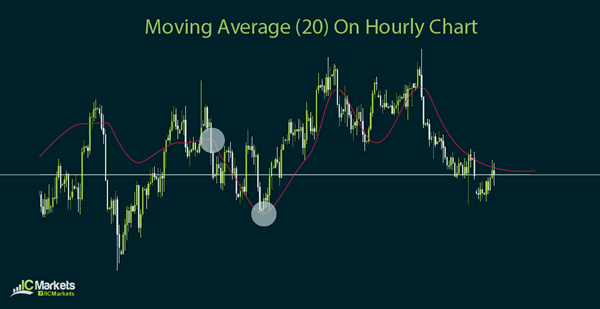
Moving averages can be used as a single indicator or as a group. As a single indicator, this is often used to generate buy or sell signals based on price crossovers. It can also be treated as a dynamic support or resistance level in a market trend.
Using multiple moving averages is also useful for crossover systems. For instance, a trading system can specify that buy signals would be generated when the moving averages are arranged from shortest-term to longest-term. A sell signal could be generated when the moving averages are arranged from longest-term to shortest-term from top to bottom.
Which kind of moving average should you use? This depends on the type of trading strategy you are planning on using. In particular, traders who are more aggressive with their entry orders and are inclined to enter trends as soon as they start may prefer a short-term exponential moving average since this is very sensitive to recent price action. The downside to this method though is that it can be prone to fake outs.
As for exits, moving averages can also give signals to close a trade when a new crossover has taken place. This is usually seen as a sign that a reversal is forming and that it may be time to book profits
14 – Using the Fibonacci Tool with Technical Indicators
The use of Fibonacci retracement and extension levels could also be combined with technical indicators. For instance, one can enter at market when stochastic has already made a turn from the overbought or oversold area and price is showing signs of bouncing off a Fibonacci level.
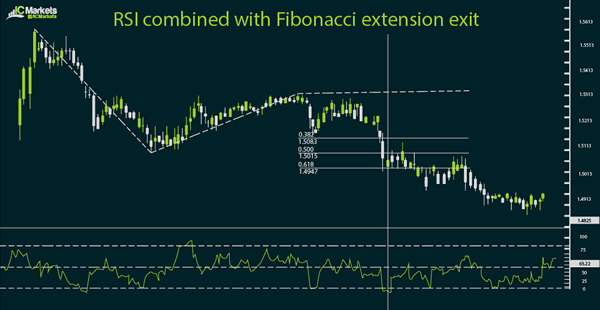
Similarly, one can decide to exit a trade at market when price is testing a Fibonacci extension level while RSI is moving out of the oversold or overbought area.
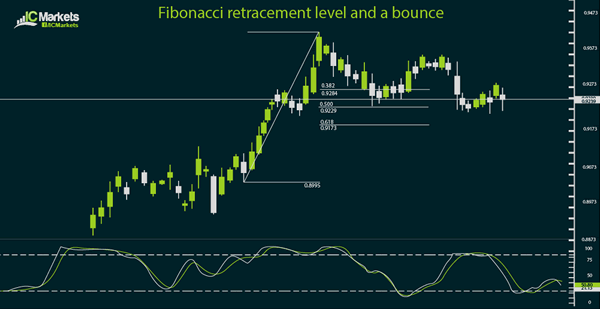
Another way to look for confirmation when using Fibonacci retracement and extension levels as entry and exit points would be to look at Japanese candlestick formations. As discussed in earlier sections, these tend to be reliable signals of a reversal in price action.
In particular, a doji forming right on a Fibonacci retracement level could be a sign that price is ready to turn. For additional confirmation, you can apply technical indicators such as stochastic or MACD to determine if it's a good time to enter a trade or not.
Take note though that using too many technical indicators doesn't necessarily improve their reliability. In fact, too much indicators might lead to an extremely cautious trading strategy that misses out on several valid trade signals.
Seasoned traders often say that the best trading systems are the simplest ones, and it can't get any simpler than watching basic candlestick patterns. It can be difficult to memorize the formations, particularly the group candlestick patterns, and those might be rare to spot. At the end of the day though, this is said to be one of the most reliable ways of spotting a possible reversal or trend continuation.
A spinning top on a Fibonacci retracement level could also serve as a sign of a market turn. Evening or morning stars could be signals that the Fibonacci retracement or extension level could hold as an inflection point.
Generally speaking, these candlestick patterns combined with Fibonacci levels tend to work better on longer-term time frames. However, there's no reason to not use these for scalping or shorter-term day trade setups. What's important is that you have a strong grasp of how these inflection points are used and what the candlestick patterns mean.
13 – Using the Fibonacci Tool with Trend Lines
As discussed in the previous sections, Fibonacci retracement is often used during trending market environments so it makes sense to combine it with the use of trend lines.
Of course this also requires one to be able to draw trend lines properly, and the rule of thumb is to use one that has already been tested at least thrice. This entry-setting method tends to be more reliable on longer-term time frames.
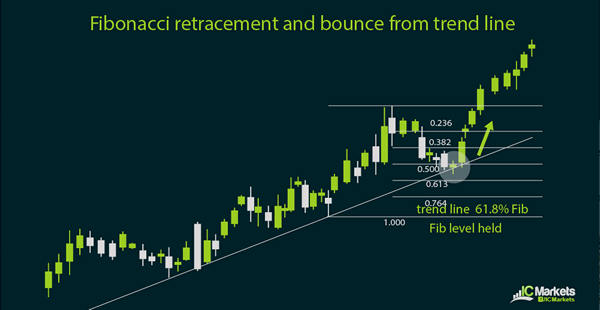
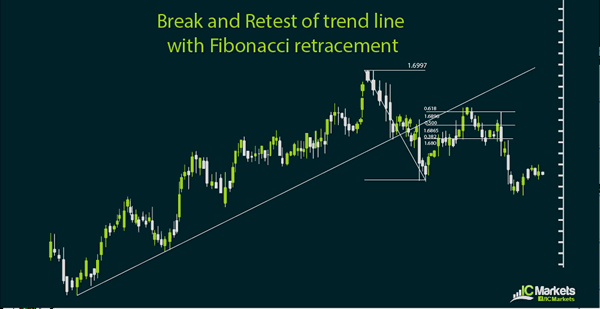
As with other types of support or resistance combined with Fibonacci retracement, there's always the chance that this method might fail. This could be indicative of a change in market bias or a shift in trend, signaling the start of a reversal.
In this case, traders who are able to be flexible enough to quickly shift biases could use the Fibonacci levels in the direction of the reversal to wait for a potential retest of the broken trend line.
Fibonacci extension levels can be used in setting profit targets as well, but some traders opt to close their trades or have a partial exit at the latest swing low or high. In a downtrend, price typically finds support at the latest swing low while the latest swing high usually acts as resistance in an uptrend.
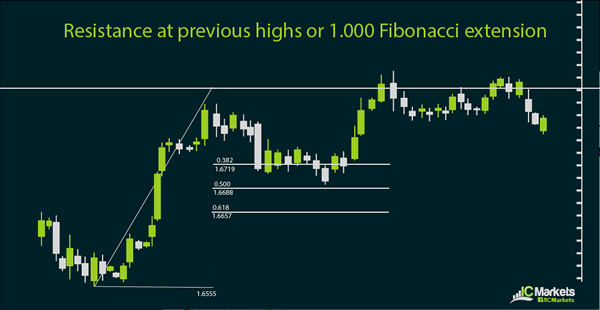
However in stronger trends, price tends to form new highs or lows. When price has already established which particular Fibonacci retracement level triggered a bounce, it could be easier to determine which extension levels could serve as exit points.
The selection of profit levels could vary depending on the aggressiveness of a trader. This could also depend on the reward-to-risk ratio that a trader is aiming for. Generally, trades that yield at least a 1:1 return on risk make for a good trade idea.
If the scaling-in method is a choice for entering trades, then the scaling-out method is an option for exiting trades. As mentioned earlier, one can book profits or exit part of the trade once price tests the previous swing high or low. The second or third profit level could be set at the next Fibonacci extension levels to press the advantage or catch more pips in case price makes new highs or lows.
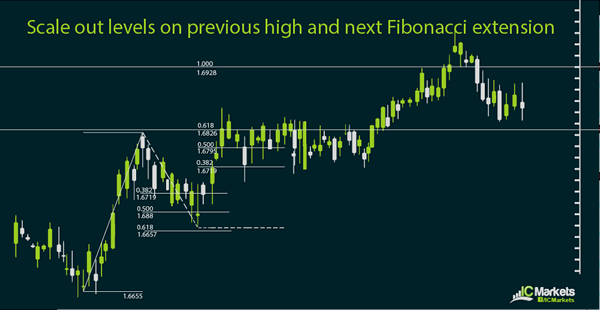
You can opt to close half your trade position on the previous high or low then adjust your stop loss to your entry level in the remaining open position in order to protect your recent profits. That way, you can wind up with a risk-free trade on the open position. This is one of the many ways you can reduce your exposure, particularly when there are top-tier events up for release or if you won't be able to watch your trades for a while.
12 – Using the Fibonacci Tool with Support and Resistance
This section further illustrates how the Fibonacci retracement and extension levels tend to have a higher probability of holding when they coincide with other types of support and resistance.
For instance, a price breakout tends to pull back to the broken support or resistance level as a retest. A downside break from a key support area, particularly in a longer-term time frame, tends to be followed by a retracement to that same level before price resumes its drop.
Similarly, an upside break from an established resistance area is usually followed by a pullback to that same level before price resumes its climb. Using the swing low to the swing high or the peak of the upside breakout should generate potential entry levels, and the one that is closest to the broken resistance area could have plenty of buy orders located.
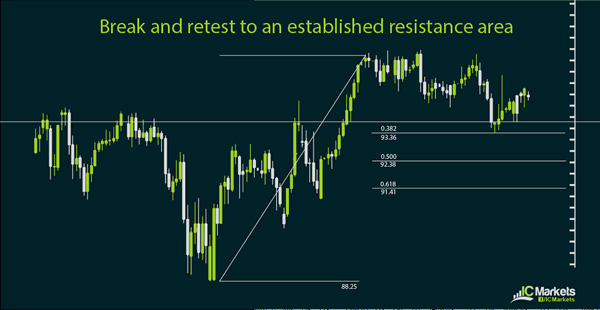
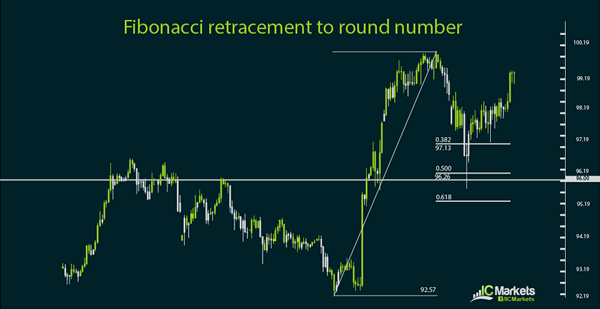
Another way to select which Fibonacci retracement level to place an order on is the one closest to a major or minor psychological level. Since these round numbers tend to be respected best by yen pairs, this method typically works on those.
The reason why this combination of Fibonacci levels with support or resistance works as an entry method is that plenty of traders already have their eyes locked on those levels. As such, they tend to have a self-fulfilling property in that the sheer number of buy or sell orders located in those levels are enough to make it hold and trigger a bounce.
The same principle applies for selecting profit targets with Fibonacci extension levels. Potential levels could be those located at established support or resistance levels, those nearby major or minor psychological levels, or pivot points.
In the event that you are having trouble choosing among the potential Fibonacci retracement levels to set your entry order on, you might want to consider the scaling in method. This involves setting several entry orders on multiple levels, with the trade entry price being the average of those levels.
Remember that it's not absolutely necessary to get the best possible entry price. What matters is that you did your homework, tried to come up with a high-probability setup, selected a potential entry point, and have a strategy to manage your risk properly.
Of course, nothing is set in stone in the forex market, and even the best technical analysis combining Fibonacci levels with support or resistance still has the chance of failing. This can happen when there is a sudden shift in market sentiment or an unforeseen event.
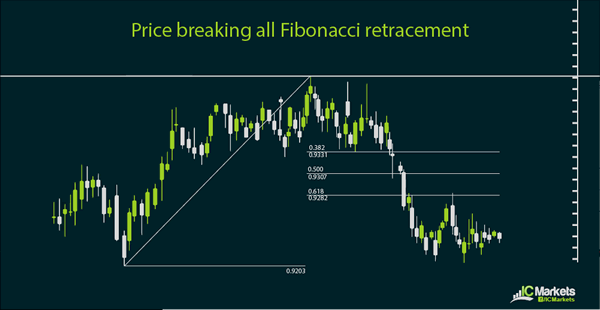
In this case, it could be a sign of a market turn and the start of a new trend. Before shifting sides, traders often zoom in to shorter-term time frames to see if there are opportunities to hop in smaller retracements.
Fibonacci retracement for intraday trading can also be used in conjunction with the previous day high, low, open, or close as these can also act as intraday inflection points.