
Sample Category Title
SPI200 Old Top Forms New Resistance
We had been looking to trade around this SPI200 top, that has since been chopped through.
What has caught my eye today however is the way that price has tucked back underneath the level as resistance once again. This has essentially reactivated the old level and even though it has been broken in between, becomes just as significant as if it was a cleanly tested level.
SPI 200 Daily:
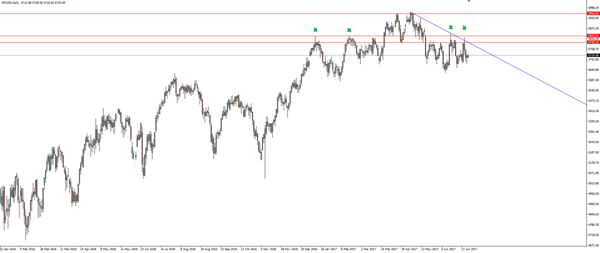
As you can see, price has once again held here at the green 'x', giving us an opportunity to try to build a short position. Zoom into the intraday charts and try to identify pullbacks into previous short term support that could be used as resistance. If that doesn't do it for you, then take a step back and I'm sure you can find a head and shoulders pattern of a four armed man.
USD: The Comeback Kid
The US came back from the dead as Tuesday's independence day celebrations came a day early for the US dollar bulls
After yesterday's innocuous Asia session the USD turned bid en masse as the Pound gave way on the weaker UK manufacturing PMI. The weaker print makes a case for the data not supporting the Bank of England hawkish tilt.
And USDJPY bounced after a stronger than expected Tankan survey attenuated any lingering fallout from the LDB trouncing in the July 2 Tokyo metropolitan assembly election.But it was the robust US ISM data which propelled USDJPY above the critical 113 level fueled by rising US Treasury yields all but supporting the current Fed narrative to look through the recent US economic soft patch
In US equity markets, the Dow posted a new record backed by energy stocks while the Nasdaq fell as sector rotation out of tech -stock lingers. The tech sector has reaped the benefits of the low-interest rate low volatility environment, and with the real prospects of rising US interest rates, tech investors are feeling the pain
On commodity markets, Oil prices had a buoyant overnight session as WTI prices didn't look back from the opening bell on US futures. Some dated headlines in circulation but I suspect the primary catalyst is the US rig count posted its first weekly fall since January fuelling speculation that the rigorous supply of oil from US shale oil producers is not sustainable below $45.00 per barrel
The lustre came off gold overnight in a big way on the stronger US dollar narrative driven by the expectancy of higher US interest rates.
However, the big story on currency markets remains the shifting central bank policy narrative. We've seen an aggressive pullback from last week's speculative bets fuelled by the hawkish chorus of central bankers. The USD recovered in part due to the ISM manufacturing report which surprised with the highest print since August 2014. But concerns that central banks may temper the hawkish lean for fear of creating unwanted volatility remain in the back of traders minds. Overnight the mystery sources from the ECB were back at it again hitting the airwaves stating ECB officials were “unnerved” by the market's reaction to Draghi's speech. I think it's safe to say the ECB members are scared of their hawkish shadow and may try to reel in the markets overzealous reaction to Draghi's Sintra comments. But headlines aside, the ECB has opened the door to tightening it's a matter of how wide they're willing to leave it ajar.
There will be no rest for the weary on the central bank narrative as the RBA, the Riksbank warrant considerable attention and are likely to keep traders hoping despite the US holiday-thinned trading conditions
Gold Slide Continues As US Manufacturing PMI Sparkles
Gold has started the week with considerable losses. Spot gold is trading at $1222.08 per ounce, down 1.56% on the day. On the release front, today’s key event is ISM Manufacturing PMI. The index climbed to 57.8 in June, beating the estimate of 55.0. On Tuesday, US markets are closed for the Fourth of July holiday.
Gold prices continue to sag, and the metal dropped to $1220 earlier in the day, its lowest level since May 11. Gold is down 4.4% since Thursday, when the metal appeared headed to break above the symbolic $1300 level. The week started with good news from the manufacturing sector, as ISM Manufacturing PMI improved to 57.8, its highest level since November 2014. Global economic conditions have improved, and a stronger demand for US exports has boosted the manufacturing sector.
The US economy did indeed slow down in the first quarter, but the downturn was not as bad as feared. On Thursday, revised GDP reading was raised to 1.4%, better than the initial estimate of 1.2% in May. The improvement was attributed to stronger consumer spending and an increase in exports. Earlier in the year, the markets were braced for a very poor quarter, with the first estimate in April projecting a gain of only 0.7%. Inflation remains stubbornly low, and consumer spending is also soft, despite high consumer confidence levels. In May, Personal Spending softened to 0.1%, down from 0.4% a month earlier. If inflation levels don’t show some improvement, the Federal Reserve may have second thoughts about a December rate hike.
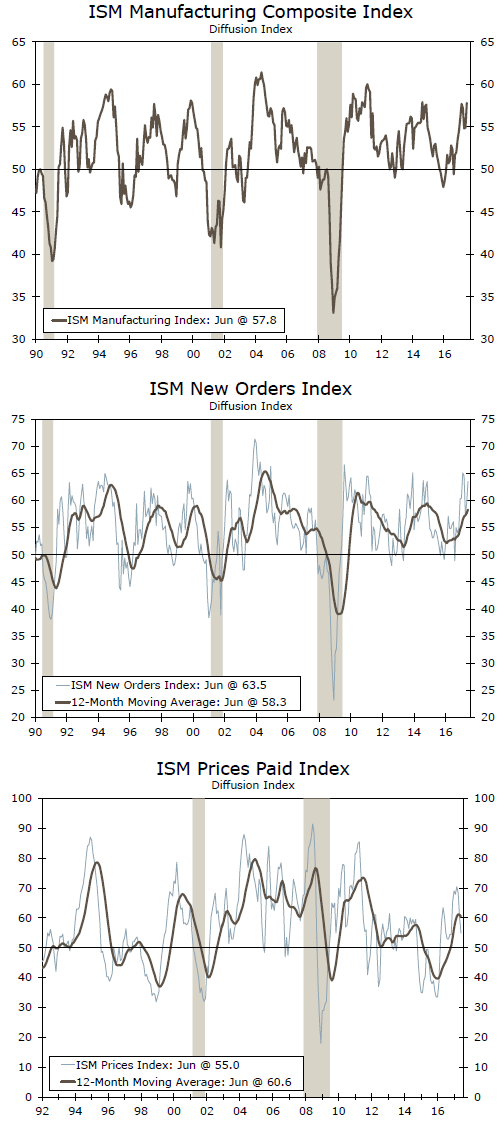
ISM Manufacturing Index Jumps to 3-Year High in June
Factories indicate that production was strong in June, and the orders pipeline suggests that production will remain solid in coming months. Cost pressures appear to have eased recently.
Subcomponents of Index Signal Strength in Coming Months
The ISM manufacturing index jumped from 54.9 in May to 57.8 in June (top chart). Not only was the headline index much stronger than expected - the consensus had centered on a reading of 55.3 - but the outturn marked the tenth consecutive month in which the index has been above the demarcation line separating expansion from contraction. It was also the highest reading in the index since August 2014.
Drilling down reveals broad based strength in the factory sector in the subcomponents that measure the current state of the sector. For starters, the production subcomponent rose to 62.4 from 57.1. Fourteen industries reported growth in production in June, while only two industries (apparel, leather & allied products and textile mills) indicated that production declined last month. In addition, the employment subcomponent of the overall index rose to a 3-month high of 57.2 in June. The outturns on these subcomponents mean that manufacturing production likely rebounded in June from the 0.4 percent monthly decline that it registered in May.
Moreover, the forward-looking indicators also were strong, suggesting that manufacturing production should continue to expand in coming months. The subcomponents measuring new orders rose from an already strong reading of 59.5 in May to 63.5 in June (middle chart). Foreign sources of demand contributed to the overall strength in orders as the new export orders subcomponent came in at 59.5 in June. Not only did factories report a strong stream of new orders, but their orders backlog is also quite robust. (The "backlog of orders" subcomponent increased from 55.0 in May to 57.0 in June.) The decline in the inventories subcomponent to 49.0 in June is also "good news" for production going forward. That is, factories may need to rebuild inventories in coming months.
Cost Pressures Appear to Have Eased
Rising commodity prices earlier this year had led to some cost pressures in the nation's factory sector. However, the "prices paid" subcomponent fell to a 7-month low of 55.0 in June (bottom chart) This drop in the index is consistent with recent behavior in many commodity prices, which have moved more or less sideways over the past few months. Petroleum prices moved significantly lower in June.
The only caveat we would note to the generally upbeat news from this morning's ISM report is that the index has tended to overstate strength in the factory sector in recent years. For example, manufacturing production was up 1.4 percent on a year-ago basis in May, a solid number to be sure but hardly a "boom." That said, the index generally does a good job of telegraphing the direction of change. Therefore, we would look for activity in the factory sector to pick up in coming months.
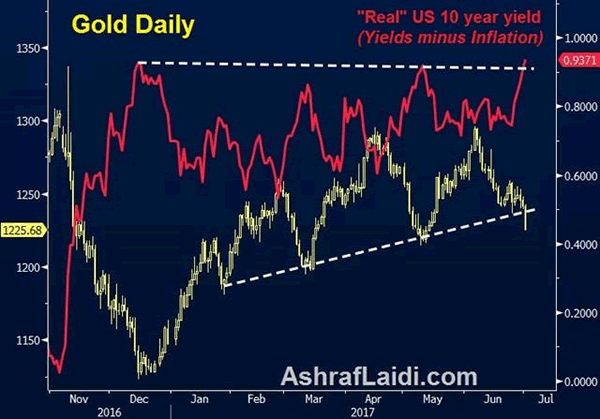
Metals Tumble as Real Yields Shoot
USD outperforms all currencies, while gold and silver were the biggest losers as real bond yields extended higher. US manufacturing ISM to 57.8, reaching its highest since August 2014 from 54.9 in May, with the new orders index hitting 3-month highs. Further accelerating the metals selloff is the decline in the prices paid index of the ISM, which fell to 8-month lows of 55. The 2nd listed trade in the Premium Insights is Ashraf's highest confidence trade in this enviromnment of rising REAL bond yields.
Seasonally, July is the start of a three-month period where bonds strongly outperform while in terms of FX, yen crosses tend to struggle. Over the past 10 years, July has been the worst month for USD/JPY with an average decline of 1.26%.
Finally, oil tends to struggle late in the year but over the past 20 years that weakness has progressively been creeping earlier in the year. July is a soft month over 10 and 30-year periods but it's been severe more recently. In the past three years the average decline has been a whopping 13.8%.
On the fundamental side, the global theme of a hawkish shift from central banks remains new and fresh. The June comments from the BOE, BOC, RBA and ECB were surprises and led to a welcome dose of volatility.
The reason that central banks create trends in the market is that they rarely change course once they commit, especially when global central banks all move in the same direction. What remains incredible is that the near-universal belief in central banks that inflation is going to pick up contrasts to a skeptical market. The hopes is that clear answers are coming in months ahead but the story is rarely that simple. Expect markets to ebb and flow aggressively on conflicting signals and data.Those types of aggressive moves are clear in the last few weeks of positioning data as traders piled into Canadian dollar shorts only to scramble out.
CFTC Commitments of Traders
Speculative net futures trader positions as of the close on Tuesday. Net short denoted by - long by +.
- EUR +59K vs +45K prior
- GBP -39K vs -38K prio
- JPY -61K vs -50K prior
- CHF -5K vs -3K prior
- CAD -49K vs -82K prior
- AUD +20K vs +15K prior
- NZD +25K vs +21K prior
Euro longs were +79K two weeks ago, then dropped to +45K and now have rebounded to +59K in a sign that the market is changing its mind on the fly.
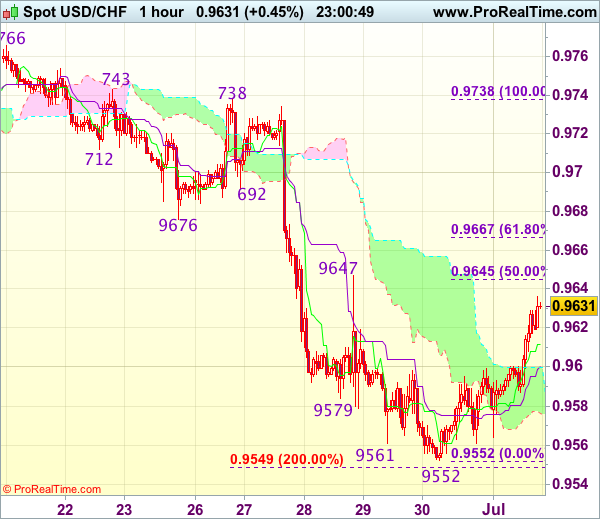
Trade Idea Wrap-up: USD/CHF – Buy at 0.9600
USD/CHF - 0.9633
Most recent candlesticks pattern : N/A
Trend : Near term down
Tenkan-Sen level : 0.9612
Kijun-Sen level : 0.9600
Ichimoku cloud top : 0.9600
Ichimoku cloud bottom : 0.9576
Original strategy :
Sell at 0.9645, Target: 0.9545, Stop: 0.9680
Position : -
Target : -
Stop : -
New strategy :
Buy at 0.9600, Target: 0.9700, Stop: 0.9565
Position : -
Target : -
Stop : -
As the greenback has continued moving higher after staging a strong rebound from 0.9552, suggesting a temporary low is possibly formed there and consolidation with upside bias is seen for further gain to 0.9645-47 (50% Fibonacci retracement of 0.9738-0.9552 and previous resistance), then 0.9676 (previous support turned resistance), however, break of latter level is needed to add credence to this view, bring further gain to 0.9700 but price should falter below resistance at 0.9738.
In view of this, we are looking to turn long on pullback as the Kijun-Sen (now at 0.9600) should limit downside and bring another rise later. Below the lower Kumo (now at 0.9576) would abort and signal intra-day top is formed, risk retest of 0.9552 first.
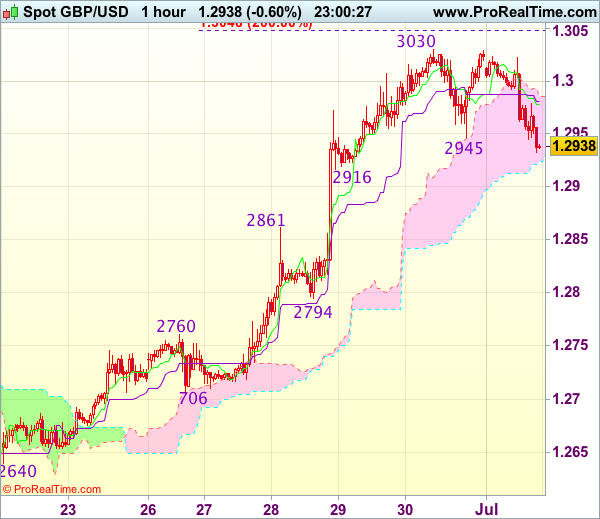
Trade Idea Wrap-up: GBP/USD – Buy at 1.2865
GBP/USD - 1.2941
Most recent candlesticks pattern : N/A
Trend : Near term up
Tenkan-Sen level : 1.2978
Kijun-Sen level : 1.2981
Ichimoku cloud top : 1.2985
Ichimoku cloud bottom : 1.2923
Original strategy :
Buy at 1.2900, Target: 1.3020, Stop: 1.2865
Position : -
Target : -
Stop : -
New strategy :
Buy at 1.2865, Target: 1.3000, Stop: 1.2830
Position : -
Target : -
Stop : -
As cable has retreated after faltering below last week’s high of 1.3030, suggesting consolidation below this level would be seen, hence weakness to 1.2916 support cannot be ruled out, however, reckon downside would be limited to 1.2865-70 and bring another upmove later, above said resistance at 1.3030 would signal recent upmove is still in progress and may extend further gain towards recent high 1.3048 but loss of near term upward momentum should prevent sharp move beyond 1.3075-80 today and reckon 1.3100 would hold on first testing.
In view of this, would not chase this rise here and we are looking to buy cable again on pullback as 1.2900 should limit downside and bring another rally. Below previous resistance at 1.2861 would suggest a temporary top is formed instead, risk weakness to 1.2830-35 but support at 1.2794 should remain intact.
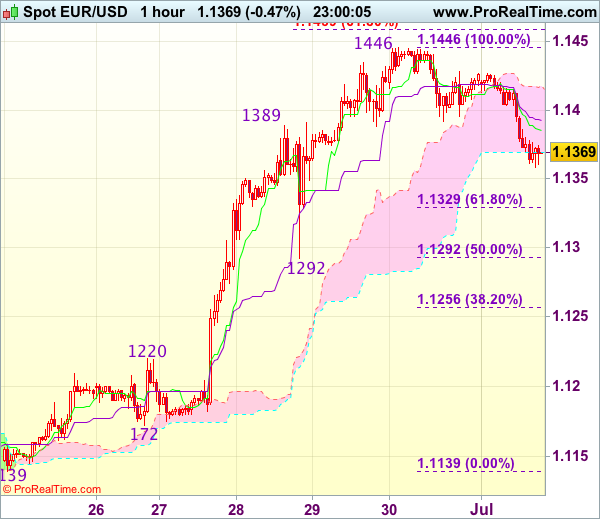
Trade Idea Wrap-up: EUR/USD – Buy at 1.1325
EUR/USD - 1.1368
Most recent candlesticks pattern : N/A
Trend : Near term up
Tenkan-Sen level : 1.1385
Kijun-Sen level : 1.1393
Ichimoku cloud top : 1.1418
Ichimoku cloud bottom : 1.1369
Original strategy :
Buy at 1.1330, Target: 1.1440, Stop: 1.1295
Position : -
Target : -
Stop : -
New strategy :
Buy at 1.1325, Target: 1.1440, Stop: 1.1290
Position : -
Target : -
Stop : -
As the single currency met resistance at 1.1446 late last week and has retreated, suggesting consolidation below this level would be seen and pullback to 1.1350 cannot be ruled out, however, reckon 1.1325-30 (38.2% Fibonacci retracement of 1.1139-1.1446) would limit downside and bring another rise later, above said resistance at 1.1446 would extend recent rise to 1.1455-60 (61.8% projection of 1.1119-1.1389 measuring from 1.1292), then 1.1480 but overbought condition should prevent sharp move beyond 1.1500, risk from there has increased for a retreat later.
In view of this, would not chase this rise here and would be prudent to buy euro on pullback as 1.1325-30 should limit upside. Below 1.1292 (previous support as well as 50% Fibonacci retracement of 1.1139-1.1446) would abort and signal a temporary top is formed, bring correction to 1.1255-60 later.
Trade Idea Wrap-up: USD/JPY – Stand aside
USD/JPY - 113.30
Most recent candlesticks pattern : N/A
Trend : Near term up
Tenkan-Sen level : 112.92
Kijun-Sen level : 112.63
Ichimoku cloud top : 112.33
Ichimoku cloud bottom : 112.21
New strategy :
Stand aside
Position : -
Target : -
Stop : -
As the greenback has surged again after finding renewed buying interest just below 112.00, dampening our near term bearishness and near term upside risk remains for recent upmove to extend gain to 113.45-50, however, near term overbought condition should prevent sharp move beyond 113.75-80 and reckon 114.00-10 would hold from here, bring retreat later.
In view of this, would not chase this rise here and would be prudent to stand aside for now. Below the Kijun-Sen (now at 112.64) would bring test of the lower Kumo (now at 112.21) but break of 111.90-95 is needed to signal an intra-day top is formed, bring test of 111.73 support first.

US Dollar Recovers ahead of July 4th Holiday; Global Manufacturing PMIs Paint Upbeat Picture
The dollar managed to regain a part of its recent losses today, as Purchasing Managers' Indices from around the world painted an upbeat picture of the global economy.
As the dollar strengthened, particularly noteworthy was its break above 113 versus the yen; a 1 ½ – month high for the greenback. The yen was also near its 1 ½ -year low against the euro as it traded around 128.40. In Japan, signs of optimism from large manufacturers and services' companies in the quarterly Tankan survey were countered by news that the Prime Minister's party lost the elections for the Tokyo regional assembly.
Euro/dollar backed down below the 1.14 mark to trade at 1.1360, despite a slightly better-than-expected June Manufacturing Final PMI reading for the Eurozone. The index came in at 57.4 compared to 57.3 which was the preliminary estimate. The reading marked a 6-year high for Eurozone manufacturing activity and this bodes well for the region's economic expansion going forward. However, the region's unemployment rate did not fall to 9.2% in May as expected but remained constant at 9.3%.
There were disappointing news out of UK factories as the Markit/CIPS manufacturing index dropped to 54.3 in June from May's 56.7. Analysts were expecting a more modest drop to 56.3. The pound fell once again below the 1.30 level against the US dollar to as low as 1.2941, but its losses were relatively in line with those of the euro against the greenback. The pound has been boosted lately by speculation that the Bank of England will raise interest rates in the coming months, as the Bank's governor, Mark Carney, has hinted he might join the hawks if conditions warrant it. A speech by Carney today did not address the topic of monetary policy.
In US data, the ISM Manufacturing PMI for July climbed to 57.8 from 54.9 the previous month. Analysts were expecting a rise to 55.2. The upside surprise occurred despite a sharp drop in the prices paid component to 55 from 60.5 the previous month. Both the 10-year Treasury yield and dollar/yen rose sharply following the ISM announcement.
In the commodities space, crude oil continued to rally and the US-traded WTI oil futures contract reached $46.50 a barrel. On the other hand, gold remained under pressure and made fresh 1 ½ month low at $1224 an ounce.
Looking ahead, an early close of US financial markets ahead of the July 4th holiday should also lead to diminished trading for forex markets. June US vehicle sales will come out later today. During Tuesday's Asian session, the policy statement from the Reserve Bank of Australia will likely dominate the news, while traders will also be looking at Australian retail sales for May.