
Sample Category Title
Elliott Wave View: DAX Rally Expected
Short term DAX Elliott Wave view suggests the rally from 5/18 is unfolding as a double three Elliott Wave structure. Minute wave ((w)) ended at 12879.5 and Minute wave ((x)) pullback ended at 12617. Internal of Minute wave ((x)) subdivided as an expanded flat Elliott Wave structure where Minutte wave (a) ended at 12633.5, Minutte wave (b) ended at 12922.5 and Minutte wave (c) of ((x)) ended at 12617. DAX has broken above Minutte wave (b) on 6/14, adding conviction that the next leg higher has started. Up from 12617, the rally is unfolding as a zigzag Elliott Wave structure where Minutte wave (a) ended at 12948.5 and Minutte wave (b) is proposed complete at 12701.5. Near term, while pullbacks stay above 12701.5, and more importantly above 12617, expect Index to extend higher. We do not like selling the Index.
DAX 1 Hour Elliott Wave Chart
Daily Technical Analysis: EUR/USD Bounces At Mulitple Fibonacci Levels Of Wave 2 Pullback
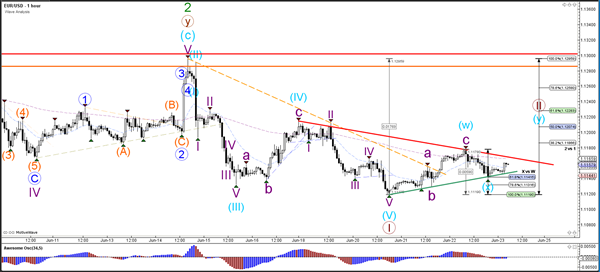
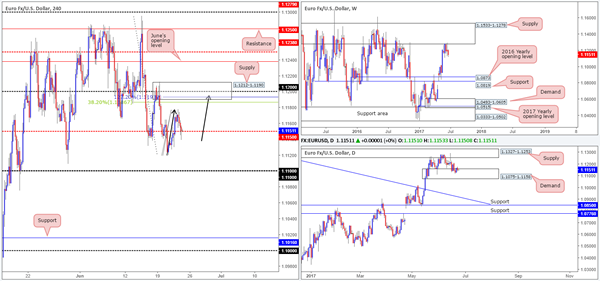
Currency pair EUR/USD
The EUR/USD is probably building a break, retracement, and continuation, which is why waves 1 and 2 (brown) are indicated on the chart. Price will need to break below the bottom at 1.11 before a potential wave 3 becomes likely.
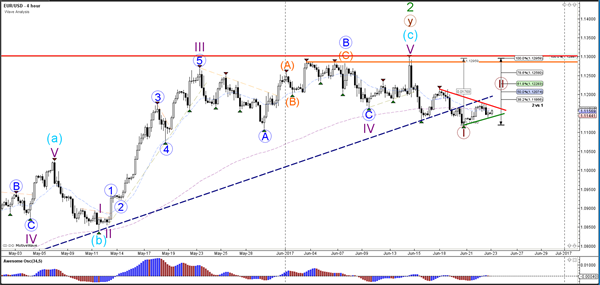
The EUR/USD stopped at the 61.8% Fibonacci level of wave X (blue). A break below support (green) could indicate a continuation of the bearish trend. Price invalidates wave 2 (brown) if price manages to break above the 100% Fibonacci level but the other Fibonacci levels could act as resistance - similar to how price bounced at the 38.2% of wave 2 (brown).
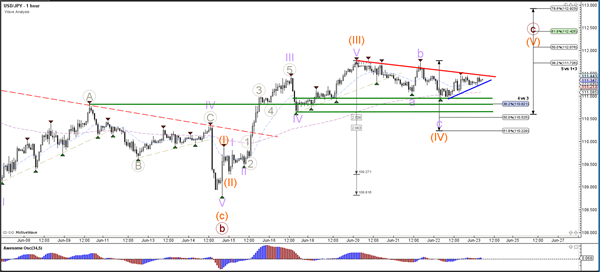
Currency pair USD/JPY
The USD/JPY seems to be building a retracement after the bullish breakout above resistance (dotted red). The pullback is probably a wave 4 (orange) which could find support (green lines) at the previous bottom and tops.
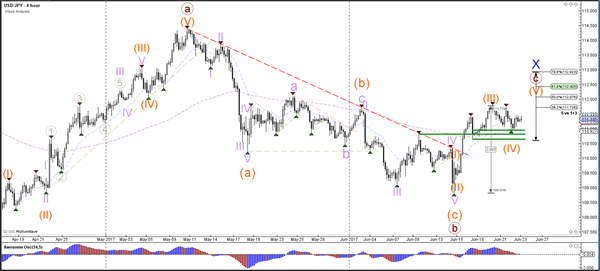
The USD/JPY needs to break above resistance (red) before the wave 5 (orange) could start. A break below the 61.8% Fib of wave 4 vs 3 makes a wave 4 (orange) unlikely.
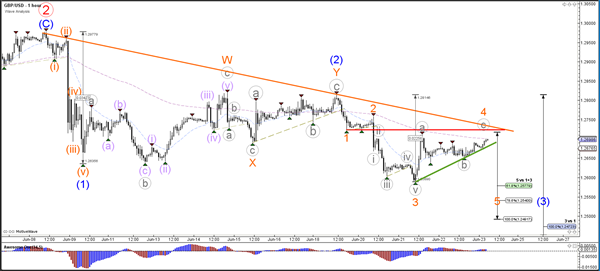
Currency pair GBP/USD
The GBP/USD is challenging resistance lines (red/orange) and a break above these levels would invalidate (part of) the current wave structure.
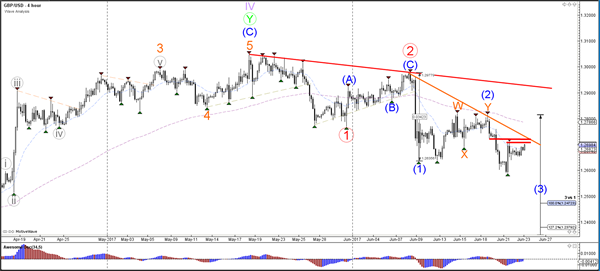
The GBP/USD is in a potential wave 4 (orange) but this wave is invalidated if price manages to break above the bottom of wave 1 (red). A break below support (green) could see the continuation of wave 3 (blue).
European Open Briefing: Markets Remained Quiet Overnight Amid A Lack Of Events
Global Markets:
- Asian stock markets: Nikkei up 0.15 %, Shanghai Composite fell 0.75 %, Hang Seng rose 0.05 %, ASX 200 unchanged
- Commodities: Gold at $1253 (+0.50 %), Silver at $16.60 (+0.55 %), WTI Oil at $42.90 (+0.40 %), Brent Oil at $45.40 (+0.40 %)
- Rates: US 10-year yield at 2.16, UK 10-year yield at 1.02, German 10-year yield at 0.26
News & Data
- Japan Manufacturing PMI 52.0 vs 53.4 expected – RTRS
- PBoC Fixes USDCNY Reference Rate At 6.8238 (prev fix 6.8197 prev close 6.8368)
- Asian shares flat, still on track for winning week – RTRS
- Dollar sluggish but firm, oil bounce helps commodity currencies – RTRS
- Oil edges up, but set for worst first-half performance in 20 years – RTRS
Markets Update:
Markets remained quiet overnight amid a lack of events. Most major Asian indices are unchanged on the day. Oil prices bounced slightly after briefly trading below $42 yesterday. The outlook remains negative, but support at $42 has proven to be relatively strong. WTI might see a bounce here before the downtrend continues.
The US Dollar came slightly under pressure in Asia. EUR/USD rose to 1.1165, while GBP/USD managed to return above 1.27. While the Euro rally may continue, the outlook for GBP is negative amid the political situation in the UK and uncertainty about the upcoming Brexit negotiations. Resistance is noted at 1.2720 and ahead of 1.28.
The Australian Dollar remains resilient, although it lacks momentum. Strong support is seen at 0.7520, while resistance lies at 0.76 and 0.7630. A clear break above 0.7630 is needed to confirm that the AUD rally will continue.
Upcoming Events:
- 08:00 BST – French Manufacturing PMI
- 08:00 BST – French Services PMI
- 08:30 BST – German Manufacturing PMI
- 08:30 BST – German Services PMI
- 09:00 BST – Euro Zone Manufacturing PMI
- 09:00 BST – Euro Zone Services PMI
- 13:30 BST – Canadian CPI
- 13:30 BST – Canadian Core CPI
- 14:45 BST – US Services PMI
- 14:45 BST – US Manufacturing PMI
- 15:00 BST – US New Home Sales
Daily Technical Outlook And Review: EUR/USD, GBP/USD, AUD/USD, USD/JPY, USD/CAD, USD/CHF, DOW 30, GOLD
A note on lower timeframe confirming price action...
Waiting for lower timeframe confirmation is our main tool to confirm strength within higher timeframe zones, and has really been the key to our trading success. It takes a little time to understand the subtle nuances, however, as each trade is never the same, but once you master the rhythm so to speak, you will be saved from countless unnecessary losing trades. The following is a list of what we look for:
- A break/retest of supply or demand dependent on which way you're trading.
- A trendline break/retest.
- Buying/selling tails ... essentially we look for a cluster of very obvious spikes off of lower timeframe support and resistance levels within the higher timeframe zone.
- Candlestick patterns. We tend to only stick with pin bars and engulfing bars as these have proven to be the most effective.
We typically search for lower-timeframe confirmation between the M15 and H1 timeframes, since most of our higher-timeframe areas begin with the H4. Stops are usually placed 1-3 pips beyond confirming structures.
EUR/USD
For the most part it was a relatively quiet session on Thursday. The H4 candles failed to sustain gains beyond the 1.1170 mark, and concluded the day printing a bullish buying tail off the mid-level support at 1.1150. According to the daily timeframe, which happens to be trading within the walls of a demand area coming in at 1.1075-1.1158, 1.1150 may well hold as support today and force the unit to challenge the 1.12 neighborhood.
Should our analysis be correct, and price does indeed rally to connect with 1.12, our team would be interested in shorting from this region. 1.12 is encapsulated by a H4 supply noted at 1.1212-1.1190, as well as being positioned a few pips above a H4 AB=CD 127.2% ext. at 1.1193 taken from the low 1.1119 and is also located nearby a H4 38.2% Fib resistance planted at 1.1186 extended from the high 1.1295. In addition to this, we also see weekly sellers continue to reflect a strong bearish stance from the underside of a major weekly supply at 1.1533-1.1278.
Our suggestions: The question is, would we be comfortable selling knowing that price is coming from daily demand? For us personally, we’d need to see additional confirmation present itself. A reasonably sized H4 bearish candle, preferably a full-bodied candle, would be ideal. The first take-profit target from here would be the 1.1150 line.
Data points to consider: Eurozone manufacturing between 8-9am. US New home sales at 3pm, followed by FOMC member Powell speaking at 7.15pm GMT+1.
Levels to watch/live orders:
- Buys: Flat (stop loss: N/A).
- Sells: 1.12 region ([waiting for a reasonably sized H4 bear candle – preferably a full-bodied candle – to form before pulling the trigger is advised] stop loss: ideally beyond the candle’s wick).
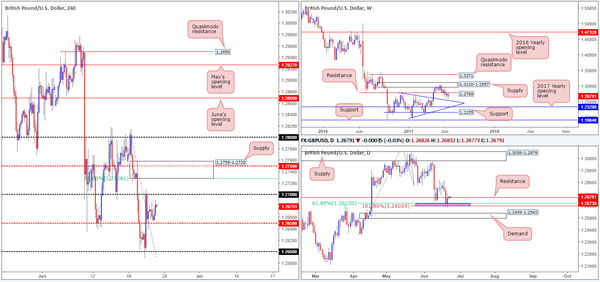
GBP/USD
In a similar fashion to the EUR/USD, the GBP/USD was also relatively subdued on Thursday, ranging all of 37 pips on the day. Daily action, as you can see, remains teasing the resistance level pegged at 1.2673. Weekly price on the other hand, still shows room to extend down to a trendline support taken from the high 1.2774 that happens to intersect with a daily demand seen below the two daily Fib levels (area marked in pink at 1.2602/1.2625) at 1.2499-1.2543.
Our suggestions: Consequent to yesterday’s lackluster performance, our outlook remains unchanged:
While a great deal of traders will be eyeing the 1.27 handle for shorts today, we’re looking at the H4 supply seen above at 1.2758-1.2728. Not only does it hold a H4 mid-level resistance level at 1.2750, it also boasts a 61.8% H4 Fib resistance at 1.2728 taken from the high 1.2814. Furthermore, the stops planted above 1.27 will help provide the big boys liquidity to sell into! An ideal setup would be for a H4 selling wick to pierce through 1.27 (taking out the stops), attack the underside of the said H4 supply and then close back below 1.27. This would, for us, permit a short entry, targeting 1.2650 as an initial take-profit level.
Data points to consider: US New home sales at 3pm, followed by FOMC member Powell speaking at 7.15pm GMT+1.
Levels to watch/live orders:
- Buys: Flat (stop loss: N/A).
- Sells: 1.2758-1.2728 ([waiting for a reasonably sized H4 bear candle – preferably a full-bodied candle – to form before pulling the trigger is advised] stop loss: ideally beyond the candle’s wick).
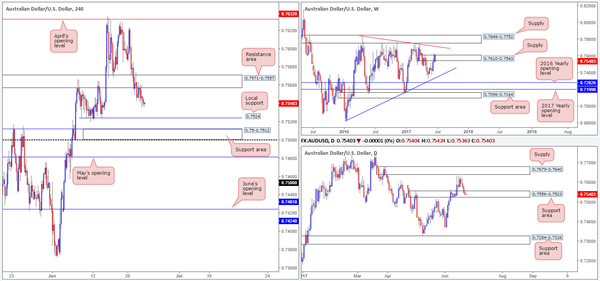
AUD/USD
AUD/USD bears, as you can see, continued to press lower in recent trading, consequently recording a fourth consecutive daily bearish candle. The upshot to this was the H4 resistance area at 0.7571-0.7557 was confirmed as a valid zone, the weekly supply at 0.7610-0.7543 was very likely victim of a fakeout last week and the current daily support area at 0.7556-0.7523 may give way in today’s segment.
Although the above signals shorts may be the best bet, we are not comfortable with the current daily support area! What’s more, there’s not a great deal of room for the H4 candles to trade lower given the next hurdle below sits at 0.7524: a local H4 support, shadowed closely by a H4 support area at 0.75-0.7512.
Our suggestions: Right now, our desk does not see a lot to hang our hat on at the moment. As such, remaining flat until more conducive price action presents itself is the route we’ve chosen to take.
Data points to consider: US New home sales at 3pm, followed by FOMC member Powell speaking at 7.15pm GMT+1.
Levels to watch/live orders:
- Buys: Flat (stop loss: N/A).
- Sells: Flat (stop loss: N/A).
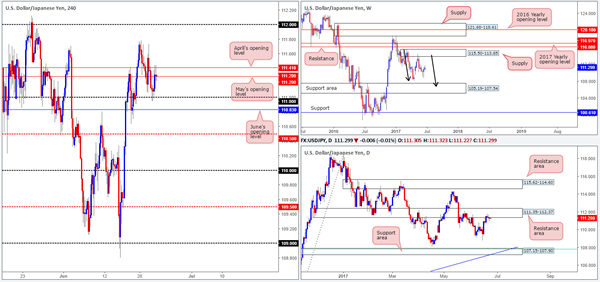
USD/JPY
The USD/JPY ran into a strong pocket of bids around the 111 handle amid Thursday’s sessions, resulting in the unit gravitating up to April/May’s opening levels at 111.41/111.29, which for now is holding firm. Technically speaking, a decisive close above these monthly levels is unlikely. Our reasoning lies within the higher-timeframe structure. On the weekly timeframe, we still feel that bears remain in a relatively strong position after pushing aggressively lower from supply registered at 115.50-113.85. We know there’s a lot of ground to cover here, but this move could possibly result in further downside taking shape in the form of a weekly AB=CD correction (see black arrows) that terminates within a weekly support area marked at 105.19-107.54 (stretches all the way back to early 2014). Additionally, daily flow remains trading around the underside of a resistance area at 111.35-112.37.
Our suggestions: Does the above justify a short position from 111.41/111.29? Not necessarily. Generally, we like to see space for price to stretch its legs when we enter into a trade. In this scenario, the nearby 111 handle, followed closely by June’s opening level at 110.83 could throw a spanner in the works and halt selling, potentially placing one in drawdown. Without clear room to run, we’re going to pass on shorting 111.41/111.29 today.
Data points to consider: US New home sales at 3pm, followed by FOMC member Powell speaking at 7.15pm GMT+1.
Levels to watch/live orders:
- Buys: Flat (stop loss: N/A).
- Sells: Flat (stop loss: N/A).
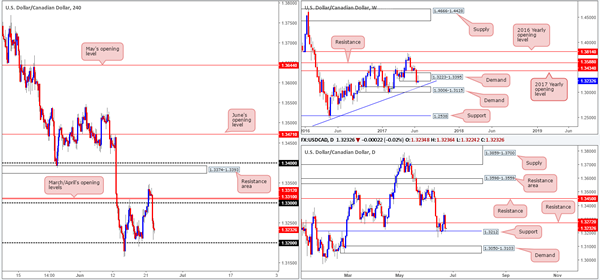
USD/CAD
Kicking this morning’s analysis off with a look at the weekly timeframe, we can see that demand at 1.3223-1.3395 is holding on by a thin thread at the moment. In the event that the bears remain dominant here, odds are that the demand base pegged below at 1.3006-1.3115, which happens to intersect with a trendline support extended from the high 1.1278, will see some action. The story on the daily chart, however, continues to be bolstered by a support level penciled in at 1.3212. A decisive push below this line could lead to a move being seen down to demand at 1.3050-1.3103 (housed within the weekly demand mentioned above at 1.3006-1.3115).
Earlier in the week, the 1.32 boundary seen on the H4 chart was a prime location to hunt for long opportunities. However, we do not believe this to be the case right now. Buyers situated at the current daily support are likely weakened, and on top of this, we have a very fragile-looking weekly demand in play at the moment (see above).
Our suggestions: With the above notes in mind, our desk will be watching for H4 price to close below 1.32 today. This – coupled with a retest and a reasonably sized H4 bearish candle would, in our opinion, be enough to consider selling this pair, targeting the top edge of the weekly demand at 1.3115.
Data points to consider: US New home sales at 3pm, followed by FOMC member Powell speaking at 7.15pm. Canadian inflation figures at 1.30pm GMT+1.
Levels to watch/live orders:
- Buys: Flat (Stop loss: N/A).
- Sells: Watch for H4 price to engulf 1.32 and then look to trade any retest seen thereafter ([waiting for a reasonably sized H4 bear candle to form following the retest is advised] stop loss: ideally beyond the candle’s wick).
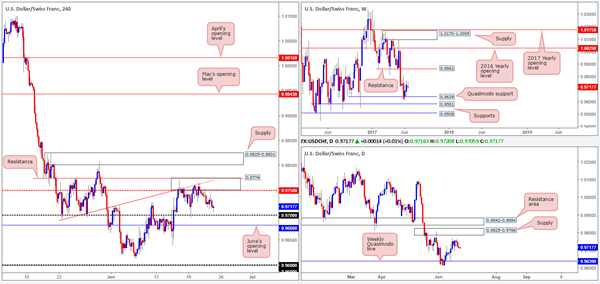
USD/CHF
Since the 15th June, the H4 candles have been consolidating between the 0.97 handle and the 0.9774/0.9750 area (comprised of a H4 resistance level at 0.9774, a H4 trendline resistance etched from the low 0.9691 and a H4 mid-level resistance drawn from 0.9750). Over on the daily chart, price is currently trading between a weekly Quasimodo support level at 0.9639 and a daily supply base coming in at 0.9825-0.9786.
Our suggestions: Unless you fancy trying your luck at trading the current H4 range edges today, which holds absolutely no connection to the higher timeframes, we believe it may be best to remain flat today. Typically, our team requires two things to trade: H4 confluence and higher-timeframe convergence. Without both, we rarely execute a trade.
Data points to consider: US New home sales at 3pm, followed by FOMC member Powell speaking at 7.15pm GMT+1
Levels to watch/live orders:
- Buys: Flat (stop loss: N/A).
- Sells: Flat (stop loss: N/A).
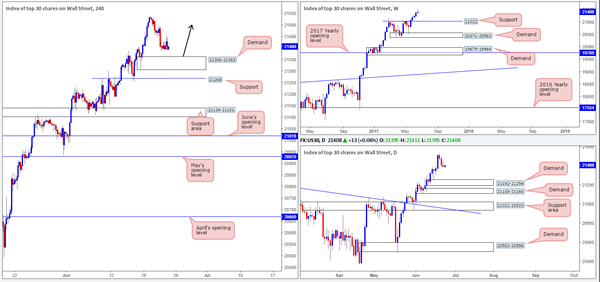
DOW 30
US equities saw little change during yesterday’s trading, as the unit remains hovering just ahead of a H4 demand drawn from 21306-21363. For those who follow our analysis on a regular basis, you may recall that our desk is currently long from 21164. 50% of that position was quickly liquidated at 21234, with the remaining 50% left in the market to run since we intend on trailing this trend long term. The stop-loss order is currently positioned below the said H4 demand at 21298, as we believe this to be the safest area for the time being.
Our suggestions: Should price challenge 21306-21363 today, and is reinforced by a full or near-full-bodied bullish candle, we may look to add to our current position (as per the black arrows) and trail accordingly.
Data points to consider: US New home sales at 3pm, followed by FOMC member Powell speaking at 7.15pm GMT+1.
Levels to watch/live orders:
- Buys: 21164 ([live] stop loss: 21298). 21306-21363 ([waiting for a reasonably sized H4 bull candle – preferably a full-bodied candle – to form before pulling the trigger is advised] stop loss: ideally beyond the candle’s tail).
- Sells: Flat (stop loss: N/A).
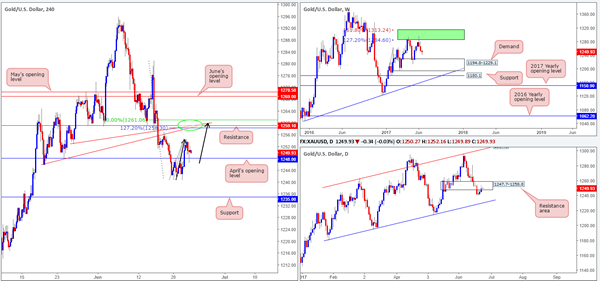
GOLD
Similar to the EUR/USD, a market that tends to correlate well with the price of gold, the yellow metal shows a possible H4 AB=CD bearish correction at hand. The bounce from April’s opening level at 1248.0 formed a potential C-leg, and could lead to price rallying today and touching gloves with the H4 AB=CD 127.2% ext. point at 1258.3. Not only do we have this, but we also have a nearby merging H4 resistance at 1259.1, two H4 trendline resistances taken from lows of 1245.9/1252.9 and a H4 50.0% retracement value at 1261.0.
Also noteworthy is that this H4 resistance level at 1259.1 is planted just above a daily resistance area pegged at 1247.7-1258.8. And alongside this, we also see that weekly price shows room to extend down to demand at 1194.8-1229.1.
Our suggestions: The confluence surrounding the H4 resistance mentioned above at 1259.1 is, we believe, enough to justify a short position. With that being said, however, we would only consider this a valid sell zone if, and only if, a reasonably sized H4 bearish candle took shape from here. This will help avoid an unnecessary loss and also help sidestep any fakeout that may be seen given that the sell zone (1261.0/1258.3) is relatively small.
Levels to watch/live orders:
- Buys: Flat (stop loss: N/A).
- Sells: 1259.1 region ([waiting for a reasonably sized H4 bear candle – preferably a full-bodied candle – to form before pulling the trigger is advised] stop loss: ideally beyond the candle’s wick).
Market Morning Briefing: A Quiet Day For All The Majors
STOCKS
Dow (21397.29, -0.06%) is in a downward corrective phase and could move down towards 21300-21240 in the near term. Trend looks bearish for the coming week.
Dax (12794.00, +0.15%) is holding well above 12700 support levels and while that holds, we may look for an immediate rise towards 12900 which would not be negated unless we see a break below 12700 just now.
Shanghai (3148.16, +0.03%) is trading within the broad 3120-3200 channel and could move up towards 3180 in the coming sessions. Immediate resistance is visible near 3200 which if holds, could push off the index back to 3120 again next week. We need to see a confirmed break on either side to get some more clarity on the near term movement within an overall longetrm uptrend.
Nikkei (20107.76, -0.01%) is stable and in a consolidation mode which could possibly extend towards 20000 on the downside. Thereafter a rise back to levels near 20200-20300 is possible over the next week.
Nifty (9630.00, -0.04%) came off sharply after testing 9700 yesterday but while above 9600, there is scope of re-testing 9700 and breaking above in the near term, rallying towards 9800 over the next couple of weeks. The 9600-9700 region could possibly hold for another 4-5 sessions before we see a sharp upmove. Medium term looks bullish.
COMMODITIES
Muted price action has been seen as Gold (1252) is hovering around its key support of 1242-45. If 1245 holds, a quick bounce towards 1262 and 1295 can’t be ruled out. Otherwise it remains in a slow corrective move which may take it to the support of 1242 and 1232 respectively. We will remain bullish on gold while it is trading above 1230 levels. Silver (16.58) is also trading above its support of 16.50 and could be ranged within 16.50-16.90 regions.
Copper (2.59) is trading within the narrow range of 2.55-2.67. Only above 2.67, higher resistances of 2.84 can come into consideration. We wait for further directional clarity on a break on either side of 2.55 and 2.67 levels.
Brent (45.30) and WTI (42.85) were manage to close above their recent lows of 44.40 and 42, keeping the upside possibilities open. Both Brent and WTI are highly oversold in near term time frame and we will be assured of strength of Brent and WTI only when a firm and sustainable closing above 46.50 and 44.50 are made by both of them.
FOREX
A quiet day for all the majors. It remains to be seen if the US new home sales data can introduce any volatility.
Little change seen in Dollar Index (97.49) as it hovers around the support zone of 97.45-35 waiting for the next leg up for 98.10-40. Weakness may creep in only below 97.35 but that scenario has a slightly lesser probability till now.
Euro (1.1158) remains almost flat too just like the Dollar. Repeat - the immediate upside may be limited to 1.1200 levels with the major support unchanged at 1.1100-1.1090.
Dollar-Yen (111.35) has bounced back from 110.90, comfortably higher than our support zone of 110.60-50 but the upside momentum is still missing. Higher targets remain unchanged at 112-113.
Pound (1.2700) is trading almost in the middle of the range of 1.2540-1.2820 with no immediate directional clue and the sideways trading may continue for a few more sessions. Interim resistance comes at 1.2730 which has to be overcome if 1.2800-20 is to be tested.
Aussie (0.7545) remains almost unchanged with the trend still down. It may decline further to the major support of 0.7490 before a short covering bounce can be expected.
Regarding Dollar-Rupee (64.59), the resistance of 64.70-75 is expected to hold. he area around 64.40 has turned out to be a good support for the last 3 sessions. This smaller range of 64.40-75 may see a breakout next week, determining the near term path.
INTEREST RATES
The US 10-5Yr (0.39%) is stable at levels seen yesterday. There could be some chances that the yield differential could start moving up from current levels in the coming sessions without testing 0.375% on the downside.
The US yields are also stable and could move up slightly in the near term. The near term yields have risen while the longer end yields have been falling over the last 1-2 weeks, flattening the yield-curve.
The Japanese yields have started to come off from immediate resistances and looks bearish for the near term. the 10Yr (0.06%) could come off towards 0.039% by mid-next week.
The German yields are all mixed. The 30Yr (1.04%) is moving down sharply while the 10Yr (0.25%) looks stable. On the other hand the 5Yr (-0.38%) has been rising gradually and could test -0.30% in the near term.
Will Silver Be Impacted By Rising Fed Hawkishness?
Key Points:
- Fed likely to remain on course for further rate hikes in 2017.
- Industrial demand for silver remains buoyant.
- Silver likely to remain bullish in the short term but watch for Fed action.
Silver has continued to see concerted selling pressure as price action remains trapped within the confines of a sideways channel. Subsequently, the past few days has seen price action trending strongly towards the lower channel constraint where, historically, the metal has reversed. However, given the risk of near term action by the U.S. Federal Reserve, it remains to be seen if the metal will discover a bottom or continue to fall through the support structure.
In particular, the metal could potentially be facing a relatively large rout as the US economy continues to gear up for a range of monetary tightening. The risk of the Fed normalising rates was always ever present but as we move towards sustained economic growth and job gains it becomes relatively clear that the central bank will need to continue their cycle of tightening sooner, rather than later. Subsequently, the market is likely to focus upon the near term risk that a cycle of potential interest rate hikes pose.
Any such move by the Fed would potentially send Silver reeling from its current level and forward forecasting shows that 75bps of hikes to the FFR, over the next year, would see the metal trading around the $14.00 an ounce mark. However, that risk might yet to be reflected within the Silver futures curve which is still showing rising prices throughout most of 2017 and 2018. Subsequently, we could see a definite correction if the Fed actually follows through on their recent threats of further rate hikes in 2017.
Fortunately, the one fundamental factor which appears to be holding strong is the industrial demand for Silver. Physical demand continued to soar throughout most of 2016 which bodes well for the overall trend direction and may be what much of the futures curve is based on. However, this assumes that the silver market remains fair and there is plenty of evidence that this may not quite be the case with paper derivatives.
Ultimately, Silver is in for a rough few months ahead as the volatility is likely to be fairly severe when the Fed tightening cycle again commences. That rate hikes are coming is patently inevitable, especially given some of the recent gains in the job market, which suggests that it would pay dividends to position appropriately now before the rout commences in the medium term. However, for the short term at least, Silver is likely to reverse course and trend higher within its current channel.
Is The USDJPY Rally Ready To Resume?
Key Points:
- Bearishness could end within the next week or so.
- A breakout above the 100 day EMA is like to signal the resumption of the uptrend.
- Gains should be capped around the 113.00 handle.
The Dollar Yen's resurgence has been moderated over the past few days by the presence of the 100 day EMA but the pair's underlying bullishness may shine through shortly. Indeed, a number of technical developments are signalling that a breakout above the 100 day average may be seen inside of a week – potentially leading to the upside of the broader pennant being tested.
Firstly, it's worth taking a look at why last week's strong uptrend has seemingly run out of steam before addressing why the rally may yet be saved. As shown below, the key culprit in capping upsides has been the 100 day EMA which has proven to be a source of dynamic resistance once again. However, we can't ignore the influence of the stochastics whose overbought reading has also been putting pressure on the Dollar Yen. Aside from these technicals, there isn't actually much suggesting that a reversal is warranted which leaves the bulls in a fairly good position to take back control of the pair moving ahead.
What's more, there are numerous readings indicating that the bulls are very much on the cusp of pushing past the 100 day EMA and beginning the next leg of the broader uptrend. For one thing, the 12 and 20 day moving averages have seen a crossover – potentially heralding a shift in the medium-term bias for the USDJPY. Additionally, the Parabolic SAR is well below price action which would typically suggest that the rally remains intact and that we can expect further upsides in the coming days.
As for where we can expect gains to extend to, currently, we forecast that the long-term pennant will remain in play which will likely provide us with our eventual reversal point. This should mean that upsides are limited to around the 113.00 mark even if we see a decent shift in the fundamental bias back to bullish. Nevertheless, do keep half an eye on the news feed as any particularly buoyant results could see the rally run its course faster than currently predicted.
Overall, keep an eye on the pair moving ahead as it could be an interesting few sessions. As mentioned, that shifting technical bias should be felt and this could see the bulls emboldened – potentially leading to a rally back to the top of that pennant. The key moment to look for will be a move above the 100 day moving average as this signals that the bears have finally yielded.
EURGBP – Continues To Retain Its Upside Pressure
EURGBP - The cross continues to retain its short term uptrend as it looks to resume upside pressure. Support lies at the 0.8800 level where a violation will turn focus to the 0.8750 level. A break will expose the 0.8700 level. Resistance resides at the 0.8850 level where a violation if seen will turn risk towards the 0.8900 level. Further up, resistance resides at 0.8950 level followed by the 0.9000 level. Its daily RSI is bearish and pointing lower suggesting further weakness. All in all, EURGBP remains biased to the upside on recovery.
Gold Trend Line Support
One for the Gold bugs today, with daily trend line support looking to hold.
XAU/USD Daily:
As you can see, price is still hovering around the level where we identified that the heard wants to short Gold. Draw in some horizontal lines touching the key swing highs/lows and you see that we're hovering around quite a significant level.
But it's the daily trend line support that is key here. This is the third touch of the level and if it holds, will be the key going forward in terms of looking to get long.
Zoom into an intraday chart and look at the short term resistance turned support that price bounced off overnight. It's this higher and lower time frame confluence that is key in finding good entries.
White Knights And Nervous Nellies
White Knights and Nervous Nellies
Falling oil prices continue to temper sentiment in global macro markets and while the Nervous Nellies take solace as oil prices base overnight, don’t get too comfortable as the Oil patch narrative will likely be the primary catalyst in the coming months
As the North American market segues into summer, there’s been little change in the broader markets overnight, and for the most part, currency traders had another peaceful day.
On the Fed speak front, Bullard was his usual dovish self, arguing that current FOMC projections for a 3.0% fed funds rate over the next 2.5 years are “unnecessarily aggressive” and “inappropriate” but the market completely ignored.
On the US political front, Republican Senators have released their revised healthcare bill. Investors seemed to like the news as the sector rallied but offset by weakness in financials leaving the indexes virtually unchanged.Welcome to the summer doldrums in equity markets.
WTI
There was a relief rally in Oil overnight after WSJ headlines suggested that Saudi is targeting a $60 barrel oil price.While a great story line but let’s face it unless the Saudi’s step up to the plate and wear a larger share of production cuts, talking up oil prices, given OPEC’s diminishing position may do little more than providing opportunities for the Bears prowling the oil patch to sell at better levels.
Canadian Dollar
Another stellar showing for the CAD as the high retail sales print supports the Bank of Canada’s recent hawkish shift in rhetoric. But the Loonie was ready to lift off when rumours circulated and then headlines finally hit that Warren Buffet is the beleaguered alternative mortgage lender Home Capital Group Inc “ white knight “ in shining armour. .Buffett’s Berkshire Hathaway unit has agreed to l buy a 38 per cent stake for about $400 million (US$302 million) and provide a $2 billion credit line to buffer to Home Capital
The Loonie is on firm footing heading into Friday’s Key CPI, and while the inflation print will be very significant for the BoC outlook, the latest macro and financial headlines from Bay Street are very encouraging for Canadian investors. Nonetheless, an above consensus print on Friday’s CPI will likely make the July BoC rate decision live, and the Canadian dollar will take flight again as traders rework the BoC rate hike probabilities
A hawkish Central bank, improving macro storyline and a white knight galloping down Bay Street will put a smile on CAD bulls.
Australian Dollar
The fall in oil has created an uncertain environment in the commodity block pressuring the Aussie dollar which continues to underperform on the crosses. While the Aud continues to underperform traders have been nimbly buying the dips around the .7530-40 level, but so far they have little to show as the recovery has been limited despite a minor retracement in oil prices.
The Aud remains trapped in risk-averse market conditions. The next move will likely come at the vagary of Oil traders With the markets still in buy the AUD dip mode another aggressive leg lower in WTI should see the Aussie move to the .7515 breakout zone where a combination of stops and momentum selling could point to a deeper correction in the coming days
Japanese Yen
Surprisingly more volume going through than price action suggests. Two main storylines are creating this battle zone. On the one hand, we have the global markets signalling risk aversion as WTI trades below 45.00 suggesting a move to 110. ON the other, we have traders banking on the Global Central Bank shift towards hawkishness as the near-term catalyst for a weaker JPY which suggests buying the dip is the path of least resistance. However, given how weak investor sentiment is in the Oil patch, a convincing break of 42.00 WTI will likely see the 111 USDJPY give way and with near term stops lurking below the 110.80 are we could see a deeper move into the 110’s. Best be nimble best be quick is the way to trade USDJPY these days
Norwegian Krone
Another Hawkish Central Bank was providing music to STIRT and Spot traders ears overnight when the Norges Bank held interest rates but removed their easing bias.Although the Nok rallied aggressively on the news, an air of caution persists given the current pressure on energy prices.