Sample Category Title
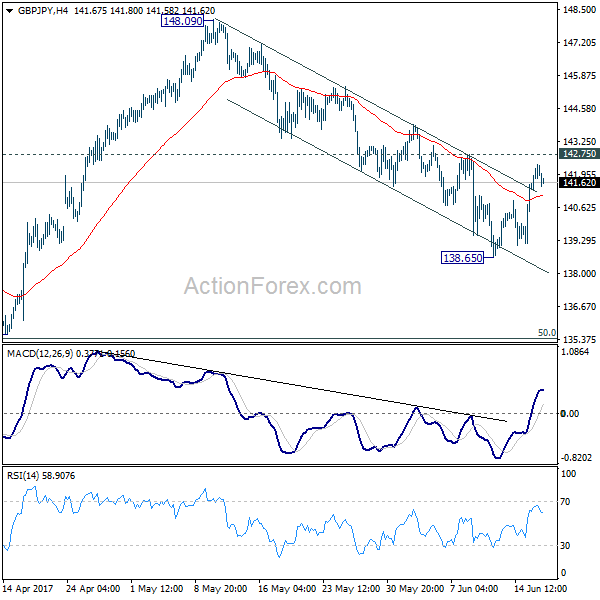
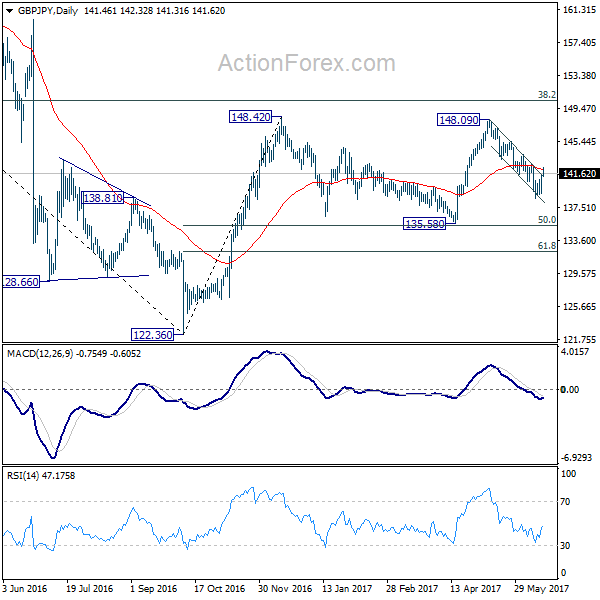
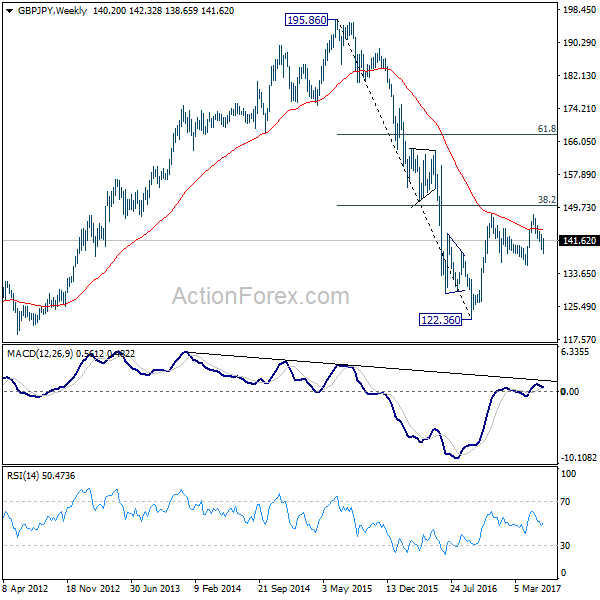
GBP/JPY Weekly Outlook
GBP/JPY edged lower to 138.65 last week but rebounded since then. The break of near term falling channel suggests reversal but it's limited by 142.75 resistance so far. Initial bias remains neutral this week with focus on 142.75. Break will indicate that fall from 148.09 has completed and turn bias back to the upside for this resistance. On the downside, break of 138.65 will resume the decline from 148.09. But in that case, we'd look for bottoming signal around 135.58, which is close to 135.39 fibonacci level, to bring rebound.
In the bigger picture, while the fall from 148.09 is deeper than expected, we're not bearish in the cross yet. Price action from 148.42 is possibly developing into a sideway pattern with fall from 148.09 as the third leg. Deeper decline could be seen but we're looking for strong support from 135.58 and 50% retracement of 122.36 to 148.42 at 135.39 to contain downside. Rise from 122.36 is still mildly in favor to resume at a later stage. However, sustained break of 135.58/39 will confirm reversal and target a retest on 122.36 low.
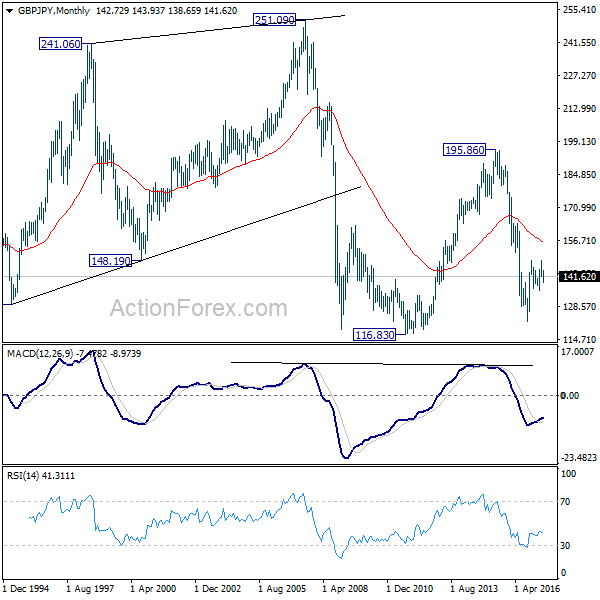
In the longer term picture, based on the impulsive structure of the decline from 195.86 to 122.36, such fall should not be completed yet. But we will now pay close attention to the structure of the rise from 122.36 to determine whether it's a corrective move, or an impulsive move. That would decide whether a break of 116.83 low would be seen.
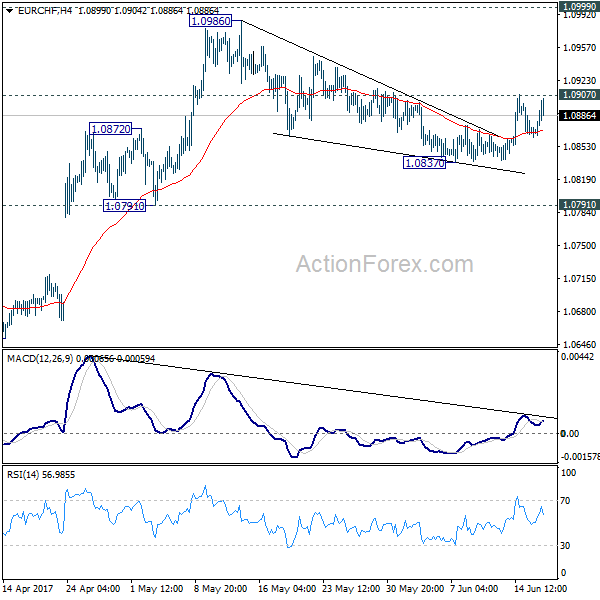
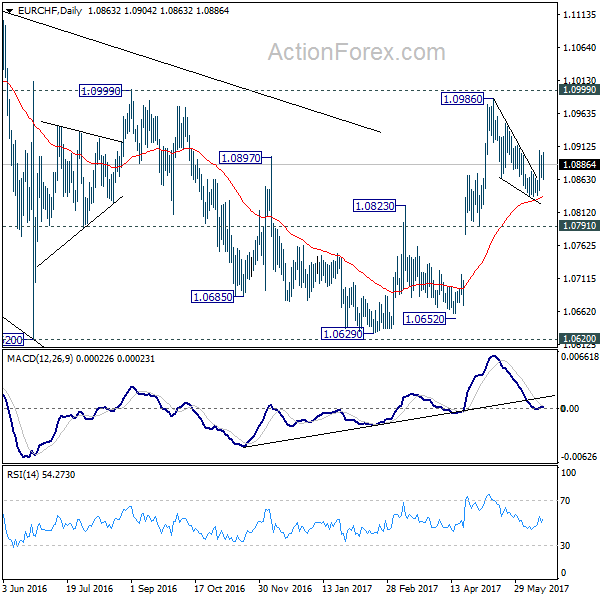
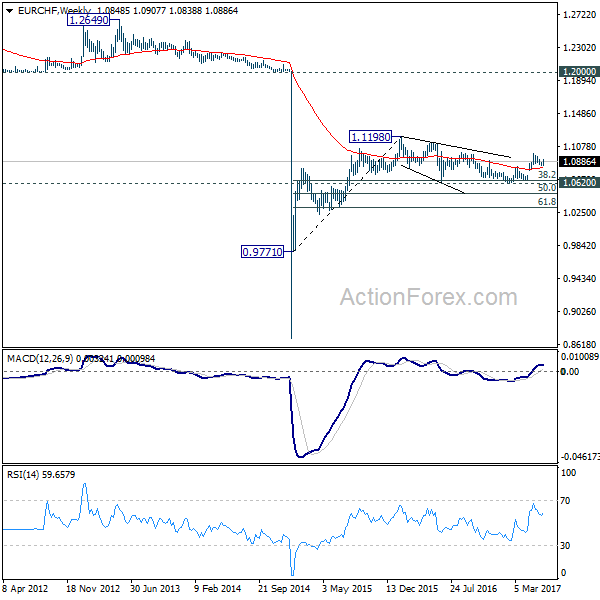
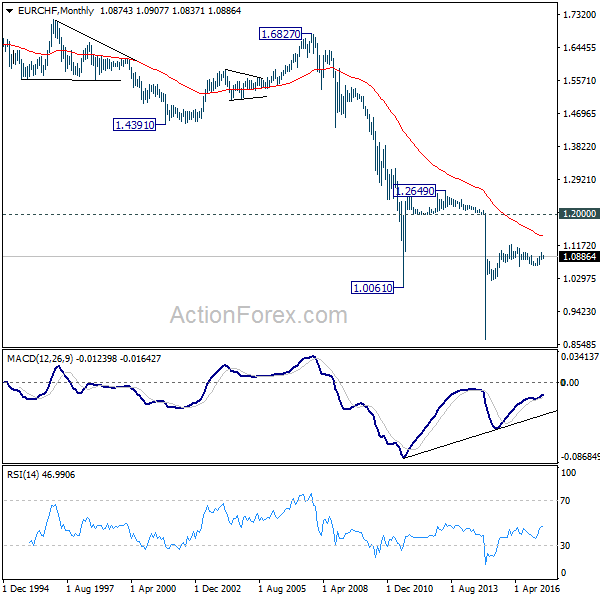
EUR/CHF Weekly Outlook
EUR/CHF's recovery last week argues that pull back from 1.0986 has completed at 1.0837. But the cross lost momentum after hitting 1.0907. Initial bias is neutral this week first. On the upside, above 1.0907 will confirm our view and target a test on 1.0986/0999 resistance zone. Below 1.0837 will extend the correction lower. Still, we'd expect strong support from 1.0791/0872 support zone to contain downside and bring rebound.
In the bigger picture, the price actions from 1.1198 are seen as a corrective move. Such correction could have completed after defending 38.2% retracement of 0.9771 to 1.1198 at 1.0653. Decisive break of 1.0999 resistance will target a test on 1.1198 high. For now, this will be the preferred case as long as 1.0791 support holds.
Dollar Lifted by Fed, Sterling by BoE. But Momentum in Both Currencies Unconvincing
Central banks were back in the driving seats in the forex markets last week. Four central banks, Fed, BoE, SNB and BoJ, delivered their monetary policy decisions. But they were all overshadowed by comments from BoC that indicated the next move would be a hike. Canadian dollar ignored the extended selloff in oil price and ended the week as the strongest major currency. Aussie and Kiwi closely followed and took the second and third places. Sterling was boosted by the surprise that three policy makers voted for a rate hike in BoE MPC meeting and closed the week up against Dollar, Euro and Yen. Dollar followed as Fed, after raising interest rate by 25bps, maintained the forecast of a total of three hikes this year. Meanwhile, Yen and Swiss Franc ended as the weakest major currencies as markets were starting to price in an era of monetary policy stimulus exit.
Doubts on whether US is ready for another hike
While Dollar and Sterling were both firm last week, we found the strength in them rather unconvincing. There are a lot of doubts in the markets on whether growth in US could withstand another Fed hike. Also, the slow down in inflation is seen as a concern of some policy makers, other than Fed Chair Janet Yellen. Dallas Fed President Robert Kaplan indicated on Friday that the decisions to hike was a tough one. He pointed out that "inflation of late has been more muted". And, more evidence on inflation path to 2% target is needed before another hike. Minneapolis Fed President Neel Kashkari, who voted against the hike, also said on Friday that "if we base our outlook for inflation on these actual data, we shouldn't have raised rates this week."
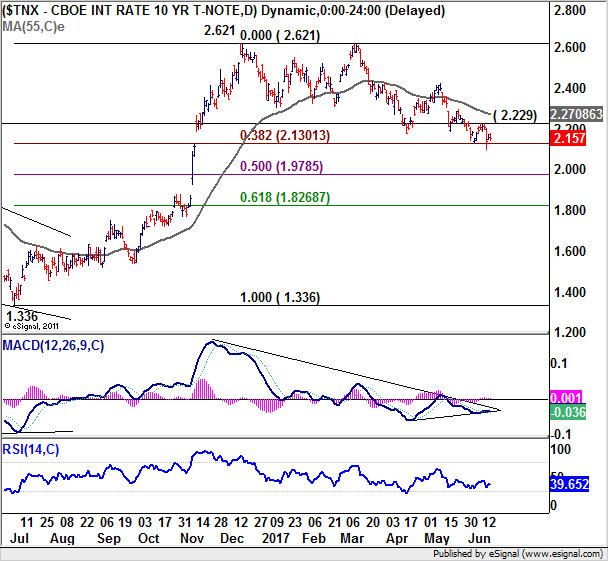
Weak recovery in TNX
The market's hesitation to bet on Fed's projected rate path was seen rather clearly in treasury yield. 10 year yield dropped sharply to as low as 2.103 after CPI disappointment. But then, TNX recovered after FOMC announcement. The recovery has been very week so far and barely kept TNX above 38.2% retracement of 1.336 to 2.612 at 2.130. It's also held well below 2.229 resistance and thus maintained bearish outlook for for the near term. We'd still expect further decline in TNX, probably not this week though, to 50% retracement at 1.978.
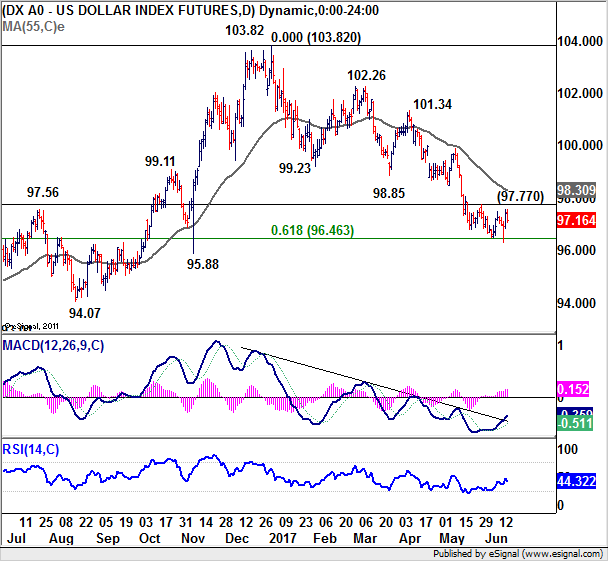
Dollar index also lacked follow through momentum
Similar picture is also seen in Dollar index. It breached 61.8% retracement of 91.91 to 103.82 at 96.46 but recovered. Upside is limited below 97.77 near term resistance so far and thus, outlook stays bearish. Further fall is still expected and sustained trading below 96.46 could push the DXY further lower to key cluster level at 91.91, 38.2% retracement of 72.69 (2011 low) to 103.82 (2016 high) at 91.93), before getting enough support for sustainable rebound. Break of 97.77 will confirm short term bottoming but not reversal yet, with focus back to 98.85 support turned resistance.
Dollar stays bearish agains Euro, Swiss Franc and Canadian
With the exception of USD/JPY, there was no sign of near term reversal in Dollar. EUR/USD was held above 1.1109 near term support and chance still favors a break out through 1.1298 key resistance. USD/CHF was also held below 0.9807 resistance and maintains bearish outlook for extending recent fall from 1.0342. USD/CAD is held well below 1.3387 near term resistance and continue to expect deeper medium term fall through 1.2968. AUD/USD is on course for 0.7740 resistance despite brief retreat. Nonetheless, GBP/USD stays bearish and we're still expecting another fall through 1.2614 support level to confirm underlying downside momentum.
More BoE members joined hawk camp
Two more BoE MPC policy makers Michael Saunders and Ian McCafferty, joined Kristin Forbes in voting for a rate hike last week. That made it a 5-3 vote to keep interest rate unchanged at 0.25%. Concerns over rising inflation were evidence in the minutes. Policymakers acknowledged that CPI inflation has been "pushed above the 2% target by the impact of last year's sterling depreciation". It "reached 2.9% in May, above the MPC's expectation". Policymakers noted that "inflation could rise above 3% by the autumn, and is likely to remain above the target for an extended period as sterling's depreciation continues to feed through into the prices of consumer goods and services". The members also raised concerns over currency depreciation on inflation. They noted that "2.5% fall in the exchange rate since the May Inflation Report, if sustained, will add to that imported inflationary impetus".
Political uncertainties limit Sterling strength
In spite of that, the markets hesitated to jump into Sterling long because of political uncertainties. Theresa May somewhat survived the disastrous election and stayed as the Prime Minister of UK. But she's now entering into Brexit negotiation with EU in a much weaker position. Formal negotiation will start as scheduled on Monday while May has already conceded to EU's plan of settling the divorce bill first. Locally, May has been facing a lot of calls for a softer approach on Brexit, as well as cross-party involvement in the negotiation. Any wrong step with EU would pull May back into risk of being ousted.
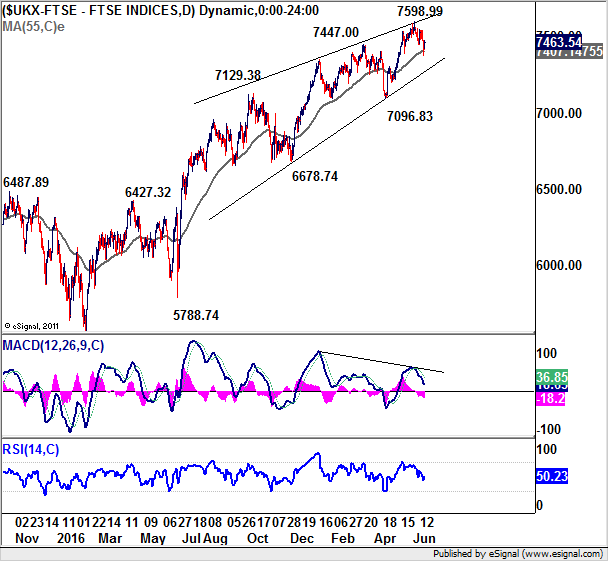
Impact of Pound depreciation on FTSE faded
FTSE stayed somewhat resilient as it drew support from 55 day EMA and recovered, after the post BoE selloff. Upside momentum has been diminishing clearly with bearish divergence condition in daily MACD. And the wedge like structure also indicates the same thing. It should be noted that current up trend started back at 5788.74, on the sharp selloff in Sterling following Brexit referendum. The last leg of rise started after PM May called for a snap election. It's starting to look like that impact of Pound depreciation on corporate earnings could be starting to fade. That is, if we should seen persistent positive correlation between Sterling and FTSE, it could be the indication of the start of real trouble in the UK economy.
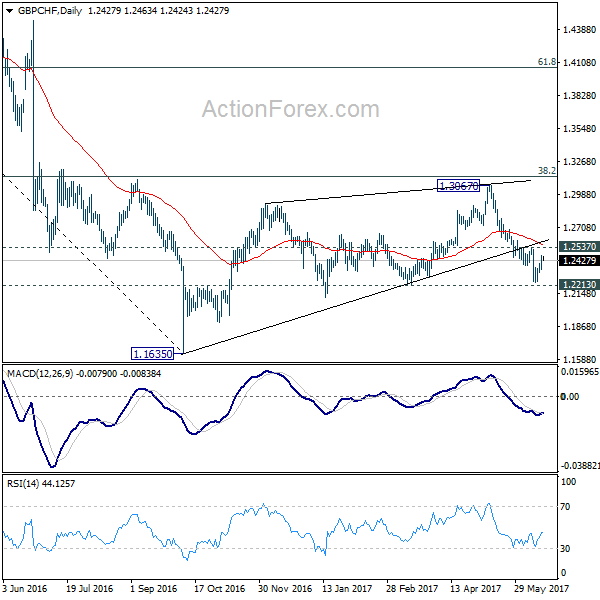
Sterling stays bearish against Euro, Dollar and Swiss Franc
Technically, Sterling also maintained near term bearish outlook against Dollar, Euro and Swiss France. GBP/USD was held well below 1.2977 resistance while EUR/GBP stayed above 0.8639 support. GBP/CHF recovered ahead of 1.2213 key support level last week but upside was limited well below 1.2537 resistance so far. We're maintaining our view that corrective pattern from 1.1635 has completed with three waves up to 1.3067 already. Deeper decline is expected in the cross as long as 1.2977 holds. Break of 1.2213 should confirm our view and target a new low below 1.1635.
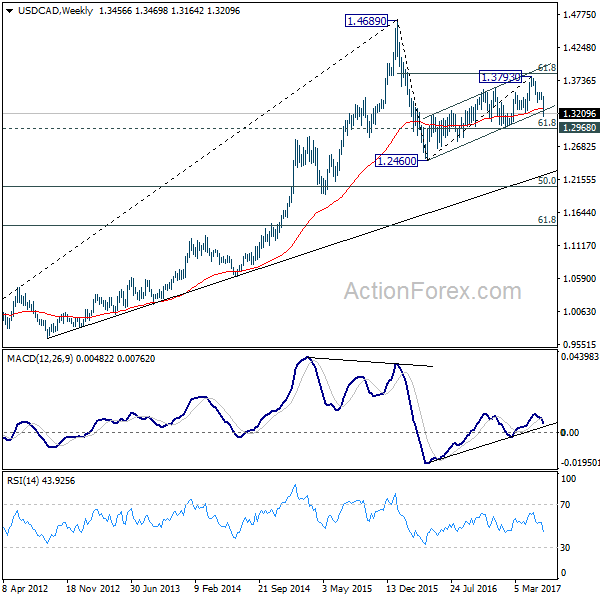
Trading strategy: Hold USD/CAD Short and EUR/GBP Long
Regarding trading strategy, we're holding on to USD/CAD short (sold at 1.3510). The anticipated downside breakout finally happened as the pair dived to as low as 1.3164 and took out initial target 1.3222. We're holding on to the view that corrective rise from 1.2460 is already finished at 1.3793. Fall from there is resuming larger pattern from 1.4689. That is, break of 1.2460 is anticipated in medium term. However, from a near term perspective, USD/CAD might find strong support from 1.2968 (61.8% retracement of 1.2460 to 1.3793 at 1.2969) to bring rebound, before extend the medium term trend. Therefore, we will now lower the stop to 1.3400 and target to take profit at 1.3000, then sell USD/CAD again later.
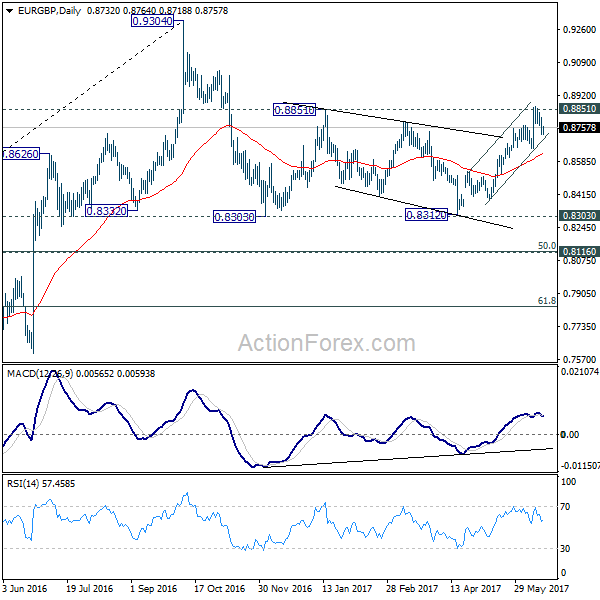
EUR/GBP failed to sustain above 0.8851 resistance last week and retreated. As the cross dipped to 0.8718, our buy at 0.8740 was filled. The retreat from 0.8851 is corrective looking so far and was held well above 0.8639. Hence, we'll stay long in the cross, with stop unchanged at 0.8640. We're expecting further rally to retest 0.9304 high. And, we'll look at the momentum of the next rise to determine the chance of a break of 0.9304 in medium term.
GBP/JPY Weekly Outlook
GBP/JPY edged lower to 138.65 last week but rebounded since then. The break of near term falling channel suggests reversal but it's limited by 142.75 resistance so far. Initial bias remains neutral this week with focus on 142.75. Break will indicate that fall from 148.09 has completed and turn bias back to the upside for this resistance. On the downside, break of 138.65 will resume the decline from 148.09. But in that case, we'd look for bottoming signal around 135.58, which is close to 135.39 fibonacci level, to bring rebound.
In the bigger picture, while the fall from 148.09 is deeper than expected, we're not bearish in the cross yet. Price action from 148.42 is possibly developing into a sideway pattern with fall from 148.09 as the third leg. Deeper decline could be seen but we're looking for strong support from 135.58 and 50% retracement of 122.36 to 148.42 at 135.39 to contain downside. Rise from 122.36 is still mildly in favor to resume at a later stage. However, sustained break of 135.58/39 will confirm reversal and target a retest on 122.36 low.
In the longer term picture, based on the impulsive structure of the decline from 195.86 to 122.36, such fall should not be completed yet. But we will now pay close attention to the structure of the rise from 122.36 to determine whether it's a corrective move, or an impulsive move. That would decide whether a break of 116.83 low would be seen.
Summary 6/19 – 6/23
Monday, Jun 19, 2017
[php_everywhere] [/php_everywhere]
Tuesday, Jun 20, 2017
[php_everywhere] [/php_everywhere]
Wednesday, Jun 21, 2017
[php_everywhere] [/php_everywhere]
Thursday, Jun 22, 2017
[php_everywhere] [/php_everywhere]
Friday, Jun 23, 2017
[php_everywhere] [/php_everywhere].
Weekly Economic and Financial Commentary
U.S. Review
Monetary Policy in a Less Data-Dependent World
- The FOMC raised its short-term target rate 25 basis points at its June meeting to 1.0–1.25 percent, and published an addendum to lay the foundation for normalizing the Fed's balance sheet despite a recent weakening trend in inflation.
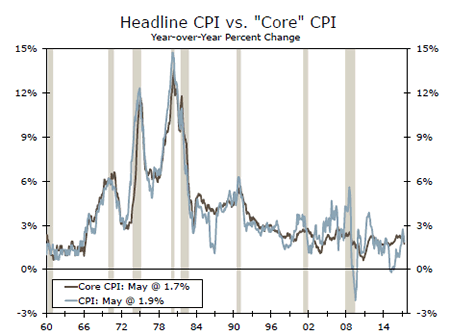
- Headline and core consumer prices came in weaker than expected in May, further bringing into question an additional rate hike this year. The Fed views the recent inflation data as being driven by "one-off" components. Other economic data released during the week including industrial production, retail sales and housing starts also came in below consensus estimates.
Is the Fed Still Data Dependent?
The FOMC raised its short-term target rate 25 basis points at its June meeting to 1.0–1.25 percent, and published an addendum to lay the foundation for normalizing the Fed's balance sheet, with the caveat economic activity "evolves broadly as anticipated." It is that "anticipation" that is causing the latest divergence in views between the Fed and financial markets on current and future economic conditions and whether the outlook substantiates an additional rate hike this year, and the start of the balance sheet reduction program, especially given the recent weakening trend in inflation.
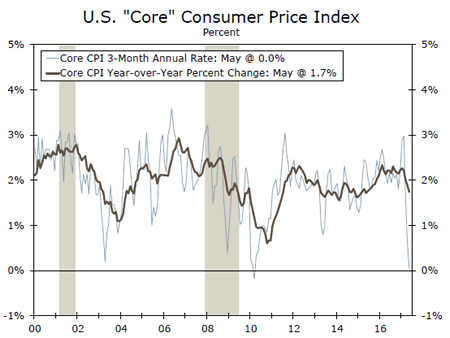
Indeed, the May Consumer Price Index (CPI) was released on the morning of the FOMC meeting with headline and core prices coming in weaker than expected. On the back of weak energy prices, headline CPI slipped 0.1 percent from the month before, pulling the year-over-year reading down to 1.9 percent. Core CPI, which excludes food and energy, rose just 0.1 percent monthover- month, with the three-month annualized rate coming in flat during the month further underscoring the softening trend.
During the opening statement of the press conference, Fed Chair Yellen described recent sluggish inflation prints as "one-off reductions," pointing to lower readings in wireless telephone services and prescription drugs. The recent rate hike in light of these soft readings has brought into question the committee's stance on data dependence, where the Fed has historically relied on labor market conditions and rising inflation, as a yardstick to raise rates further. The implied probability of a third rate hike this year fell markedly. That said, we continue to expect one more rate hike this year, but the additional increase will be highly dependent on the recent trend in inflation reversing course and moving closer to the Fed's 2 percent target.
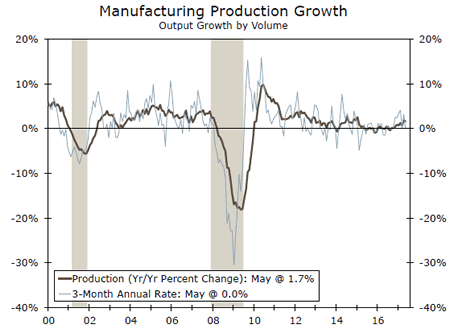
In other news this week, we received a heavy dose of economic data releases, including industrial production, retail sales and housing starts. The headline print for industrial production was unchanged in May but manufacturing output fell during the month. The pulse on the consumer also showed anemic monthly growth with the headline slipping 0.3 percent in May. A silver lining in the report was the so-called control group, which feeds directly into the calculation of real GDP, being revised up sharply, highlighting the overall positive trend in spending.
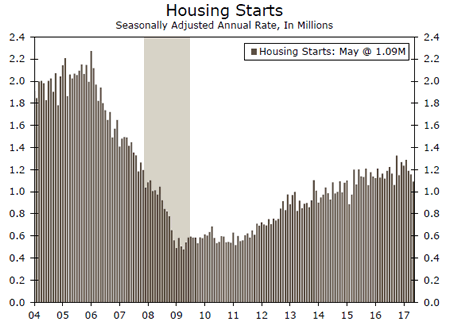
Also coming in below expectations, housing starts fell 5.5 percent in May to a 1.09 million-unit pace with single-family and multifamily tumbling during the month. We continue to believe milder-than-usual weather in the beginning of the year brought construction activity forward; however, multifamily starts registered its fifth straight monthly decline underscoring the shift to single-family construction. This trend is also evident in apartment operating fundamentals where the occupancy rate peaked in mid-2014 and asking rent growth is moderating. Permits, which are less sensitive to weather fluctuations, also came in below expectations, falling 4.9 percent. All of these economic indicators warrant watching in the coming months, especially as further tightening in monetary policy is expected.
U.S. Outlook
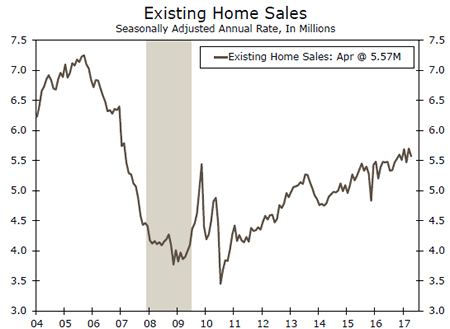
Existing Home Sales • Wednesday
Resales declined 2.3 percent in April to a 5.57 million unit annualized rate—down from March's cycle-high pace of 5.7 million units. Tight inventory is increasingly apparent, as the median home sold in April was on the market for less than a month, the shortest reported since the series began in 2011. Price pressures have been relatively tame, though the distribution of homes sold remains skewed toward higher-priced homes.
Lean inventories should continue to place an upper limit on existing home sales in May. Pending home sales, which tend to lead existing home sales by six to eight weeks, declined 1.3 percent in April, suggesting resales may also soften in May. Demand is strong, however, as continued job and income gains put homeownership in reach of more households.
Previous: 5.57M Wells Fargo: 5.55M Consensus: 5.51M
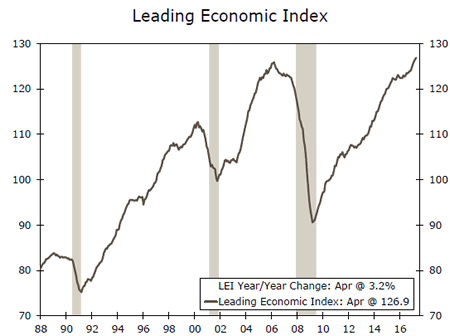
Leading Indicators • Thursday
The Leading Economic Index (LEI) has pointed to economic growth continuously in recent months, with April marking its eighth consecutive monthly gain. The measure is now at its highest point of the series, buoyed by continued gains in the stock market and persistently low unemployment claims. The interest rate spread has also been a continued source of strength, most recently accounting for half of April's monthly growth of 0.32 percent. ISM new orders have also lifted the leading index in 2017, a trend that should continue in May as the measure has kept much of its recent strength. Unemployment claims remain near their lowest levels in more than 40 years, and average weekly claims fell even further in May, suggesting this component will likely boost the index in May as well. The stock market is also likely to provide a boost to the index in May after having a neutral impact in April when the stock market was essentially flat.
Previous: 0.3% Wells Fargo: 0.4% Consensus: 0.4% (Month-over-Month)
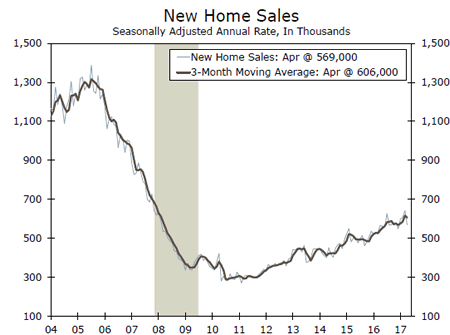
New Home Sales • Friday
New home sales fell 11.4 percent in April to a 569,000-unit pace, but the decline was tempered slightly by upward revisions to the previous three months of data. Mild winter weather likely pulled some new home sales forward in the year, resulting in a smaller than usual April gain. On a year-to-date basis, new home sales were up 11.3 percent from the first four months of last year. All four regions of the nation posted stronger sales of new homes through April 2017 than the previous year, particularly in the Northeast and Midwest, which were most affected by the mild winter.
We are optimistic about new home sales going forward in 2017. Our view is based on strong demand fundamentals coupled with lean inventory of available homes. The NAHB homebuilder optimism survey rose in May, which supports our call for a rebound in May. Builder optimism faded slightly in June but remains elevated near cycle-highs.
Previous: 567K Wells Fargo: 615K Consensus: 599K
Global Review
Summer of Discontent
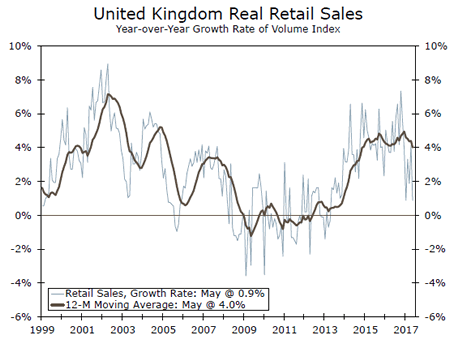
- It has been a tough stretch for the United Kingdom and its economy. After last week's unsettling election, the flow of economic data this week did little to calm already unsettled nerves. May retail sales figures showed an even bigger retrenchment than expected and CPI inflation climbed to its fastest rate in four years. The high inflation is adding to the growing dissent reflected at this week's meeting of the Bank of England which voted 5-3 to hold rates steady.
- In other global economic news, the great moderation in China continues and Australia's economy has a hot job market.
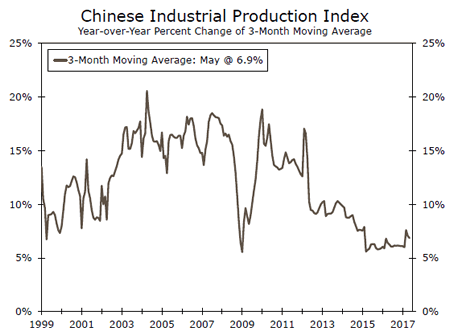
Chinese Moderation Continues
China's industrial production (IP) held steady at 6.5 percent on a year-over-year basis in May. The outturn was a tenth of a percentage point better than expected with double-digit gains in categories like general purpose equipment, telecommunications & computer as well as electrical equipment and machinery contributing to the increase.
We also learned that retail sales in China also held steady at 10.7 percent in May and fixed asset investment slowed to 8.6 percent in May from 8.9 percent in the prior month. Muted domestic demand is keeping a lid on the pace of sales growth. Fixed investment growth remains a shadow of its former self. Taken together, the data out of China this week suggest ongoing moderation in the pace of growth in China.
Collectively these figures also offer perspective on the approach of China's central bank, the Peoples Bank of China, which made no change to monetary policy and its liquidity operations, in contrast to March when it increased borrowing costs. The determination to remain on hold was notable as it occurred in the same week that the Federal Reserve delivered a rate hike and adopted what most market-watchers considered to be a more hawkish bias at its meeting this week.
Growing Dissent at the Bank of England
It was a busy week for central bank meetings. The Bank of England (BoE) held rates steady again at its June meeting held earlier this week. What was notable was that rather than only one member of the Monetary Policy Committee voting to raise rates, the dissent climbed to three. So, it was a 5-3 decision to leave its main policy rate steady at 0.25 percent, despite rising inflation in the United Kingdom.
It is a time of pronounced uncertainty in the United Kingdom where market-watchers are still coming to grips with last week's snap election in which Prime Minister May lost the Conservative parliamentary majority that she had hoped to extend. It is unclear what the implications of the outcome mean for the Brexit negotiations, which is evident in the volatility of British pound sterling. Making matters worse and adding to the confusion, a deadly fire in London this week postponed a speech from BoE Governor Carney, which was supposed to elucidate markets on monetary policy.
May figures for core retail sales in the United Kingdom were also released this week, showing a larger-than-expected decline of 1.6 percent on the month and now up just 0.9 percent over the past year. Meanwhile, in a separate report, yearly CPI inflation rose to 2.9 percent, the fastest rate in five years.
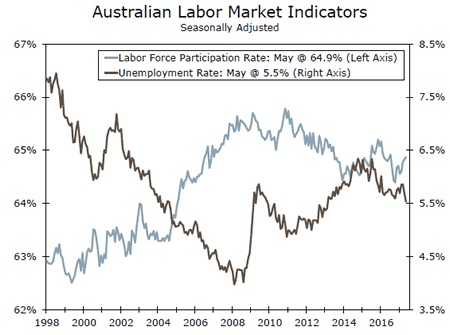
Australian Labor Market
The Australian economy added a net 42,000 new jobs in May as the unemployment rate fell to its lowest level since 2013. The second largest monthly increase in full-time jobs in Australia was tempered slightly by a 10,100 reduction in part-time payrolls. The participation rate climbed to 64.9 percent.
Global Outlook
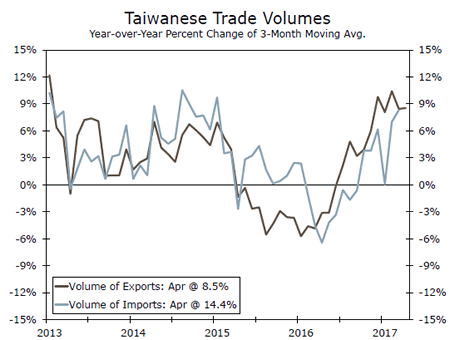
Taiwan Export Orders • Tuesday
On Tuesday of next week, Taiwan is slated to release data on export orders for May. The consensus forecast is calling for 7.6 percent growth, year over year. If global growth continues to show signs of improvement, then Taiwanese export orders should follow suit–a crucial ingredient to a healthy Taiwanese economy, which is heavily dependent on trade. We look for global GDP growth to strengthen a bit this year. Taiwanese export volumes have been trending upward, and were up 8.5 percent in April on a year-0ver-year basis.
Taiwan has extensive trade ties with mainland China. Final spending on the mainland accounts for about 10 percent of value added in Taiwan. Although we forecast that GDP growth in China will slow a bit in 2017 relative to the 6.7 percent rate that was registered last year, an implosion of the Chinese economy does not look very likely, at least not in the foreseeable future.
Previous: 7.4% Consensus: 7.6% (Year-over-Year)
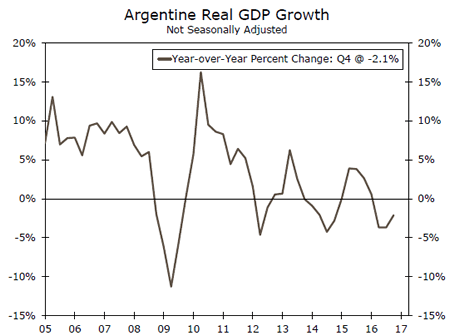
Argentina GDP • Wednesday
The Argentine economy contracted 2.1 percent year over year in Q4-2016, after a 3.7 percent decline in Q3-2016. The lack of growth can be linked to weaker government and consumer spending and business investment. The recovery in exports and imports, up 7.7 percent and 2.1 percent year over year, respectively, was not enough to offset overall Q1 weakness. Moreover, industrial output fell 2.3 percent year over year in April—marking 15 straight months of annual declines. Furthermore, Argentina's unemployment rate jumped to 9.2 percent in Q1 from a 7.6 percent rate in Q4, reviving concerns in the labor market.
The Macri administration, in our view, needs to generate economic growth quickly or face an increasingly difficult political environment as mid-term elections near. For now, the economy is not showing much progress, although officials continue to argue that the recovery is close.
Previous: -2.1% (Year-over-Year)
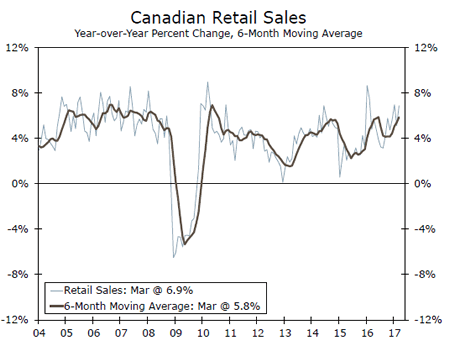
Canada Retail Sales • Thursday
Next Thursday, Canada is set to release retail sales data for April. Year over year, retail sales have been trending upwards, thanks to Canadian households continuing to spend. Households were one of the largest contributors to growth in Q1-2017 with increases in consumer spending and vehicle purchases. Consumer spending has been so strong that Canadians' personal savings rate has taken a hit, falling to 4.3 percent in Q1. Additionally, the household debt service ratio has started to increase, rising to 14.2 percent over the quarter—a course not sustainable in the long term.
Canada is also slated to release inflationary figures for May next week. The CPI was up 1.6 percent in April, year over year, but is unable to stay above 2 percent for any meaningful amount of time. Sliding oil prices may put further downward prices on Canadian prices.
Previous: 0.7% (Month-over-Month)
Point of View
Interest Rate Watch
Movable Model
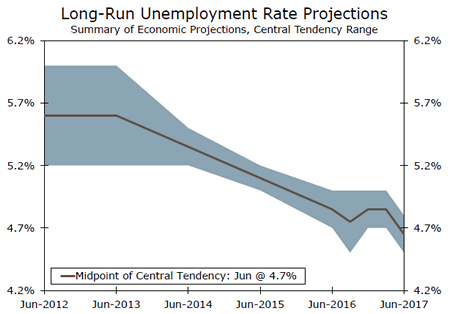
Since 2012, the long-run unemployment rate projection from the FOMC has continually moved down, as illustrated in the top graph.
One model-based approach to monetary policy would be to set the federal funds rate as a function of the deviation of the current pace of inflation and the level of the unemployment rate from their respective a priori longer-run equilibrium levels. For example, for the unemployment rate, if that rate is above the long-run target then policymakers should lower the funds rate.
The problem illustrated in the top graph is that the benchmark for policy, the long-run unemployment rate, keeps moving and so then does our model for policy action.
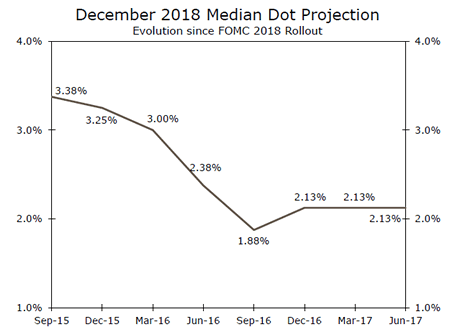
Growth, Inflation Drives Policy Rate
Since 2012, the long-run GDP projections by the FOMC have consistently been lowered. In addition, the measured pace of inflation has been less than the target 2 percent pace set by the FOMC. As a result, the median dot projection of the fed funds policy rate for end of year 2018 has also been lowered on a consistent basis until very recently. This series of auto correlated errors has meant a policy drift in that whatever the model the FOMC is using to set policy, as well we suspect the private market, the net result has been a consistent overestimation of the equilibrium policy interest rate. Moreover, the consensus also overestimated the benchmark 10-year rate for 2016 and the prior two years.
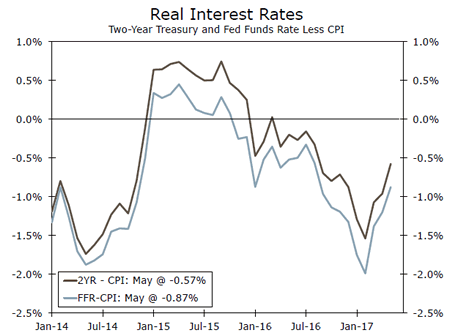
The Result: Accommodative Policy Persists
As illustrated in bottom graph, accommodative policy, as measured by the real interest rate on the two-year Treasury and the funds rate, remains very much in place. For the real economy, this is a plus, but for savers, this form of financial repression has meant negative real returns. Finally, the lack of real punch in fields such as housing starts and business investment that one would expect to be interest rate sensitive leads us to be cautious on how much restraint the FOMC can impose going forward.
Credit Market Insights
Refis Drive Mortgage Applications
The Mortgage Bankers Association's (MBA) Weekly Mortgage Applications Survey showed that for the week-ended June 9, applications volume was down 11.6 percent year-over-year. At 4.13 percent (including points and fees), mortgage rates are currently at the lowest rate since November. However, increased demand from mortgage applications for refinancing has driven the total market index level up. Refinancing mortgages accounted for 45.4 percent of total loan volume on the week, up from 42.1 percent the week prior. This figure is down both over the year and year-to-date. It remains to be seen if the recent pick up in mortgages for refinancing relative to mortgages for purchase is simply a byproduct of homeowners locking in the preferable low mortgage rates and not indicative of a reversal of the extremely low rate of refinancing, or if the longer run decline in volume of mortgages for refinancing could be coming to an end. The year-to-date drop in refinancing mortgages could signal that an increase in both existing and pending home sales may be on the horizon, each of which have been held back due to low inventories.
The average mortgage loan for purchase size has been steadily increasing in conjunction with home prices, with the average mortgage size up 3.6 percent on a year-over-year basis. In the current housing market, with tight supply and perceptibly elevated prices, it is worth keeping an eye on mortgage volume and size as a leading indicator of home sales.
Topic of the Week
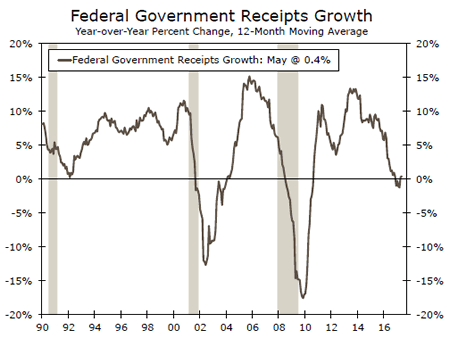
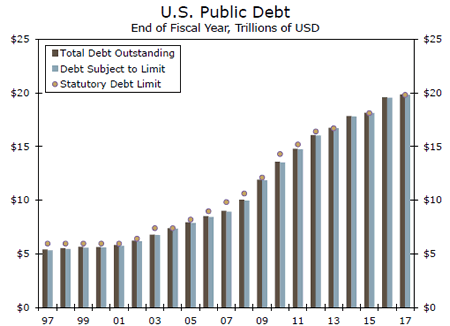
Debt Ceiling Concerns Mount
In the coming weeks, we expect the discussion over how and when to lift the debt ceiling to come to the forefront. With tax collections coming in below expectations and, by our estimate, the federal budget deficit exceeding last year's level, all signs point to the need for Congress to lift the debt ceiling by the first or second week in September. This estimate, however, is subject to change depending on tax and spending data in the coming months. While it is true that the deadline is some way off, the complication stems from the fact that Congress is not in session the entire month of August and does not return until September 5. Thus, we expect that Congress will act before the August recess to alleviate the need to rapidly address the issue upon their return.
It is important to note that, if Congress fails to lift the debt limit before they leave for recess, it does not automatically spell disaster. We suspect there will at least be a few days upon their return to lift the borrowing limit. This roll-of-the-dice approach would carry a high-level of risk, however, which we expect Congress will strive to avoid. In our view, Congress will pass a "clean" debt ceiling suspension given that bipartisan support will be needed in the Senate and most likely in the House of Representatives.
Beyond the debt ceiling debate, the Senate continues its work on a framework to repeal and replace the Affordable Care Act, which is eating into the legislative timeline for a number of other tasks that need to be completed. Congress still needs to pass a fiscal year 2018 budget resolution, but this can only be accomplished after they have finished work on the Affordable Care Act replacement, which is tied to the FY 2017 budget resolution. There are multiple other issues that need to be addressed before September 30, including a bill to fund the government beyond the end of September, which is a separate but related process from the FY 2018 budget resolution. The point is that once Congress returns from August recess, the timeline will be tight and policy uncertainty should remain in place.