
Sample Category Title
Euro-Zone’s Trade Surplus Narrowed More-Than-Expected In April
For the 24 hours to 23:00 GMT, the EUR declined 0.55% against the USD and closed at 1.1150.
Macroeconomic data showed that the Euro-zone's seasonally adjusted trade surplus narrowed more-than-expected to a level of €19.6 billion in April, compared to a revised surplus of €22.2 billion in the prior month, while market participants had expected the region to register a trade surplus of €22.3 billion.
The greenback gained ground against its key counterparts, following upbeat US jobless claims data that further supported the Federal Reserve's (Fed) notion of a tightening labour market that could pave the way for another interest rate hike this year.
Data revealed that the number of Americans filing for fresh jobless claims dropped more-than-anticipated to a level of 237.0K in the week ended 10 June, compared market expectations of a fall to a level of 241.0K. In the previous week, initial jobless claims had registered a level of 245.0K. Moreover, the nation's New York Empire State manufacturing index jumped more-than-expected to its highest level in nearly three years of 19.8 in June, compared to market consensus of an advance to a level of 4.0, thus indicating that business activity rebounded strongly in the New York state. The index had registered a level of -1.0 in the prior month. Meanwhile, the region's Philadelphia Fed manufacturing index eased less-than-expected to a level of 27.6 in June, following a level of 38.8 in the prior month.
Another set of economic data showed that manufacturing production in the US unexpectedly fell 0.4% on a monthly basis in May, defying market expectations for a rise of 0.1%. In the previous month, manufacturing production had recorded a revised rise of 1.1%. Further, the nation's industrial production remained flat on a monthly basis in May, whereas investors had envisaged for an advance of 0.2%. Industrial production had registered a revised rise of 1.1% in the previous month. Also, the nation's NAHB housing market index surprisingly fell to a level of 67.0 in June, compared to market expectations of a rise to a level of 70.0. The index had recorded a revised level of 69.0 in the prior month.
In the Asian session, at GMT0300, the pair is trading at 1.1149, with the EUR trading slightly lower against the USD from yesterday's close.
The pair is expected to find support at 1.1113, and a fall through could take it to the next support level of 1.1076. The pair is expected to find its first resistance at 1.1205, and a rise through could take it to the next resistance level of 1.1260.
Moving ahead, market participants will focus on the Euro-zone's final consumer price index for May, slated to release in a few hours. Moreover, the US flash Michigan consumer sentiment index for June along with housing starts and building permits data for May, set to release later in the day, will garner significant amount of market attention.
The currency pair is showing convergence with its 20 Hr moving average and trading below its 50 Hr moving average.

BoE Narrowly Votes In Favour Of Maintaining Record Low Interest Rates
For the 24 hours to 23:00 GMT, the GBP slightly declined against the USD and closed at 1.2754.
Yesterday, the Bank of England (BoE), in a widely-expected move, opted to leave the key interest rate steady at 0.25% and the bond purchase programme remains unchanged at £435 billion, but surprised investors as three board members voted in favour of an immediate interest rate hike, swayed by fears of rising inflation. Minutes of the meeting disclosed that policy makers now expect inflation could overshoot the 2.0% target by more than previously thought. Further, it noted that officials judge the robust British labour market as a sign that rates may need to rise sooner than expected.
On the data front, Britain’s retail sales slid 1.2% on a monthly basis in May, higher than market expectations for a fall of 0.8%, intensifying worries about a slowdown in consumer spending as households remain grappled with rising inflation and meagre wage growth. In the prior month, retail sales had recorded a revised rise of 2.5%.
In the Asian session, at GMT0300, the pair is trading at 1.2772, with the GBP trading 0.14% higher against the USD from yesterday’s close.
The pair is expected to find support at 1.2710, and a fall through could take it to the next support level of 1.2649. The pair is expected to find its first resistance at 1.2814, and a rise through could take it to the next resistance level of 1.2857.
The currency pair is trading above its 20 Hr and 50 Hr moving averages.

BoJ Keeps Policy Steady, Revises Up View On Consumption
For the 24 hours to 23:00 GMT, the USD rose 1.37% against the JPY and closed at 110.85.
In the Asian session, at GMT0300, the pair is trading at 111.17, with the USD trading 0.29% higher against the JPY from yesterday’s close.
Earlier today, the Bank of Japan (BoJ), at its latest monetary policy meeting, maintained its key interest rate steady at -0.10% and gave a more brightened outlook on private consumption and overseas growth, signalling its confidence that an export-driven economic recovery was broadening and gaining momentum.
The pair is expected to find support at 110.01, and a fall through could take it to the next support level of 108.85. The pair is expected to find its first resistance at 111.80, and a rise through could take it to the next resistance level of 112.43.
Moving ahead, traders will keep a close watch on a speech by the BoJ Governor, Haruhiko Kuroda, due in a few hours.
The currency pair is trading above its 20 Hr and 50 Hr moving averages.

Swiss National Bank (SNB) Left Its Key Interest Rate Unchanged
For the 24 hours to 23:00 GMT, the USD rose 0.38% against the CHF and closed at 0.9750.
Yesterday, the Swiss National Bank (SNB) held its key interest rate steady at -0.75%, meeting market expectations, citing strength in the local currency and an absence of price pressures. The SNB President, Thomas Jordan, stated that recent data indicated that the Swiss economy is on the road to recovery.
Further, the SNB also reiterated that the Swiss Franc is still significantly overvalued and that it would remain active in the foreign exchange market as necessary.
Separately, the central bank kept its 2017 inflation forecast steady at 0.3% but trimmed its 2018 outlook to 0.3%, down by 0.1% and its 2019 forecast to 1.0% from 1.1%.
In the Asian session, at GMT0300, the pair is trading at 0.9749, with the USD trading marginally lower against the CHF from yesterday’s close.
The pair is expected to find support at 0.9713, and a fall through could take it to the next support level of 0.9677. The pair is expected to find its first resistance at 0.9778, and a rise through could take it to the next resistance level of 0.9807.
Next week, investors will look forward to a speech by the SNB President along with Switzerland’s trade balance figures.
The currency pair is showing convergence with its 20 Hr moving average and trading above its 50 Hr moving average.

Canada’s Existing Home Sales Declined By The Most Since August 2012 In May
For the 24 hours to 23:00 GMT, the USD rose 0.14% against the CAD and closed at 1.3254.
The Canadian Dollar lost ground, after Canada's existing home sales dropped 6.2% MoM in May, recording its biggest decline in nearly five years. In the prior month, existing home sales had fallen 1.7%.
In the Asian session, at GMT0300, the pair is trading at 1.3261, with the USD trading a tad higher against the CAD from yesterday's close.
The pair is expected to find support at 1.3227, and a fall through could take it to the next support level of 1.3194. The pair is expected to find its first resistance at 1.3301, and a rise through could take it to the next resistance level of 1.3342.
The currency pair is trading between its 20 Hr and 50 Hr moving averages.

EUR/JPY Candlesticks and Ichimoku Analysis
Weekly
• Last Candlesticks pattern: Hammer
• Time of formation: 19 Sep 2016
• Trend bias: Down
Daily
• Last Candlesticks pattern: Doji
• Time of formation: 28 Mar 2017
• Trend bias: Near term up
EUR/JPY – 123.39
Although the single currency traded lower yesterday and initial downside risk remains for the erratic decide from 125.82 top to extend weakness to 122.00, reckon downside would be limited to 121.60-65 (38.2% Fibonacci retracement of 114.85-125.82) where renewed buying interest should emerge, bring another rise later, above 124.00-05 would suggest low is possibly formed, bring rebound to 124.70-75, break there would add credence to this view, then further gain to 125.31 would follow. Having said that, only a break of previous chart resistance at 125.82 would confirm recent upmove has resumed and extend subsequent headway to 126.50-60, then 127.00-10.
On the downside, whilst initial weakness to 122.40-50 and then 122.00-10 cannot be ruled out, reckon downside would be limited to 121.60-65 (38.2% Fibonacci retracement of 114.85-125.82) and bring another upmove later to aforesaid upside targets. Below indicated previous support at 120.60 would abort and signal a temporary top has been formed, bring retracement of recent entire rise to 120.30-35 (50% Fibonacci retracement) and then 120.00 but reckon downside would be limited to 119.40-50 and price should stay above indicated support at 118.92, bring rebound later.
Recommendation: Buy at 121.60 for 124.60 with stop below 120.60.

On the weekly chart, as the single currency traded narrowly after meeting resistance just below recent high of 125.82, retaining our view that further consolidation below this level would be seen, however, reckon downside would be limited to 122.00 and 121.50-60 should hold, bring another rise later, above 125.82 would extend the erratic rise from 109.49 low to 126.45-50, then towards 127.40-50 but reckon another previous resistance at 128.23 would limit upside and price should falter below 129.60-65 (50% Fibonacci retracement of 149.79-109.49) and price should falter below psychological resistance at 130.00, bring retreat later this month.
On the downside, although initial pullback to 122.40-50 and possibly 122.00 cannot be ruled out, reckon downside would be limited and renewed buying interest should emerge around 121.60-65 and bring another rise later. Only below support at 120.60 would defer and risk weakness to the Kijun-Sen (now at 120.34) and then 120.00 which is likely to hold on first testing. Looking ahead, euro needs to penetrate indicated support at118.92 to shift risk to the downside for further fall to 118.00, however, downside should be limited to previous resistance at 117.82 and bring rebound later. A weekly close below 117.82 would suggest first leg of rebound from 114.85 has ended, bring weakness to 117.00 but price should stay above 116.20-25, bring another rebound later.

USD/CAD Candlesticks and Ichimoku Analysis
Weekly
• Last Candlesticks pattern: Shooting doji
• Time of formation: 02 May 2016
• Trend bias: Up
Daily
• Last Candlesticks pattern: Bearish engulfing
• Time of formation: 5 May 2017
• Trend bias: Up
USD/CAD – 1.3262
Although the greenback did drop in line with our bearish expectation and our short position entered at 1.3540 finally reached our downside target at 1.3340 (with 200 points profit), as the pair found support at 1.3165 and has rebounded, a doji star was formed on the daily chart, suggesting consolidation above this level would be seen and test of the Tenkan-Sen (now at 1.3354) cannot be ruled out, however, reckon upside would be limited to 1.3400 and bring another decline later. Above previous support at 1.3425-30 would defer and suggest a temporary low is formed instead, risk test of the Kijun-Sen 9now at 1.3468) but a daily close above there is needed to add credence to this view, bring test of resistance at 1.3542 first.
Below said support at 1.3165 would signal the fall from 1.3794 top has once again resumed and extend weakness to 1.3100-10, however, break of support at 1.3056 is needed to retain bearishness and add credence to our view that recent entire rise from 1.2461 has ended at 1.3794 earlier, bring further fall to 1.3009 support which is likely to hold on first testing and oversold condition should keep price above 1.2969 (previous chart support).
Recommendation: Short position entered at 1.3540 met target at 1.3340 with 200 points profit and sell again at 1.3380 for 1.3180 with stop above 1.3480.

On the weekly chart, although this week’s anticipated selloff after breaking previous support at 1.3387 adds credence to our view that top has been formed at 1.3794 earlier, as the greenback found support at 1.3165 and has rebounded, suggesting consolidation above this level would be seen initially and recovery to 1.3340-50 cannot be ruled out, however, said previous support should turn into resistance and limit upside, bring another decline later. Below said support at 1.3165 would extend the fall from 1.3794 top to 1.3080-85 and later towards 1.3000-10, however, near term oversold condition should limit downside to previous chart support at 1.2969, bring rebound later.
On the upside, although initial recovery to 1.3380-85 cannot be ruled out, reckon upside would be limited to 1.3425-30 and bring another decline. Only a weekly close above the Tenkan-Sen (now at 1.3480) would defer and suggest first leg of decline from 1.3794 top has ended, risk a stronger rebound towards 1.3547 resistance but still reckon upside would be limited to 1.3600-10, bring another decline. Above 1.3635-40 would defer and risk a stronger rebound to 1.3690-00 but still reckon upside would be limited and price should falter well below said resistance at 1.3794, bring another decline.

Daily Technical Outlook And Review: EUR/USD, GBP/USD, AUD/USD, USD/JPY, USD/CAD, USD/CHF, DOW 30, GOLD
A note on lower timeframe confirming price action...
Waiting for lower timeframe confirmation is our main tool to confirm strength within higher timeframe zones, and has really been the key to our trading success. It takes a little time to understand the subtle nuances, however, as each trade is never the same, but once you master the rhythm so to speak, you will be saved from countless unnecessary losing trades. The following is a list of what we look for:
- A break/retest of supply or demand dependent on which way you're trading.
- A trendline break/retest.
- Buying/selling tails ... essentially we look for a cluster of very obvious spikes off of lower timeframe support and resistance levels within the higher timeframe zone.
- Candlestick patterns. We tend to only stick with pin bars and engulfing bars as these have proven to be the most effective.
We typically search for lower-timeframe confirmation between the M15 and H1 timeframes, since most of our higher-timeframe areas begin with the H4. Stops are usually placed 1-3 pips beyond confirming structures.
EUR/USD
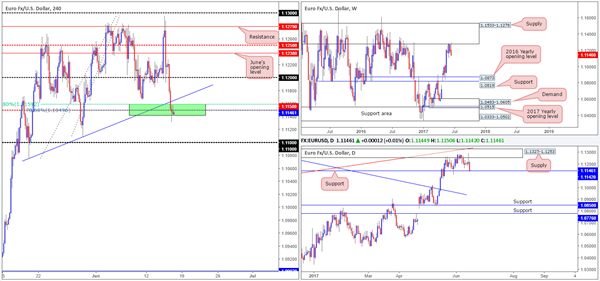
Across the board yesterday, we saw the US dollar advance for a second consecutive day, consequently forcing the dollar index to cross swords with H4 resistance at 97.47. As a result of this, the EUR also ran through the 1.12 handle and ended the day closing marginally below the H4 mid-level support at 1.1150.
For those who read Thursday’s report you may recall that we showed interest in buying from 1.1150 should a reasonably sized H4 bull candle (preferably a full-bodied candle) take shape. This is due to the following converging structures:
- A H4 trendline support etched from the low 1.1075.
- A H4 61.8% Fib support at 1.1159 drawn from the low 1.1074.
- A H4 78.6% retracement level pegged at 1.1149 penciled in from the low 1.1109.
- A daily support level seen at 1.1142.
As you can see though, H4 price has yet to print any noteworthy bullish intent, so we’re still watching this area as we write. Ideally, we’d like to see H4 price pop back above the aforementioned H4 trendline here.
Our suggestions: Basically, the reason for requiring additional H4 confluence around the 1.1150 neighborhood is due to the weekly sellers showing strength from the underside of a major supply coming in at 1.1533-1.1278!
Data points to consider: EUR Final CPI y/y at 10am. US Housing data at 1.30pm, US Prelim UoM consumer sentiment at 3pm, FOMC member Kaplan speaks at 5.45pm GMT+1.
Levels to watch/live orders:
- Buys: 1.1150 region ([waiting for a reasonably sized H4 bull candle – preferably a full-bodied candle – to form before pulling the trigger is advised] stop loss: ideally beyond the candle’s tail).
- Sells: Flat (stop loss: N/A).
GBP/USD
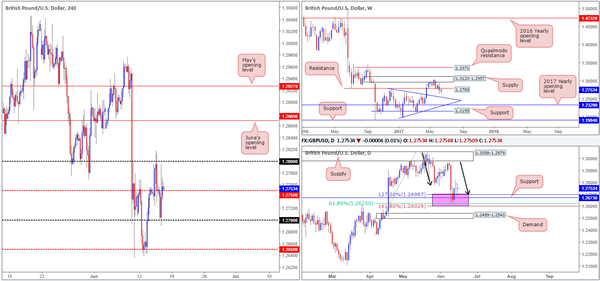
In spite of the GBP/USD ranging over 100 pips yesterday, the pair, once again, ended the day with little change. Looking over to the daily chart, this caused the unit to form a clear-cut indecision candle. Indecision is not really something one want’s to see when price recently bounced from, what we’d consider, a daily buy zone: 1.2602/1.2698 (a daily area marked in pink). This zone is comprised of a daily support level coming in at 1.2673, a daily 61.8% Fib support at 1.2625 (taken from the low 1.2365) and a daily AB=CD (black arrows) 127.2/161.8% ext. completion point seen at 1.2602/1.2698 (drawn from the high 1.3047).
While the H4 candles appear to be trying to establish a support around the mid-level number 1.2750, let’s keep in mind that weekly price recently tagged the underside of resistance pegged at 1.2789. With this level having provided both support and resistance since mid-2016, this is not a barrier one should overlook.
Our suggestions: A difference of opinion is clearly being seen on the higher timeframes (see above). And, as we said in Thursday’s report, judging direction can be tricky in situations like this. For that reason, our team has concluded that remaining on the sidelines for the time being is probably the best position to adopt.
Data points to consider: US Housing data at 1.30pm, US Prelim UoM consumer sentiment at 3pm, FOMC member Kaplan speaks at 5.45pm GMT+1.
Levels to watch/live orders:
- Buys: Flat (stop loss: N/A).
- Sells: Flat (stop loss: N/A).
AUD/USD
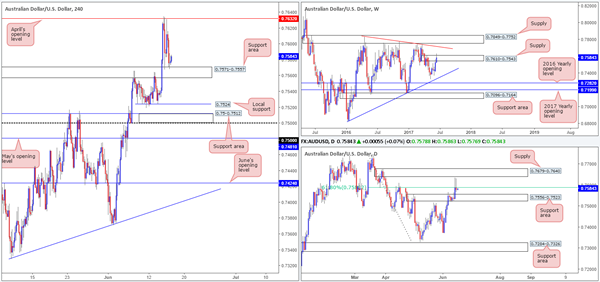
H4 action, as you can see, appears to be chiseling out a consolidation between April’s opening level at 0.7632 and the H4 support area coming in at 0.7571-0.7557. With no top-tier Aussie data on the docket today, the pair could potentially remain within this range into the week’s end. Technically speaking, however, we could eventually see the commodity currency turn lower.
Our reasoning lies within the higher-timeframe structure. On the weekly timeframe, the unit recently pierced above supply coming in at 0.7610-0.7543, likely filling a huge amount of buy stops in the process. Looking down to the daily candles, nonetheless, price managed to hold below the 61.8% Fib resistance at 0.7588 taken from the high 0.7747 for a second consecutive day, despite chalking in yet another aggressive whipsaw wick that almost tagged the underside of supply seen at 0.7679-0.7640.
Our suggestions: Traders may have also noticed that directly below the daily Fib level sits a daily support area coming in at 0.7556-0.7523. Therefore, although the higher-timeframes indicate that the bears may still have a hand in this fight, downside potential could be limited. And so, even if H4 price closes below the current H4 support area, there is little space for price to run as the top edge of the said daily support zone sits just 1 pip below this area! Given that, we’ll remain flat today and look to reassess structure going into Monday’s open.
Data points to consider: US Housing data at 1.30pm, US Prelim UoM consumer sentiment at 3pm, FOMC member Kaplan speaks at 5.45pm GMT+1.
Levels to watch/live orders:
- Buys: Flat (stop loss: N/A).
- Sells: Flat (stop loss: N/A).
USD/JPY:
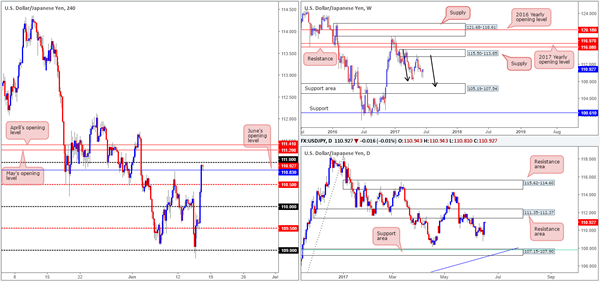
Weekly bears continue to remain in a relatively strong position after pushing aggressively lower from supply registered at 115.50-113.85. We know there’s a fair bit of ground to cover here, but this move could possibly result in further downside taking shape in the form of a weekly AB=CD correction (see black arrows) that terminates within a weekly support area marked at 105.19-107.54 (stretches all the way back to early 2014). Down on the daily chart, we can see that price is within striking distance of a resistance area drawn from 111.35-112.37. This base has been in play since the end of November 2016, so a bounce, at the very least, is expected to take form here.
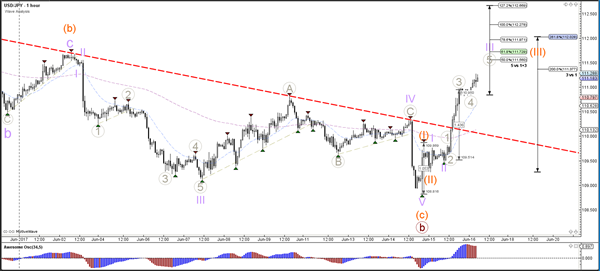
Looking across to the H4 chart, the mid-level barrier 109.50 managed to hold firm yesterday and attracted fresh buyers into the market just ahead of London’s lunchtime. Consequent to this, a number of resistances were taken out with H4 price now seen trading between the 111 handle and June’s opening level at 110.83.
Our suggestions: Based on the above notes, our team has their eye on April/May’s opening levels seen above current price at 111.41/111.29. This is simply because these levels are collectively positioned nicely around the underside of the said daily resistance area! Given that 111.41/111.29 is rather small, nonetheless, we would advise waiting for lower-timeframe confirmation (see the top of this report) before pulling the trigger. This will help avoid any fakeout seen here.
Data points to consider: US Housing data at 1.30pm, US Prelim UoM consumer sentiment at 3pm, FOMC member Kaplan speaks at 5.45pm. BoJ Monetary policy statement and press conference at 7.30am GMT+1.
Levels to watch/live orders:
- Buys: Flat (stop loss: N/A).
- Sells: 111.41/111.29 ([waiting for lower-timeframe confirming action to form before pulling the trigger is advised] stop loss: dependent on where one confirms this area).
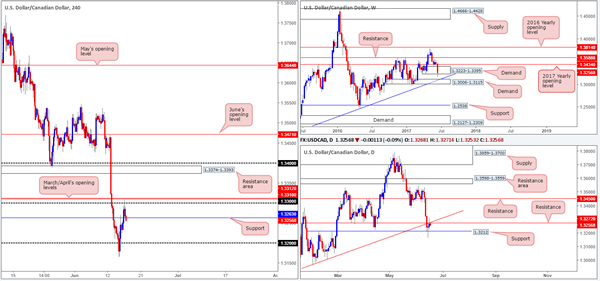
USD/CAD
Although the USD/CAD bounced from daily support at 1.3212 on Wednesday, the bulls have struggled to muster enough strength to breach the daily resistance at 1.3272, which happens to converge with a daily trendline resistance extended from the low 1.2968. On a more positive note, weekly action remains trading around the lower edge of demand at 1.3223-1.3395, despite a whipsaw below this base taking place earlier on in the week.
A closer look at price action on the H4 chart shows that the unit recently whipsawed above the 1.33 handle, and came within a cat’s whisker of clipping March/April’s opening levels at 1.3312/1.3310. Managing to hold firm from here, the loonie is currently trading back below support registered at 1.3263, which could now potentially act as resistance going forward.
Our suggestions: Given the uncertainty surrounding the weekly demand area, and daily price showing that the bears may have the upper hand at the moment, we may consider shorting should a H4 close print below the current H4 support level, targeting the 1.32 neighborhood.
A H4 close below 1.3263 followed up with a retest and a reasonably sized bearish candle (preferably a full-bodied candle) would, in our opinion, be enough evidence to validate the short.
Data points to consider: US Housing data at 1.30pm, US Prelim
Levels to watch/live orders:
- Buys: Flat (Stop loss: N/A).
- Sells: Watch for H4 price to engulf 1.3263 and then look to trade any retest seen thereafter ([waiting for a reasonably sized H4 bearish candle to form before pulling the trigger is advised] stop loss: ideally beyond the candle’s wick).
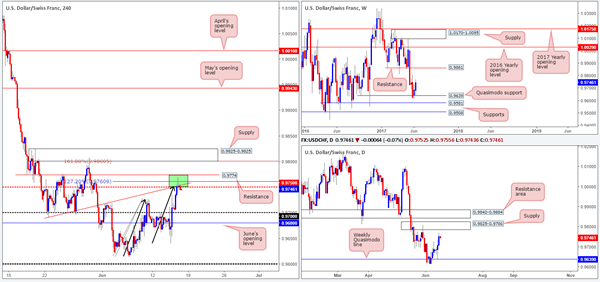
USD/CHF
While the H4 green area at 0.9774/0.9750 could potentially hold prices lower today, there’s also a chance that H4 price may extend up to supply coming in at 0.9825-0.9801.
0.9774/0.9750 is comprised of a H4 resistance level at 0.9774, a H4 AB=CD 127.2% ext. at 0.9760 taken from the low 0.9613, a H4 trendline resistance etched from the low 0.9691 and a H4 mid-level resistance drawn from 0.9750. The H4 supply above, however, houses a H4 AB=CD 161.8% ext. at 0.98 taken from the low 0.9613 and the round number 0.98.
The interesting thing here is the lower (green) H4 area has no higher-timeframe convergence, whereas the H4 supply positioned above is located around the upper edge of daily supply marked at 0.9825-0.9786.
Our suggestions: In light of the above notes, our desk has decided to hold fire and wait and see if H4 price can extend up to supply seen at 0.9825-0.9801. Should price strike this area today, we would, dependent on the time of day, look to sell from here at market, with stops sited at 0.9827, targeting 0.9750 as an initial take-profit zone.
Data points to consider: US Housing data at 1.30pm, US Prelim UoM consumer sentiment at 3pm, FOMC member Kaplan speaks at 5.45pm GMT+1.
Levels to watch/live orders:
- Buys: Flat (stop loss: N/A).
- Sells: 0.98 (stop loss: 0.9827).
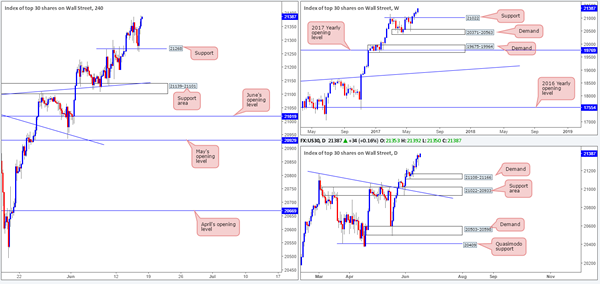
DOW 30:
As can be seen from the H4 chart, US equities retested 21268 as support and recently clocked a fresh record high of 21392.
For those who have been following our reports over the past few days you may recall that our desk had recently taken a small long position at 21164 and initially placed stops below the H4 support area (21139-21101) at 21097. The position is still active, but we have liquidated 50% of the trade around the 21234 neighborhood.
Fortunately, the index has continued to push higher, as we are now looking to trail this market with the remainder of our position. The stop-loss order has been moved to 21247, a few points below the current H4 support, putting our overall gain into respectable numbers.
In Thursday’s report, we also noted to watch for possible long opportunities from 21268 should a reasonably sized H4 bull candle take shape from here. As you can see, this did occur, so well done to any of our readers who jumped on board here!
Our suggestions: Personally, we are looking for price to continue rallying into the week’s end, as we intend on trailing this trend long term.
Data points to consider: US Housing data at 1.30pm, US Prelim UoM consumer sentiment at 3pm, FOMC member Kaplan speaks at 5.45pm GMT+1.
Levels to watch/live orders:
- Buys: 21164 ([live] stop loss: 21247).
- Sells: Flat (stop loss: N/A).
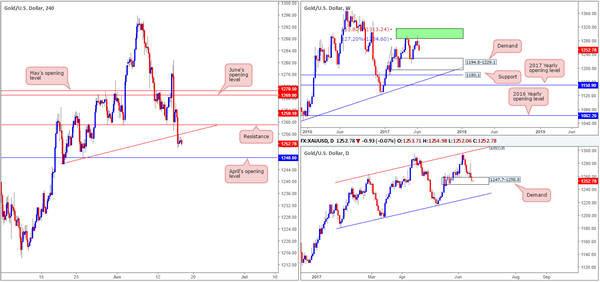
GOLD:
Gold prices continued to decline in value yesterday as the dollar remained in a bullish stance. As can be seen from the weekly timeframe, the bears continue to hold this market lower after connecting with an area comprised of two weekly Fibonacci extensions 161.8/127.2% at 1313.7/1285.2 taken from the low 1188.1 (green zone). From this scale, there’s room for the precious metal to continue pumping lower until we reach the demand base coming in at 1194.8-1229.1.
Daily price is still seen teasing the demand base coming in at 1247.7-1258.8, but looks vulnerable. Pressure from weekly sellers could see this area consumed, which in turn would likely bring the candles down to the channel support taken from the low 1180.4 (intersects with the above said weekly demand base).
Over on the H4 candles, the unit broke below the trendline support etched from the low 1249.3 and retested the barrier as resistance. The next level of interest below is April’s opening level at 1248.0.
Our suggestions: Buying from within the current daily demand or from April’s opening level is not something we’d feel comfortable with given the position of weekly price at the moment. And likewise, selling, although you’d be trading in line with weekly flow, is not advisable given the daily demand and April’s monthly opening level in view.
With that being the case, for us personally, we’re going to continue taking the side of caution and remain on the sidelines for the time being.
Levels to watch/live orders:
- Buys: Flat (stop loss: N/A).
- Sells: Flat (stop loss: N/A).
Daily Technical Analysis: USD/JPY Reversal At 88.6% Fib Plus Major Bullish Break
Currency pair USD/JPY
The USD/JPY has strongly bounced at the 88.6% Fibonacci level of wave B (brown) and price managed to break above the resistance trend line (red) as well. Price has most likely completed wave B (brown) and is building bullish momentum (orange 3) within wave C (brown).
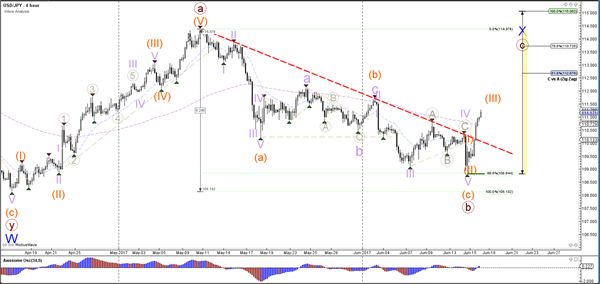
The USD/JPY broke above resistance (dotted red) and could be building a wave 3 (purple) within a wave 3 (orange).
Currency pair EUR/USD
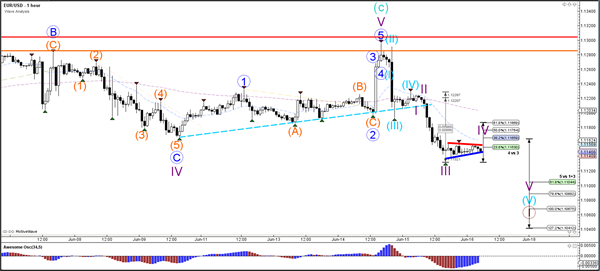
The EUR/USD is still trapped in between strong support (blue) and resistance (red) and would need to break these levels before a potential trend could start.
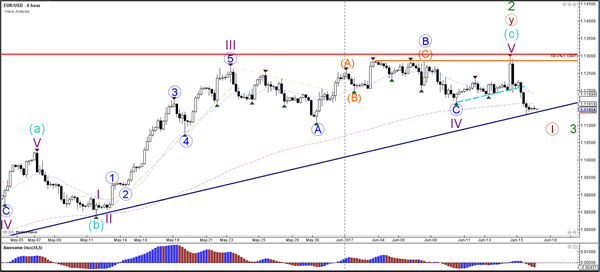
The EUR/USD indeed completed a wave 4 (blue) and broke below the trend line support (dotted blue). The bearish momentum is most likely a wave 3 (purple) and the triangle (red/blue) could be part of the wave 4 (purple). The potential 5th wave (purple) would most likely complete wave 1 (brown).
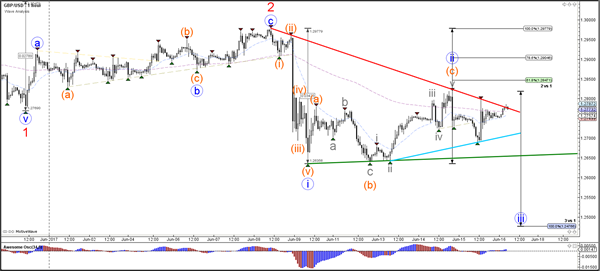
Currency pair GBP/USD
The GBP/USD stopped at the 50% Fibonacci level of wave 2 (blue) after completing an ABC zigzag (orange). A bearish breakout below support (blue) could confirm wave 3 (red) whereas the wave 2 of the GBP/USD is invalidated if price breaks above the 100% Fibonacci level of wave 2 (red).
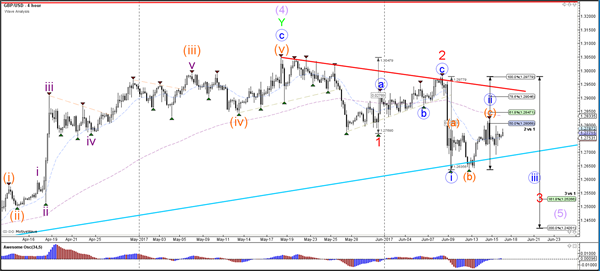
The GBP/USD needs to break below support (blue/green) to confirm a potential wave 3 (blue). The Fibonacci levels of wave 2 (blue) could act as resistance.
European Open Briefing: The Bank Of Japan Left Rates
Global Markets:
- Asian stock markets: Nikkei up 0.80 %, Shanghai Composite fell 0.25 %, Hang Seng rose 0.50 %, ASX 200 gained 0.20 %
- Commodities: Gold at $1255 (+0.05 %), Silver at $16.70 (-0.10 %), WTI Oil at $44.50 (+0.05 %), Brent Oil at $46.95 (+0.05 %)
- Rates: US 10-year yield at 2.17, UK 10-year yield at 1.04, German 10-year yield at 0.29
News & Data
- Bank of Japan Interest Rate -0.10 % vs -0.10 % expected
- New Zealand Business NZ PMI 58.5 vs 56.8 previous
- Asia stocks steady after Wall St tech rout, dollar holds gains – RTRS
- BOJ holds policy steady, upgrades view on consumption, global growth – RTRS
- Dollar firms on upbeat data, on track for weekly gains – RTRS
- Oil sits near half-year lows as global supply overhang weighs – RTRS
Markets Update:
The Bank of Japan left rates and their QE programme unchanged, as expected. Traders are now waiting for the BoJ press conference. There has been speculation that BoJ Governor Kuroda could discuss a QE exit plan. This could give the Yen a boost. If Kuroda does not mention it at all, USD/JPY is likely to extend gains to 112 soon.
The US Dollar strengthened slightly against most major currencies. Gains against the Pound were limited though. The Bank of England meeting surprised traders, with only 5 of the 8 MPC members voting to keep rates unchanged. Inflation continues to rise, and so does the pressure on the central bank. The key level to watch in GBP/USD is 1.2830. A clear break above it would signal a recovery for the Pound.
The Euro fell to 1.1130 yesterday, but remains well bid overall. However, a break below 1.11 support would signal that further losses are ahead.
AUD/USD consolidated in a 0.7575-0.76 range overnight. The broad Dollar strength has slowed momentum, but the charts suggest that the AUD/USD could rise towards 0.77 in the near-term.
Upcoming Events:
- 10:00 BST – Euro Zone CPI
- 13:30 BST – US Housing Starts
- 13:30 BST – US Building Permits
- 15:00 BST – US Michigan Consumer Sentiment