
Sample Category Title
EUR/GBP Elliott Wave Analysis
EUR/GBP – 0.8679
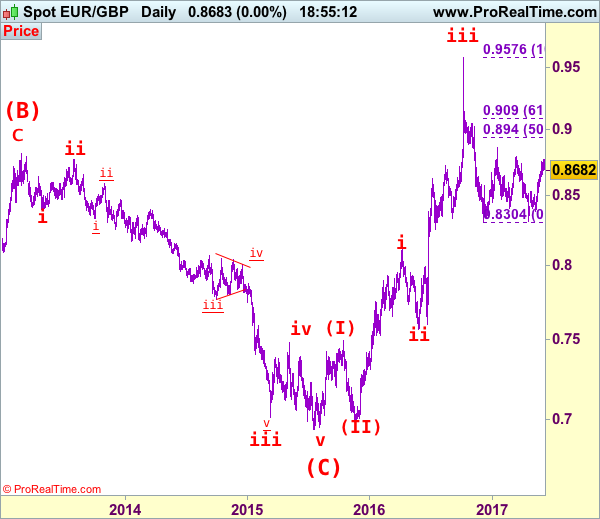
EUR/GBP – The major (A)(B)(C)-(X)-(A)(B)(C) correction from 0.9805 is unfolding and 2nd (A) has possibly ended at 0.6936.
As the single currency has finally retreated after rising to 0.8771 earlier this week, suggesting minor consolidation below this level would be seen and pullback to 0.8650, then 0.8600-10 cannot be rule out, however, reckon 0.8570-75 would limit downside and bring another rise later, above said resistance at 0.8771 would signal another leg of corrective rise from 0.8312 low is underway for gain to 0.8788 resistance, having said that, as broad outlook remains consolidative, reckon upside would be limited to another previous resistance at 0.8857.
Our latest preferred count is that the wave V of a 5-wave series from 0.5682 ended at 0.9805 earlier and major from there has possibly ended at 0.8067 as A-B-C-X-A-B-C. We are keeping our view that the entire correction from 0.9805 has possibly ended at 0.7756 and as labeled as the attached daily chart and impulsive move from 0.9084 has ended at 0.7756 as a 5-waver which marked either the (C) wave or the A leg of (C), a daily close above resistance at 0.8831 would suggest (C) leg has ended and headway towards 0.9084.
On the downside, whilst initial pullback to 0.8600-05 cannot be rule out, reckon 0.8565-70 would limit downside and bring another rise later. Below support at 0.8524 would suggest top is possibly formed instead, risk weakness to 0.8500-05 but only break of 0.8455-60 would confirm and suggest the rebound from 0.8312 has ended, bring further fall towards indicated key support at 0.8384.
Recommendation: Buy at 0.8570 for 0.8720 with stop below 0.8500
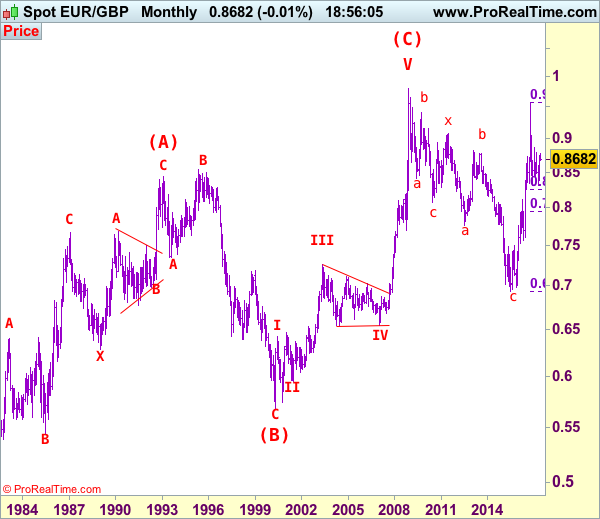
Euro's long term uptrend started in Feb 1981 at 0.5039 and is unfolding as a (A)-(B)-(C) move with (A): 0.8433 (Feb 1993), (B): 0.5682 (May 2000) and impulsive wave (C) should have ended at 0.9805 with wave III ended at 0.7254 (May 2003), triangle wave IV at 0.6536 (23 Jan 2007) and wave V as well as wave (C) has ended at 0.9805.
We are keeping an alternate count that only wave III ended at 0.9805 and the correction from there is the wave IV and may extend weakness to 0.7700, however, it is necessary to see a daily close above resistance at 0.9143 would change this to be the preferred count.
Technical Outlook: AUDUSD Remains Steady Despite Downbeat Australian Data
The Australian dollar remains steady against the greenback on Thursday and holding near previous day's fresh recovery high at 0.7566, showing no stronger negative impact on downbeat Australian trade data.
Australian trade surplus narrowed to 0.56 billion in April, falling well below the forecast at 1.91 billion and 3.11 million AUD surplus in March.
The pair is holding within daily cloud, with cloud base offering solid support at 0.7525, reinforced by 200SMA, where today's dips were contained.
However, gains remain capped by 100SMA (0.7556) which was briefly dented on Wednesday.
Overall bullish structure suggests further upside, however, bulls could be delayed for correction on strongly overbought slow stochastic on daily chart.
Extended pullback should be ideally contained at 0.7500 zone (55SMA/Fibo 38.2% of 0.7369/0.7566 upleg) to keep bullish structure intact and avert deeper correction, as the pair is on track for strong weekly bullish close.
Res: 0.7556, 0.7585, 0.7610, 0.7664
Sup: 0.7527, 0.7500, 0.7468, 0.7447
USD/CAD Elliott Wave Analysis
USD/CAD – 1.3510
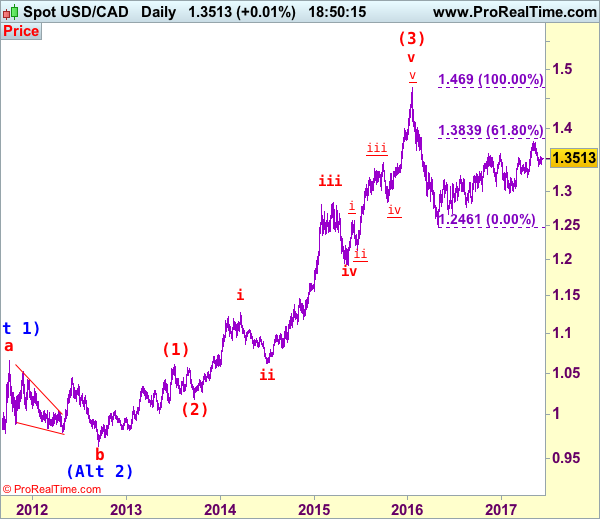
USD/CAD – Wave v ended at 0.9407 and a-b-c correction may extend gain to 1.4700
Although the greenback did meet selling interest at 1.3547 and retreated (we recommended in our previous update to sell at 1.3530 and a short position was entered), as the pair found support at 1.3426 yesterday and has rebounded again, suggesting further consolidation above lsat month’s low at 1.3387 would be seen and another bounce to said resistance at 1.3547 cannot be ruled out, however, still reckon 1.3590-00 would cap upside and bring another decline later. Below 1.3426 support would signal decline from 1.3794 top has resumed for retest of 1.3387, break there would extend weakness to 1.3320-30, then towards support at 1.3262 but reckon key support at 1.3223 would hold from here, bring rebound later. Looking ahead, only a daily close below this level would provide confirmation that recent upmove has ended at 1.3794, bring further subsequent decline to 1.3140-50 and then 1.3090-00.
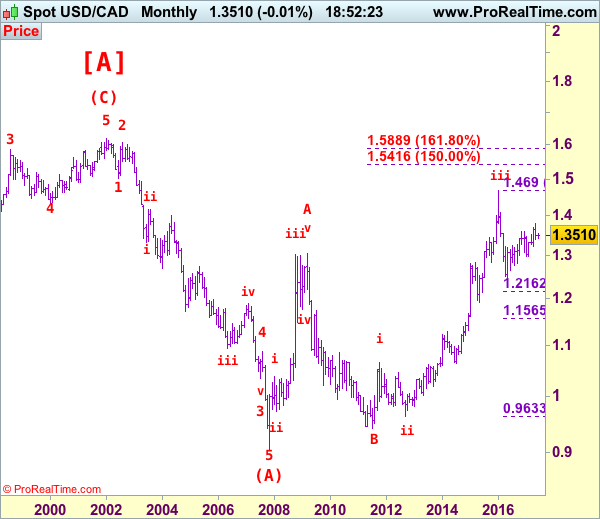
We are keeping our view that the wave b from 1.0657 (a leg top) has possibly ended at 0.9633 with (a): 0.9800, wave (b): 1.0447 and wave c at 0.9633, the subsequent rise from there is now treated as wave c exceeded indicated upside target at 1.3770-80 and 1.4000 and wave (3) has possibly ended at 1.4690 and wave (4) correction has commenced for retracement back to 1.2832 support, then 1.2410-20.
On the daily chart, our latest preferred count remains that the A of (B) rally from 0.9059 low (7 Nov 2007) unfolded into an impulsive wave with i: 0.9059-1.0380, ii ended at 0.9819, iii at 1.3019 followed by triangle wave iv at 1.2026 , then wave v formed a top at 1.3066 and also ended the wave A. The wave B is unfolding as an double three a-b-c-x-a-b-c and is sub-divided as a: 1.2192, b: 1.2716 and wave c at 1.0784, followed by wave x at 1.1725, another set of a-b-c unfolded with 2nd a at 0.9931, 2nd b at 1.0674. the 2nd c has possibly ended at 0.9407, therefore, consolidation with upside bias is seen for major correction, indicated target at 1.3900 had been met and gain to 1.4700 would follow.
On the upside, whilst initial recovery to 1.3547 cannot be ruled out, reckon upside would be limited to previous support at 1.3571 and bring another decline later. A daily close above previous support at 1.3571 would suggest the first leg of decline from 1.3794 has ended, bring a stronger rebound to 1.3610-15 and possibly towards resistance at 1.3670, price should falter well below said resistance at 1.3794, bring another decline later.
Recommendation: Hold short entered at 1.3530 for 1.3330 with stop above 1.3630.
Longer term - The selloff from 1.6194 (21 Jan 2002) to 0.9059 (07 Nov 2007) is viewed as (A) wave which is a 5-waver as labeled on the monthly chart as below, the subsequently rally is labeled as (B) with impulsive A leg of (B) ended at 1.3066, wave B of (B) is unfolding which has either ended at 0.9407 or would extend one more fall but downside should be limited to 0.9200 and 0.9000 should hold.
Gold Ready To Break $1300, Silver Testing 61.8% Fibonacci Retracement, Crude Oil Continued Decline.
Gold Ready to break $1300.
Gold is pushing higher within uptrend channel. Hourly support is located at 1246 (18/05/2017 low). Stronger support is given at 1195 (10/03/2017 low). Expected to show further upside pressures.
In the long-term, the technical structure suggests that there is a growing upside momentum. A break of 1392 (17/03/2014) is necessary ton confirm it, A major support can be found at 1045 (05/02/2010 low).
Silver Testing 61.8% Fibonacci retracement.
Silver declines. Strong support is given at 15.63 (20/12/2017 low). Closest support is given at 16.20 (04/05/2017 low). Key resistance is given at a distance at 19.00 (09/11/2017 high). Expected to push back towards 61.8% Fibonacci retracement around 17.75.
In the long-term, the death cross indicates that further downsides are very likely. Resistance is located at 25.11 (28/08/2013 high). Strong support can be found at 11.75 (20/04/2009).
Crude oil Continued decline.
Crude oil keeps on moving lower after the recent collapse from $52. Support is given at a distance 43.76 (05/05/2017 low). The technical structure suggests further weakness towards 43.76.
In the long-term, crude oil has recovered after its sharp decline last year. However, we consider that further weakness are very likely. Strong support lies at 24.82 (13/11/2002) while resistance can now be found at 55.24 (03/01/2017 high)
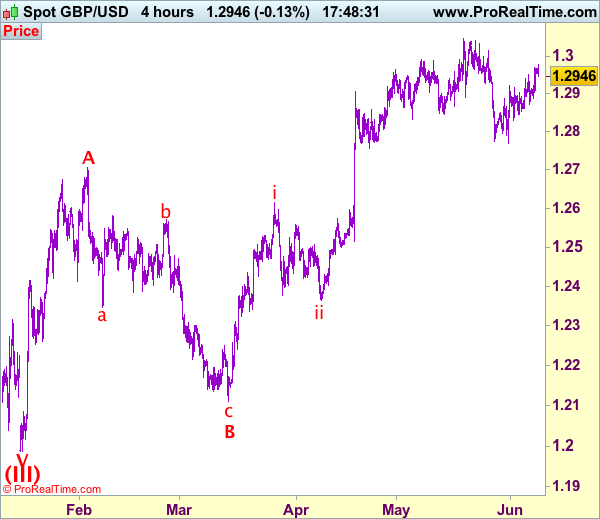
Trade Idea: GBP/USD – Stand aside
GBP/USD – 1.2943
Recent wave: Wave V of larger degree wave (III) has ended at 1.1986 and major correction has commenced from there for gain to 1.3000 and 1.3140-50
Trend: Near term up
New strategy :
Stand aside
Position: -
Target: -
Stop:-
The British pound edged higher after brief pullback and gain towards 1.3000 cannot be ruled out, however, reckon resistance at 1.3015 would hold, bring retreat later. Only break of 1.3015 would signal upmove has resumed for retest of 1.3048 resistance break there would confirm and extend headway to 1.3075-80, then 1.3100-10 later.
Our preferred count on the daily chart is that cable's rebound from 1.3500 (wave (A) trough) is unfolding as a wave (B) with A ended at 1.7043, followed by triangle wave B and wave C as well as wave (B) has ended at 1.7192, the subsequent selloff is the larger degree wave (C) which is still unfolding with minor wave (III) of larger degree wave 3 ended at 1.1986, hence wave (IV) correction is in progress which could either be a triangle wave (IV) of a complex formation but upside should be limited to 1.3500 and price should falter well below 1.4000, bring another decline in wave (V) of 3 for weakness to 1.1500, then 1.1200.
On the downside, whilst pullback to 1.2900 cannot be ruled out, break of 1.2870-75 is needed to signal top is possibly formed, bring weakness to 1.2850 but break of indicated key support at 1.2830 is needed to revive bearishness and signal the rebound from 1.2769 low has ended, bring further fall to 1.2800 first.
EUR/JPY Monitoring Support At 122.56, EUR/GBP Ready For Another Leg Lower, EUR/CHF Continued Weakness.
EUR/JPY Monitoring support at 122.56.
EUR/JPY is trading lower. Hourly support is given at 122.56 (18/05/2017 low). Hourly resistance can be found at 125.82 (16/05/2017 high). Major support is given at 114.90 (18/04/2017low).
In the longer term, the technical structure validates a medium-term succession of lower highs and lower lows. As a result, the resistance at 149.78 (08/12/2014 high) has likely marked the end of the rise that started in July 2012. Strong support at 94.12 (24/07/2012 low) looks nonetheless far away.
EUR/GBP Ready for another leg lower.
EUR/GBP's bullish momentum has faded around resistance at 0.8787 (13/03/2017 high). The pair is now going lower. Strong support can be found at 0.8304 (05/12/2017 low).
In the long-term, the pair has largely recovered from recent lows in 2015. The technical structure suggests a growing upside momentum. The pair is trading above from its 200 DMA. Strong resistance can be found at 0.9500 psychological level.
EUR/CHF Continued weakness.
EUR/CHF is trading lower. The pair has broken support given at 1.0866 (18/05/2017 low). We believe that the medium-term pattern suggests us to see continued bearish pressures towards hourly support that can be found at 1.0792 (03/05/2017 low).
In the longer term, the technical structure is mixed. Resistance can be found at 1.1200 (04/02/2015 high). Yet,the ECB's QE programme is likely to cause persistent selling pressures on the euro, which should weigh on EUR/CHF. Supports can be found at 1.0184 (28/01/2015 low) and 1.0082 (27/01/2015 low).
USD/CHF Heading Lower, USD/CAD Sideways Price Action, AUD/USD Strengthening.
USD/CHF Heading lower.
USD/CHF continues its decline below support given at 0.9692 (22/05/2017 low). Strong resistance is given at 1.0107 (10/04/2017 high). Expected to show continued weakness towards stronger support at 0.9550 (09/11/2017 low).
In the long-term, the pair is still trading in range since 2011 despite some turmoil when the SNB unpegged the CHF. Key support can be found 0.8986 (30/01/2015 low). The technical structure favours nonetheless a long term bullish bias since the unpeg in January 2015
USD/CAD Sideways price action.
USD/CAD is trading below 1.3500. The pair has exited short-term uptrend channel. Hourly support can be found at 1.3424 (28/05/2017 low) then 1.3388 (25/01/2017 high). Expected to show continued very short-term bearish pressures.
In the longer term, there is now a death cross with the 50 dma crossing below the 200 dma indicating further downside pressures. Strong resistance is given at 1.4690 (22/01/2016 high). Long-term support can be found at 1.2461 (16/03/2015 low).
AUD/USD Strengthening.
AUD/USD is pushing higher since the pair has failed to reach hourly support given at 0.7329 (09/05/2017 low). As long as prices remain below resistance at 0.7608 (17/04/2017 high), there are nonetheless strong downside risks.
In the long-term, we are waiting for further signs that the current downtrend is ending. Key supports stand at 0.6009 (31/10/2008 low) . A break of the key resistance at 0.8295 (15/01/2015 high) is needed to invalidate our long-term bearish view.
EUR/USD Stalling Below 1.1300, GBP/USD Short-Term Bullish, USD/JPY Bearish Pressures Under 110
EUR/USD Stalling below 1.1300
EUR/USD is consolidating below strong resistance given at 1.1300 (09/11/2017 high). Hourly support is given at 1.1110 (22/05/2017 low) has been broken. Stronger support lies at 1.0842 (11/05/2017 low) and key support is given at 1.0494 (22/02/2017 low). Expected to show continued bullish pressures.
In the longer term, the death cross late October indicated a further bearish bias. The pair has broken key support given at 1.0458 (16/03/2015 low). Key resistance holds at 1.1714 (24/08/2015 high). Expected to head towards parity.
GBP/USD Short-term bullish
GBP/USD keeps on bouncing from hourly support given at 1.2757 (21/04/2017 low). Hourly resistance lies at 1.3046 (18/05/2017 high). Expected to show continued bullish pressures.
The long-term technical pattern is even more negative since the Brexit vote has paved the way for further decline. Long-term support given at 1.0520 (01/03/85) represents a decent target. Long-term resistance is given at 1.5018 (24/06/2015) and would indicate a long-term reversal in the negative trend. Yet, it is very unlikely at the moment.
USD/JPY Bearish pressures under 110
USD/JPY is trading lower. The road seems wide open towards strong support located at 108.13 (17/04/2017 low). Hourly resistance is given at 112.13 (24/05/2017 high). Other key supports lie at a distance 106.04 (11/11/2016 low).
We favor a long-term bearish bias. Support is now given at 96.57 (10/08/2013 low). A gradual rise towards the major resistance at 135.15 (01/02/2002 high) seems absolutely unlikely. Expected to decline further support at 93.79 (13/06/2013 low).
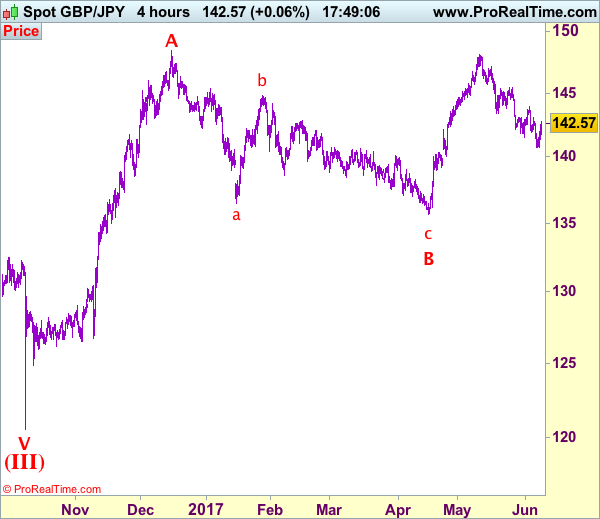
Trade Idea: GBP/JPY – Stand aside
GBP/JPY - 142.40
Recent wave: Medium term low formed at 120.50 and (A)-(B)-(C) major correction has commenced with (A) leg ended at 148.45, hence wave (B) is unfolding for retreat to 131.00-10.
Trend: Near term up
New strategy :
Stand aside
Position: -
Target: -
Stop:-
Sterling’s rebound from 140.75 turned out to be stronger than expected, suggesting consolidation above this level would be seen and test of resistance at 143.10 cannot be ruled out, however, break there is needed to signal low has been formed there, bring retracement of recent decline towards resistance at 143.95-00 which is likely to hold from here.
On the downside, expect pullback to be limited to 141.50-60 and price should stay above 141.00, bring another rebound later. Below 141.00 would bring retest of 140.75 but break there is needed to signal recent decline has resumed and extend weakness to 140.50, then towards psychological support at 140.00, however, oversold condition should prevent sharp fall below previous support at 139.20, risk from there has increased for a rebound later.
Our preferred count is that larger degree wave V with circle is unfolding from 251.12 with wave (I) 219.34, (II): 241.38 and wave (III) is subdivided into 1: 192.60, 2: 215.89 (23 Jul 2008) and wave 3 ended at 118.87 earlier in 2009. The correction from there to 162.60 is wave 4 which itself is a double three and is labeled as first a-b-c ended at 151.53, followed by wave x at 139.03, 2nd a ended at 162.60, 2nd b at 146.75 and 2nd c leg of wave 4 ended at 163.00. Therefore, the decline from 163.00 to 116.85 is now treated as wave 5 which also marked the end of larger degree wave (III), hence wave (IV) major correction has commenced for retracement of the wave (III) from 241.38 and upside target at 183.95-00 (50% Fibonacci retracement of the wave (II) from 241.38) had been met, a drop below 160.00 would suggest wave (IV) has ended at 195.85, bring decline in wave (V) for initial weakness to 130 (already met) and 120.
Can Comey, UK Election And ECB Deliver On Super Thursday?
- Comey's text indicates nothing disastrous for Trump today, markets remain cautious;
- GBP and FTSE flat ahead of exit polls this evening;
- EUR edges lower as traders await ECB views on inflation and monetary policy outlook.
All eyes in the US will be on former FBI Director James Comey's hearing in front of the Senate Intelligence Committee today, with further issues for President Donald Trump seen as being possibly problematic when it comes to delivering on his growth policies.
Based on the text of Comey's prepared testimony on Wednesday, it would seem that markets aren't expecting anything too shocking, despite there being a reference to Trump urging him to drop the investigation into former National Security Advisor Michael Flynn. Still, close attention will be paid to the public part of the hearing and should anything very controversial appear, it could impact risk appetite in the markets.
Sterling and the FTSE 100 are both trading relatively flat on the day as traders await the first exit polls this evening. The election campaign has not exactly gone as Theresa May planned or markets expected, with the monumental lead that the Conservatives had over Labour having been slashed in recent weeks, to the point that a majority is now in doubt. Still, markets appear relatively confident that a majority will still be achieved despite poll results ranging from a large majority to none at all.
We've seen previously that these polls can be unreliable – in 2015 in favour of the Conservatives - but we've also seen the populist vote prevail in recent years as well. With polls being so varied, it seems in recent days that markets have largely shrugged them off and instead assumed that May will get her majority. The problem now is that with sterling trading at near nine-month highs against the dollar, having gradually rallied since the start of the month, it is vulnerable to a sharp decline if things don't go as planned. Should we see a hung parliament then things could get messy. While this may also be bad for FTSE initially, given the general knee jerk reaction that can often follow, the weaker pound may boost it in the medium term, as it did in the days after Brexit.
The euro is looking a little soft ahead of the ECB announcement. A leaked draft staff projections yesterday suggested that while the GDP forecast is expected to be raised, inflation is forecast to be lower than previously thought into 2019. While the euro reversed its losses prior to the close on Wednesday, the softness that we're seeing this morning may suggest that traders are preparing for a more dovish forecast. The question now is whether that changes the ECBs outlook for monetary policy and if we see any change in rhetoric today. That could be as simple as a slight amendment to the statement or as bold as suggesting that further adjustments to the bond buying program could be announced before December, when the current program expires.