
Sample Category Title
UK’s Mortgage Approvals Dipped To A 7-Month Low Level In April
For the 24 hours to 23:00 GMT, the GBP rose 0.52% against the USD and closed at 1.2873.
On the data front, number of mortgage approvals for house purchases in the UK unexpectedly eased to a level of 64.6K in April, hitting its lowest level in seven months, highlighting a slowdown in the nation's housing market. In the prior month, mortgage approvals had recorded a revised reading of 66.0K, while markets expected for a steady reading. Meanwhile, the nation's net consumer credit advanced £1.5 billion in April, meeting market expectations. In the previous month, net consumer credit had risen £1.6 billion.
In the Asian session, at GMT0300, the pair is trading at 1.2876, with the GBP trading marginally higher against the USD from yesterday's close.
The pair is expected to find support at 1.2790, and a fall through could take it to the next support level of 1.2703. The pair is expected to find its first resistance at 1.2942, and a rise through could take it to the next resistance level of 1.3007.
Going ahead, traders would look forward to Britain's Markit manufacturing PMI and Nationwide house prices, both for May, scheduled to release in a few hours.
The currency pair is trading above its 20 Hr and 50 Hr moving averages.

Japanese Manufacturing Sector Growth Revised Upwards To A 3-Month High Level In May
For the 24 hours to 23:00 GMT, the USD marginally declined against the JPY and closed at 110.79.
On the economic front, Japan’s small business confidence index climbed to a level of 48.9 in May, compared to a level of 48.6 in the previous month.
In the Asian session, at GMT0300, the pair is trading at 110.93, with the USD trading 0.13% higher from yesterday’s close.
Overnight data indicated that the nation’s final Nikkei manufacturing PMI was revised upwards to a level of 53.1 in May, notching its highest level in three months and compared to a fall to a level of 52.0 in the preliminary print and following a level of 52.7 in the previous month.
The pair is expected to find support at 110.54, and a fall through could take it to the next support level of 110.14. The pair is expected to find its first resistance at 111.28, and a rise through could take it to the next resistance level of 111.62.
Moving ahead, market participants will closely monitor Japan’s consumer confidence data for May, set to release tomorrow.
The currency pair is trading above its 20 Hr moving average and showing convergence with its 50 Hr moving average.

Swiss ZEW Economic Sentiment Index Advanced In May
For the 24 hours to 23:00 GMT, the USD declined 0.81% against the CHF and closed at 0.9679.
Macroeconomic data indicated that Switzerland’s ZEW economic expectations index registered a rise to a level of 30.8 in May, after recording a reading of 22.2 in the prior month. Further, the nation’s UBS consumption indicator rose to a level of 1.48 in April. In the previous month, UBS consumption indicator had recorded a revised reading of 1.44.
In the Asian session, at GMT0300, the pair is trading at 0.9683, with the USD trading a tad higher against the CHF from yesterday’s close.
The pair is expected to find support at 0.9648, and a fall through could take it to the next support level of 0.9614. The pair is expected to find its first resistance at 0.9739, and a rise through could take it to the next resistance level of 0.9796.
Ahead in the day, all eyes will be on Switzerland’s 1Q GDP numbers, retail sales for April and SVME–PMI for May.
The currency pair is trading below its 20 Hr and 50 Hr moving averages.

Canadian Economic Growth Accelerated In March
For the 24 hours to 23:00 GMT, the USD rose 0.21% against the CAD and closed at 1.3497.
On the data front, Canada gross domestic product (GDP) expanded more-than-estimated by 0.5% MoM in March, driven by higher consumer spending, thus suggesting that the economy has picked up steam. The GDP had registered a flat reading in the previous month, while market participants were expecting the GDP to climb 0.2%. Also, on a quarterly basis, the nation’s annualized GDP rose less-than-expected by 3.7% in the first quarter of 2017 and following a revised rise of 2.7% in the prior quarter.
In the Asian session, at GMT0300, the pair is trading at 1.3507, with the USD trading 0.07% higher against the CAD from yesterday’s close.
The pair is expected to find support at 1.3455, and a fall through could take it to the next support level of 1.3403. The pair is expected to find its first resistance at 1.3541, and a rise through could take it to the next resistance level of 1.3575.
Moving ahead, market participants will keep a close watch on Canada’s Markit manufacturing PMI for May, slated to release later today.
The currency pair is trading above its 20 Hr and 50 Hr moving averages.

GBP Remains Vulnerable Ahead Of Election Next Week
- GBP remains vulnerable to polls that show May’s lead deteriorating;
- Could EIA give oil a reason to reverse course this afternoon?
- Manufacturing PMIs, ADP Employment and more to come throughout the day.
European equity markets are expected to open on a positive note, with focus on Thursday remaining on the UK election, as well as the latest oil inventory data from EIA and a raft of other data from around the globe.
Sterling is likely to remain volatile over the next week as we approach the election on 8 June. Recent polls have shown that Theresa May’s lead has narrowed, in some cases quite considerably, which has sent the pound into a bit of a tailspin at times. The polls can be inconsistent at times though, as seen yesterday with the YouGov and Panelbase polls predicting very different outcomes, but the trend does appear to be one of May’s lead shortening. It may be worth remembering though that these same polls also underestimated the Conservative lead only two years ago.
Oil will be back in focus again on Wednesday as we await the release of last week’s inventory report from EIA. The release comes as oil continues to trade under pressure, despite last week’s agreement to extend the cuts by another nine months, and after API reported a substantial drawdown on Wednesday.
While the market reaction to the report wasn’t muted, per say, I’m not convinced it fully sunk in either. Should EIA report a reduction in inventories in the region of the 8.67 million that API reported, it may offer some reprieve for oil as it would suggest the cuts are working. It would be the eighth consecutive drawdown and the largest since September.
There’ll be plenty of economic data being released throughout the day today, including manufacturing PMI reports from across Europe and the US, as well as jobless claims, productivity, labour costs and of course, ADP non-farm employment numbers, also from the US. The ADP number comes ahead of tomorrow’s jobs report and is expected to show 181,000 jobs being created in May.
Daily Technical Analysis: EUR/USD Faces Massive Decision Between 1.12 Support And 1.13 Resistance
Currency pair EUR/USD
The EUR/USD broke above the resistance trend line (dotted red) and invalidated the bearish wave structure. The new wave count is showing the alternative 3 wave ABC (blue) within wave 4 (purple). The resistance at 1.13 and the support (green) at 1.12 are very important levels as the breakout will provide key information about the next potential trend.
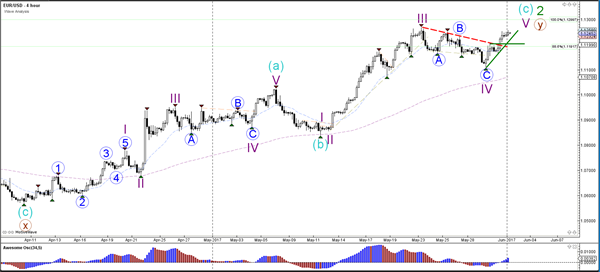
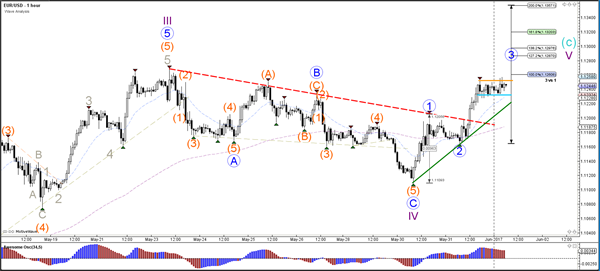
The EUR/USD broke above the resistance (dotted red) and the wave structure could now be a bullish version with a wave 123 (blue). To confirm this wave count, however, price will need stay above support (green) and reach the 161.8% Fib target.
Currency pair GBP/USD
The GBP/USD has retraced to higher levels and has reached a resistance trend line (red). A break above it invalidates the wave 3 (blue) whereas a break below support (green) could confirm it.
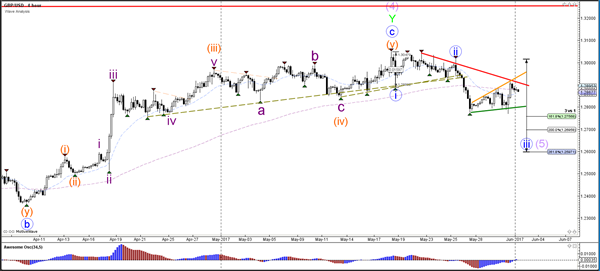
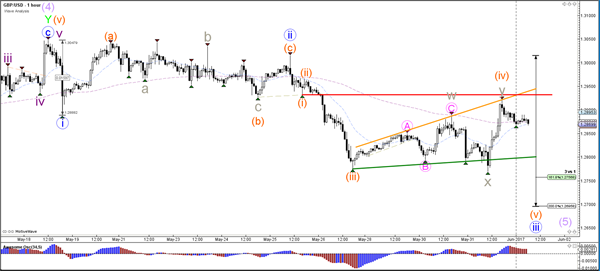
The GBP/USD completed an WXY (grey) correction within wave 4 (orange) and has reached a key decision zone.
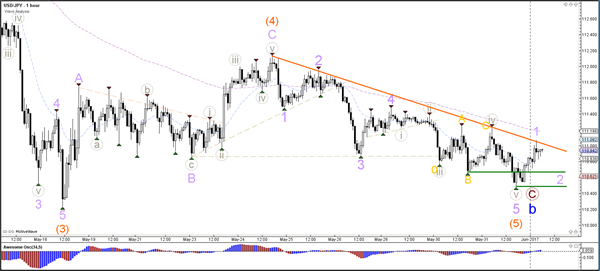
Currency pair USD/JPY
The USD/JPY could have completed a truncated wave 5 (orange), which means that the 5th wave does not break below the bottom of wave 3. A break above the resistance trend lines would confirm this structure.
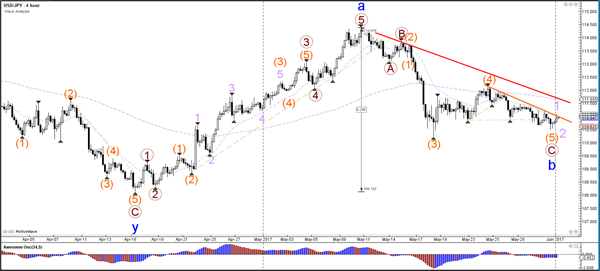
The USD/JPY seems to have completed 5 internal waves twice (grey/purple) within wave 5 (orange). A bullish break above resistance (orange) could confirm the current wave structure whereas a break below support (green) invalidates it.
Elliott Wave View: EURJPY Bullish against May 30th low
Short Term EURJPY Elliott Wave view suggests the rally from 4/16 low is unfolding as a double three Elliott Wave structure. Up from 4/16 (114.8) low, Intermediate wave (W) ended at 125.81 and Intermediate wave (X) ended at 122.53. A break above 125.81 however is still needed to add conviction that the next leg higher has started.
From 122.53 low, the rally is also unfolding as a double three Elliott Wave structure. Minute wave ((w)) ended at 125.8 and Minute wave ((x)) ended at 123.11. Near term, while pullbacks stay above 123.11, expect pair to extend higher. If pair breaks below 123.11, then pair is likely doing a double correction from 5/16 peak. This suggests pair can open extension lower to 121.6 – 122.25 area in case of a double correction. From this area, buyers should appear again for an extension higher or at least a 3 waves bounce. We do not like selling the proposed move to the downside and expect dips to find buyers in 3, 7, or 11 swing.
EURJPY 1 Hour Elliott Wave Chart
Market Morning Briefing: Aussie, Contrary To Expectation
STOCKS
Dow (21008.65, -0.10%) is trading low but while above 20900, there is still some scope of a bounce towards 21170. Else a fall towards 20800 is inevitable.
Dax (12615.06, +0.13%) tested 12700 yesterday but came off sharply to close lower. The charts indicate there could be some more of sideways consolidation in the near term within 12700-12500 region.
Shanghai (3106.21, -0.35%) came off from 3145 and is trading low today. The fall may extend to 3070 before again picking up upside momentum.
Nikkei (19841.40, +0.97%) moved up sharply targeting levels of 20000 again. But overall ranged movement within 20000-19450 is possible unless a sustained break on either side is seen.
Nifty (9621.25, -0.03%) could pause near 9650 for a couple of sessions before again resuming the rally towards 9700-9800. Overall near term looks sideways to bullish.
COMMODITIES
Gold (1270.00), contrary to expectations, has risen to test the resistance zone of 1275-85. The price action here will determine by the next week if a major bearish reversal is seen from the current levels or another rally to 1295-1300 before any decline comes.
Silver (17.34) has been forming a contracting triangle in the narrow range of 17.20-47 for the last 3 sessions which hint at a rise to 17.60-70, contrary to our bearish expectations.
Copper (2.57) remains almost unchanged which remains bearish below the short term channel resistance near 2.62/65 and the chances of a decline to 2.45-40 remains open but it could be prudent to be prepared for a sudden turnaround to the upside in the medium term.
Brent (51.15) is recovering after making a low at 50.21, very close to our target of 50.00 and now may rise to 52.70-53.00. 50.00-49.70 remains the immediate support zone. WTI (48.72) has overshot our target of 48.50 by registering a low at 47.72 and now it may recover to 50.00 levels if Brent recuperates to 52.70-53.00.
FOREX
Dollar Index (97.00) has achieved our initial target of 96.80 but the trend still remains firmly down as long as it remains unable to rise above the last swing high of 97.80 and the long term support of 96.50 may be tested in the coming days.
Euro (1.1240) has rallied as expected as it takes a breather around the current year high of 1.1267 but the rise may soon resume for 1.1300.
Dollar Yen (110.95) shows no particular intent for any directional move yet as it keeps oscillating around 111.00, exactly in the middle of its range of 110.00-112.00. As discussed yesterday, it’s better to wait for a breakout as any attempt to gauge any directional clue from these oscillations may turn out to be deceiving.
Our initial target of 1.2900 for Pound (1.2873) has been met and while our next target of 1.3000 may be achieved in the next few sessions, the chance of a prolonged phase of sideways consolidation in the broader range of 1.2750-1.3000 is brightening. Repeat - 1.2750-00 is the make or break support level for the near to medium term trend.
Aussie (0.7390), contrary to expectations, has broken below the support of 74.00. If a recovery above 74.00 is not seen immediately, then it may be dragged to the previous swing lows near 0.7325.
Another subdued session for the Dollar Rupee (64.50) with a narrower intraday range for the day as it spent the trading hours in the band of 64.49-57. Neither the support of 64.40 or the resistance of 64.75-85 was tested, providing no fresh clue about the next directional move. We keep waiting for the volatility to expand, triggering a breakout from the range of 64.40-85.
INTEREST RATES
The US 10-5Yr (0.45%) has come off without testing the higher levels of 0.475%. While trading lower, it may move towards 0.42% in the coming sessions.
The US yields are trading low. The 10YR (2.21%) and the 30Yr (2.87%) have fallen from levels near 2.22% and 2.89% respectively and look bearish for the near term.
The German-US 2Yr (-2.03%) and the German-US 10Yr (-1.91%) have both bounced from immediate support levels as expected along with the rise in Euro. While the yields still look bullish, we could expect some more upmove this week.
AUDUSD: Prepares To Break Under The Trend Line
Key Points:
- Price action fails to break through bearish trend line.
- Key support zone is looming.
- Watch for a break lower and towards support at 0.7320
The embattled Aussie Dollar might be about to disappoint the bulls again as price action sets up for a potential tumble. The past few days has seen price action trending in a largely sideways direction after having failed to break through the long term descending trend line. Subsequently, the pair is now facing a potential collapse back towards the 73 cent handle if the current short term channel fails to hold.
In fact, a cursory review of the 4-hour chart demonstrates the pair’s current dilemma with price action flirting with breaking the current support zone around 0.7416. The AUDUSD has also managed to drop through the 100 and 50 EMA’s which provides further evidence of the bearish contention. Also, price is currently moving in impulse waves and, given the recent failure to breach the bearish trend line, the time has likely come for a wave lower. In addition, the RSI Oscillator is still currently declining within neutral territory which suggests that it still has plenty of room to move on the downside. Subsequently, there are plenty of reasons to suggest that the pair’s direction in the coming days is likely to be in negative in nature.
Fundamentally, the Australian economy has also seen plenty of negative sentiment over the past few weeks with a fairly well founded concern over the impact of a Chinese slowdown on export demand. Although this slowdown has been ongoing for some time it’s just now that the impact of it is finally flowing through the expectations channel. Subsequently, this is likely to start impacting business and consumer confidence and could put a crimp on the RBA’s plan to hold rates steady over the medium term.
Ultimately, the pair is likely to have a fairly torrid few days if price action indeed breaks through the current support zone. Subsequently, the most likely scenario is one where price meanders sideways for the remainder of today’s session before breaking lower and moving fairly rapidly towards the initial target at 0.7320. However, be aware that the U.S. NFP figures are due out in the next few days and is likely to bring plenty of volatility with it.
What’s Next For The EURCHF?
Key Points:
- Near-term upsides could be a set up for a long-term decline.
- Price action seems to indicate that a long-term double top is in place.
- Fundamental view is in line with the technical forecast.
The EURCHF has an interesting technical set-up developing that could mean we have both upside and downside risks to consider moving forward. Specifically, we are probably going to see the pair advance in the near-term although this is likely to simply be the preamble to a rather precipitous decline that could send us back to April's lows.
Turning firstly to the near-term forecast, we currently expect to see the pair move up to around the 1.0964 handle within the next week or so. This is primarily a result of the developing double bottom pattern that began to retrace in early May and is now moving into its final leg. Of course, this is largely contingent on the 1.0869 support remaining intact but – given the presence of the 38.2% Fibonacci level and a historical zone of reversal – it seems fairly likely that it will hold firm.
In the event that support does indeed remain unbroken, the combined influence of the EMA bias and the nearly oversold stochastics should prove to be more than capable of rallying the bulls. However, if we take a look at the wider pattern, there is another reason to be optimistic of a near-term advance for the pair. Notably, the already described double bottom actually resides within a larger double top pattern and the completion of this near-term pattern will confirm that the long-term structure is also valid.
The confirmation of the double top brings us to the second part of our forecast which is precisely the opposite of our near-term bias. As illustrated above, a rally back to the descending trend line at the 1.0964 mark should result in yet another reversal and a subsequent downtrend. What's more, if this decline extends below the neckline of the long-term structure, we could have a major breakout to the downside on our hands which might even see the EURCHF retreat all the way back to the 1.0655 handle.
Ultimately, the bias is in line with most fundamental expectations as rising headline risks presented by the UK election, Brexit, and the Trump presidency will be weighing on the EURCHF. Indeed, these factors – alongside many others – are more than likely to see the pair retreat in the long-run regardless of the technical bias and it is, therefore, simply a bonus that the technical and fundamental outlooks are in agreement.