
Sample Category Title
Trade Idea: GBP/JPY – Sell at 143.65 or buy at 142.20
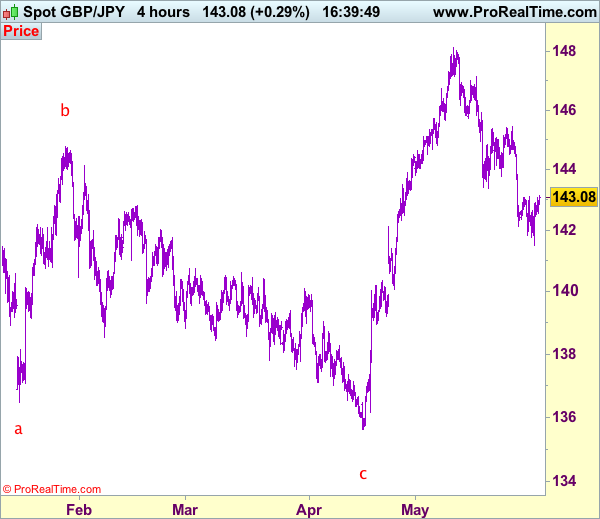
GBP/JPY - 143.05
Recent wave: Medium term low formed at 120.50 and (A)-(B)-(C) major correction has commenced with (A) leg ended at 148.45, hence wave (B) is unfolding for retreat to 131.00-10.
Trend: Near term up
Original strategy:
Sell at 143.65, Target: 141.65, Stop: 144.25
Position: -
Target: -
Stop: -
New strategy :
Sell at 143.65, Target: 141.65, Stop: 144.25
O.C.O.
Buy at 142.20, Target: 143.70, Stop: 141.60
Position: -
Target: -
Stop:-
Although sterling fell briefly to 141.50 yesterday, the subsequent rebound suggests consolidation above this level would be seen and recovery to 143.65-70 cannot be ruled out, however, reckon 144.00-10 would limit upside and bring another decline later. Below said support at 141.50 would extend the selloff from 148.10 top to 141.00, however, loss of momentum should limit downside to 140.50-55 and price should stay above psychological support at 140.00, bring rebound later.
In view of this, whilst we are still looking to sell on further recovery, we would also buy sterling on dips but one should exit on such rebound. Above 144.00 would risk a stronger rebound to 144.50 but upside would still be limited to 145.00 and price should falter well below said resistance at 145.45, bring another decline later.
Our preferred count is that larger degree wave V with circle is unfolding from 251.12 with wave (I) 219.34, (II): 241.38 and wave (III) is subdivided into 1: 192.60, 2: 215.89 (23 Jul 2008) and wave 3 ended at 118.87 earlier in 2009. The correction from there to 162.60 is wave 4 which itself is a double three and is labeled as first a-b-c ended at 151.53, followed by wave x at 139.03, 2nd a ended at 162.60, 2nd b at 146.75 and 2nd c leg of wave 4 ended at 163.00. Therefore, the decline from 163.00 to 116.85 is now treated as wave 5 which also marked the end of larger degree wave (III), hence wave (IV) major correction has commenced for retracement of the wave (III) from 241.38 and upside target at 183.95-00 (50% Fibonacci retracement of the wave (II) from 241.38) had been met, a drop below 160.00 would suggest wave (IV) has ended at 195.85, bring decline in wave (V) for initial weakness to 130 (already met) and 120.
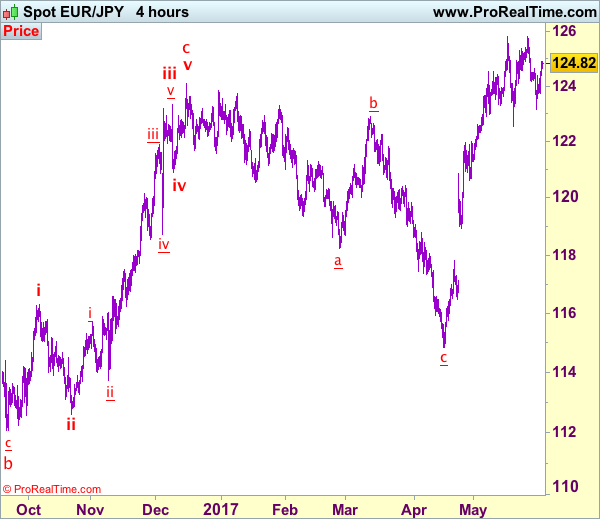
EUR/USD Elliott Wave Analysis
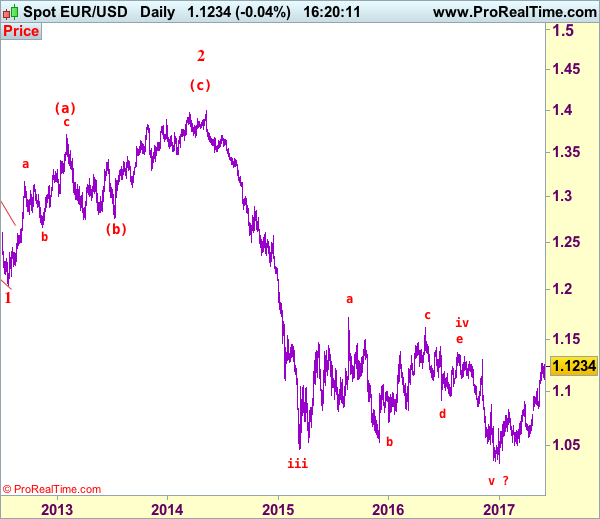
EUR/USD – 1.1228
EUR/USD: Wave (c) of 2 ended at 1.3993 and wave 3 of III has commenced for weakness to 1.0411 (1.236 of wave 1), then 1.0000.
Although the single currency has rebounded after his week’s initial retreat to 1.1109 and retest of 1.1268 is likely, break there is needed to confirm recent erratic rise from 1.0340 low has resumed and extend gain to previous resistance at 1.1300, however, only a daily close above there would retain bullishness and signal medium term downtrend has ended and extend further headway to another previous resistance at 1.1366 but near term overbought condition should prevent sharp move beyond 1.1430-35 and price should falter below 1.1500, bring retreat later.
Our preferred count on the daily chart remains that a wave (II) from 1.2329 ended at 1.5145 with A-leg ended at 1.4720, followed by wave B at 1.2457, the wave C from there was also a 3 legged move and is labeled as (a): 1.3739, (b): 1.2885, the wave iii of the 5-waver (c) from 1.2885 has ended at 1.4339 and wave iv is a triangle ended at 1.3878 and wave v formed a top at 1.5145. The decline from there is a 5-waver (C) with minor wave (i) of I of (C) ended at 1.4218 with wave (ii) ended at 1.4580, wave (iii) ended at 1.3267 and wave (iv) ended at 1.3692 and wave (v) ended at 1.1876, this is also the low of wave I of (C) and wave II ended at 1.4940, hence wave III is now in progress with a diagonal wave 1 ended at 1.2042, the breach of previous support at 1.1876 (wave I trough) adds credence to our view that the wave 2 has ended at 1.3993, wave 3 has commenced for further weakness to 1.0411, then towards 1.0000.
On the downside, although initial pullback to 1.1190-00 cannot be ruled out, reckon 1.1109 support would limit downside and bring another rise to aforesaid upside targets. Only below previous resistance at 1.1025 would abort and suggest a temporary top is formed instead, bring correction to 1.0975-80 but downside should be limited to 1.0900 and support at 1.0839 should remain intact, bring rebound later.
Recommendation: Stand aside for this week.
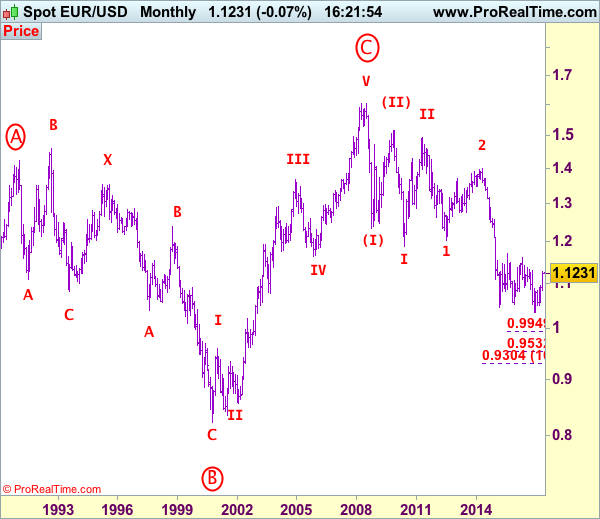
Euro's long-term uptrend started from 0.8228 (26 Oct 2000) with an impulsive structure. The rise from 0.8228 to 0.9593 (5 Jan 2001) is labeled as wave I, the retreat to 0.8352 (6 Jul 2001) is wave II and the rally to 1.3670 (31 Dec 2004) is wave III. Wave IV from there ended at 1.1640 (15 Nov 2005), the subsequent upmove to 1.6040 (July 15, 2008) is treated as wave V, the major selloff from the record high of 1.6040 to 1.2329 (October 27, 2008) signals a reversal has taken place with (I) leg ended at 1.2329 and once (II) ended at 1.5145, wave (III) itself is an extended move with I: 1.1876 and complex wave II ended at 1.4902, wave III has commenced with wave 1 and 2 ended at 1.2042 and 1.3993 respectively, wave 3 of III is now unfolding for weakness towards parity.
USD/JPY Elliott Wave Analysis
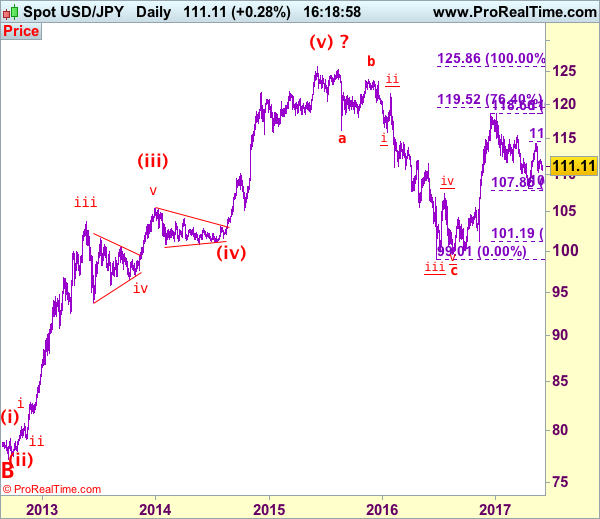
USD/JPY - 111.15
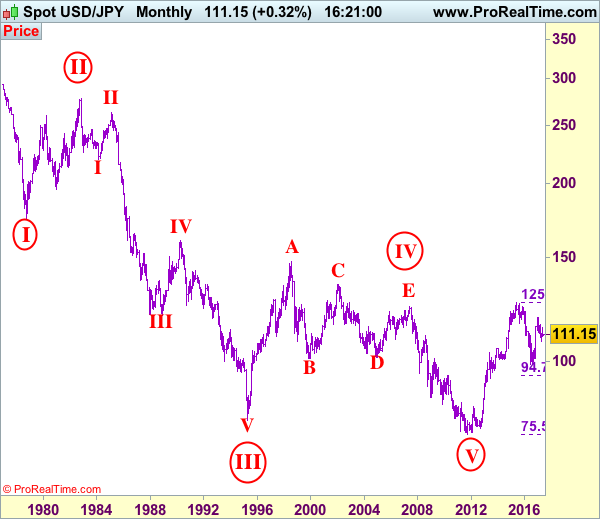
USD/JPY – Wave V of larger degree circle V has possibly ended at 75.31 and major correction has commenced and already met indicated target at 125.00.
Although the greenback rebounded to 112.13 late last month, renewed selling interest emerged there and dollar has slipped again since, retaining our bearishness and a retest of previous support at 110.24 is underway, break there would signal the decline from 114.37 top is still in progress for further weakness to 110.00, then towards previous support at 109.59, however, as broad outlook remains consolidative, reckon downside would be limited and bring recovery later. In the event dollar closes below 109.00 on a daily basis, this would provide confirmation that the rebound from 108.13 is over and bring retest of 108.13 eventually.
Our preferred count is that, triangle wave IV (with circle) ended at 101.45 and the circle wave V brought dollar down to the record low of 75.31 in 2011 and the subsequent rebound signal major correction has commenced with A leg ended at 84.19, followed by wave B at 77.14 and impulsive wave C is now unfolding (indicated upside target at 125.00 had been met) for gain towards 127.00 level. In the event dollar drops below support at 99.01, this would confirm medium term decline from 125.86 top (2015 high) has resumed for subsequent weakness to 98.00 and possibly 97.00.
Under this count, this wave C is unfolding as impulsive waves with (1) (2), 1 2 ended at 80.67, 79.07, 82.84 and 81.69 respectively, hence the extended wave 3 has ended at 103.74 and wave 4 correction of recent upmove should bring weakness to 92.57, then towards 90.88 but psychological support at 90.00 should limit downside and bring another rally later in wave 5, indicated target at 125.00 had been met and gain to 127.00 cannot be ruled out but reckon price would falter below 130.00.
On the upside, whilst initial recovery to 111.00-10 cannot be ruled out, reckon 111.45-50 would limit upside and price should falter below said resistance at 112.13, bring another decline later. A daily close above 112.13 would prolong consolidation and bring another bounce to 112.70-80, however, previous support at 113.12 should limit upside and price should falter below 113.85, bring retreat later. Only break of 113.85 would suggest the retreat from 114.37 has ended and bring another rise to this level, a break of this resistance at 114.37 would extend the rise from 108.13 low to 114.60-65 (61.8% Fibonacci retracement of 118.66-108.13). Having said that, a daily close above there is needed to retain bullishness and suggest the entire fall from 118.66 has ended at 108.13, then further gain to 115.00 and later test of key resistance at 115.51 would follow.
Recommendation: Stand aside for this week.
On the monthly chart, we have changed our preferred count that an impulsive wave is unfolding with major wave III with circle ended at 79.75, then followed by wave IV with circle and is labeled as a triangle with A: 147.64 (11 August, 1998), B: 101.25, C: 135.20, D: 101.67 and E leg ended at 124.14 to end the wave IV with circle. Hence, wave V with circle commenced from there and hit a record low of 75.31, however, the subsequent strong rebound signals this circle wave V has possibly ended there, hence gain to (indicated upside target at 122.00 and 125.00 had been met), the retreat from 125.86 suggests wave A of major correction has ended there and wave B correction back to 99.00, then 95.00 would be seen, however, reckon downside would be limited to 90.00, bring another rebound in wave C next year.
Technical Outlook: GBPUSD – Contradicting Polls Remain Sterling’s Main Driver
Cable stayed at the back foot in Asia and extended pullback from Wednesday's rally top at 1.2920, to fresh low at 1.2840 in early European trading. The pair is driven by contradicting news about pre-election position of two major political parties.
Release of poll that showed increasing lead of Conservatives boosted pound on Wednesday, but YouGov survey that was released on Thursday showed Tories only 3% ahead of Labour Party.
As expected, sterling is seen in choppy mode, moved mainly by political news, in the days preceding June 8 vote. Pound may fall further if Conservatives lose majority in the parliament, as suggested by the latest poll. Such scenario would weaken the position of UK PM Theresa May at the beginning of long and tough Brexit negotiations with the EU.
Alternatively, sterling would receive significant support if May keeps comfortable majority in the parliament. Technical studies show mixed setup on daily chart. Overall bulls are underpinned by rising daily cloud, but near-term recovery action from double downside rejection at 1.2770 zone was capped by strong barriers at 1.2908/20 zone, provided by converged daily Tenkan-sen/Kijun-sen lines and 10/20SMA's.
In addition, descending thick weekly cloud (cloud base currently lies at 1.2950) continues to heavily weigh on market, after capping broader recovery rally from 1.2100.
Stronger direction signals could be expected on firm break through key near-term barriers at 1.2920/50 or supports at 1.2770 zone (lows of pullback from 1.3047 peak, reinforced by daily cloud top).
Res: 1.2889, 1.2908, 1.2920, 1.2950
Sup: 1.2840, 1.2826, 1.2800, 1.2768
ISM Manufacturing Index Could Beat Expectations
The US dollar was mixed yesterday as the PCE data showed a 0.2% increase on the core or 1.5% on a year over year basis. This was below the Fed's 2.0% inflation target rate. However, personal income and spending both managed to post some modest gains, rising 0.4% on both as forecast.
The euro spiked higher back to $1.1200 before giving up the gains. The rally came on speculation that the ECB could remove the easing bias when it meets in June with the possibility of announcing further tapering as early as September. The euro, however, gave up the gains towards the close.
The monetary policy makers in the US, however, were slightly dovish with Lael Brainard saying that the soft inflation could lead her to reassess the path for monetary policy.
Looking ahead, the Eurozone's flash inflation estimates for May will be released today with expectations showing a modest decline following an increase in April. In Canada, the GDP numbers will be coming out for March with forecasts showing a 0.3% increase on a month over month basis.
EURUSD intraday analysis
EURUSD (1.1245): On the daily chart, EURUSD is currently looking to breakout from the bullish flag pattern. Price is currently testing the higher closer at 1.1236 from May 22, and a successful bullish close above this level could trigger further upside.
The minimum upside is expected to see EURUSD push to 1.1338 and 1.1467, marking the 127.2% and 161.8% targets of the bullish flag pattern. However, on the 4-hour chart, the mini-pitchfork shows that price could be at risk of a pullback. Support is seen at 1.1200. The bullish flag pattern remains intact up to 1.1160. Only a break down below this level will trigger further downside in price.
GBPUSD intraday analysis
GBPUSD (1.2868): The British pound is likely to post a head and shoulders pattern on the daily chart, but this pattern is still evolving. Support has been firmly established at 1.2800, while the current bounce could see price likely to reverse around 1.12950 region.
A reversal here is to be expected followed by a test back to 1.2800. A break down below 1.2800 could trigger the head and shoulders pattern which puts the minimum downside target to 1.2600. On the 4-hour chart, the upside bounce could see price test the minor support that was broken at 1.2937 where resistance could develop. Failure to reverse near 1.2950 - 1.2937 will see 1.3000 being tested once again and will invalidate the head and shoulders pattern.
USDJPY intraday analysis
USDJPY (110.95): The U.S. dollar fell back to 110.79 support against the yen. Price action is seen currently attempting to push higher. The symmetrical triangle on the 4-hour chart suggests that the upside could continue.
Watch for the breakout from the minor falling trend line to suggest the upside move. A successful breakout will keep USDJPY supported to the upside with the target of 112.50 likely coming into focus. However, there are also some risks to the downside. Failure to hold the consolidation at 110.79 support will mean a possible break down lower. This will put USDJPY on thepath to test the lower support at 110.00.
Trade Idea: EUR/JPY – Buy at 123.85
EUR/JPY - 124.77
Recent wave: wave v of (C) ended at 94.12 and major correction in wave A has ended at 149.79
Trend: Near term up
Original strategy:
Bought at 124.10, stopped at 123.50
Position: - Long at 124.10
Target: -
Stop: - 123.50
New strategy :
Buy at 123.85, Target: 125.75, Stop: 123.25
Position: -
Target: -
Stop:-
Although the single currency dropped earlier this week to as low as 123.16, as euro found good support there and has staged another rebound, suggesting further consolidation would be seen with mild upside bias for subsequent gain towards resistance at 125.82, however, break there is needed to confirm recent upmove has resumed and extend headway to 126.20-30 and possibly 126.60-70 but reckon 127.00-10 would hold from here.
In view of this, we are looking to buy euro on pullback as 123.70-75 should limit downside and bring another rise later. Below said support at 123.16 would abort and shift risk back to downside for test of previous support at 122.56 which is likely to hold from here due to broad consolidative outlook.
Our latest preferred count is that wave (ii) is ABC-X-ABC which ended at 123.33 and wave (iii) is unfolding with wave iii ended at 100.77, followed by wave iv at 111.57 and wave v as well as the wave (iii) has ended at 97.04, followed by wave (iv) at 111.43 and wave (v) has ended at 94.12 which is also the end of the larger degree v, this also implied the major wave (C) has also ended there, hence major correction has commenced from there with (A) leg unfolding in its lower degree wave c which has possibly ended at 145.69. Under this count, A-B-C wave (B) has commenced with A leg ended at 136.23, wave B at 143.79 and wave C has possibly ended at 149.79.
Our larger degree count is that the decline from 139.26 is wave (C) and is sub-divided into a diagonal triangle i-ii-iii-iv-v with wave i - 105.44, wave ii- 123.33, wave iii - 97.03, wave iv - 111.43, followed by the final wave v as well as the end of wave (C) at 94.12, this also mark the bottom of larger degree wave B. Under this count, major rise in wave C has commenced as an impulsive wave with minor wave III ended at 145.69, wave V is still in progress for further gain to 150.00. Having said that, this so-called wave V could well be the first leg of larger degree 5-waver wave C and this wave C should bring at least a retest of wave A top at 169.97 (July 2008).
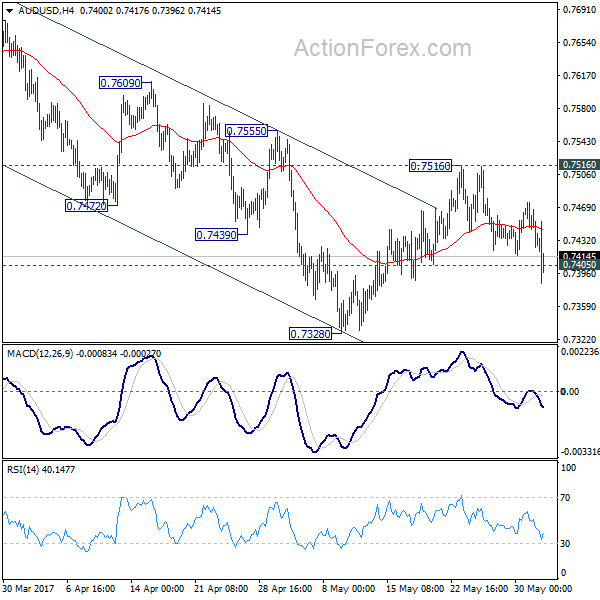
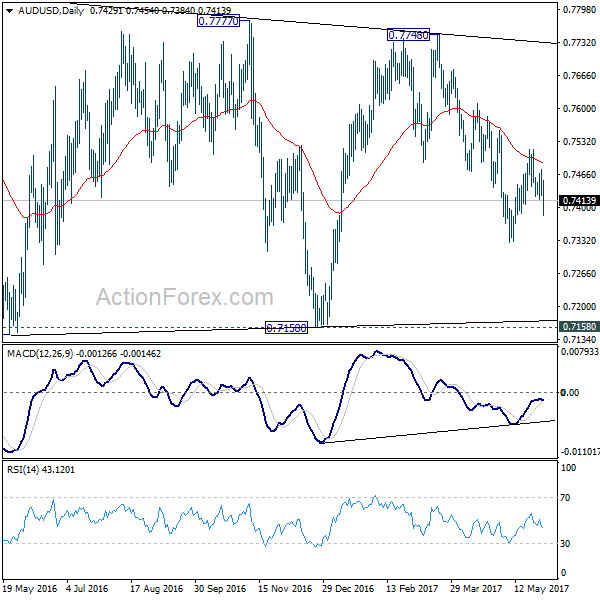
AUD/USD Daily Outlook
Daily Pivots: (S1) 0.7411; (P) 0.7443; (R1) 0.7462; More...
The break of 0.7405 minor support confirmed that corrective rise from 0.7328 has completed at 0.7516. Intraday bias is turned back to the downside for 0.7328 first. Break will extend the decline from 0.7748 to 0.7144/7158 support zone. However, break of 0.7516 resistance will now indicate near term reversal and turn bias back to the upside.
In the bigger picture, we're still treating price actions from 0.6826 low as a corrective pattern. And, as long as 38.2% retracement of 0.9504 to 0.6826 at 0.7849 holds, long term down trend from 1.1079 is expected to resume sooner or later. Break of 0.6826 low will target 0.6008 key support level. However, firm break of 0.7849 will indicate that rise from 0.6826 is developing into a medium term rebound, rather than a sideway pattern. In such case, stronger rise should be seen to 55 month EMA (now at 0.8115) and above.
USD/CAD Daily Outlook
Daily Pivots: (S1) 1.3448; (P) 1.3485; (R1) 1.3537; More....
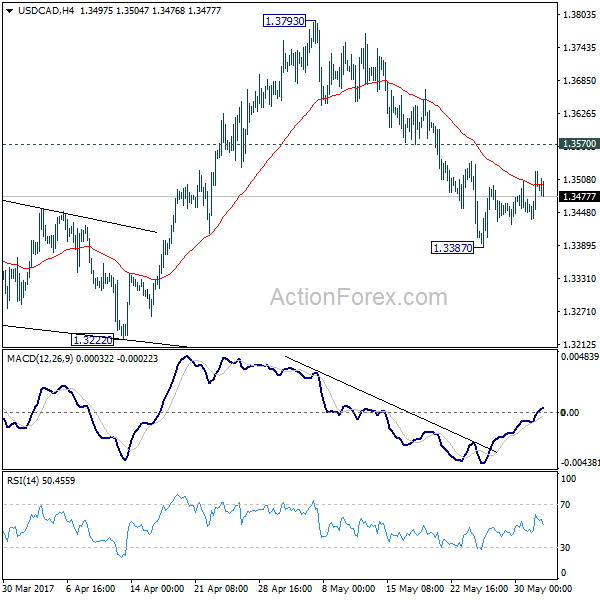
Intraday bias in USD/CAD remains neutral as consolidation from 1.3387 temporary low continues. Upside of recovery should be limited by 1.3570 resistance and bring fall resumption. At this point, we're still favoring the case that rise from 1.2968 has completed. And the larger rise from 1.2460 could have finished too. Below 1.3387 will target 1.3222 support first. Break of 1.3222 will affirm our bearish view and target 1.2968 key support level for confirmation. However, break of 1.3570 will turn focus back to 1.3793 high instead.
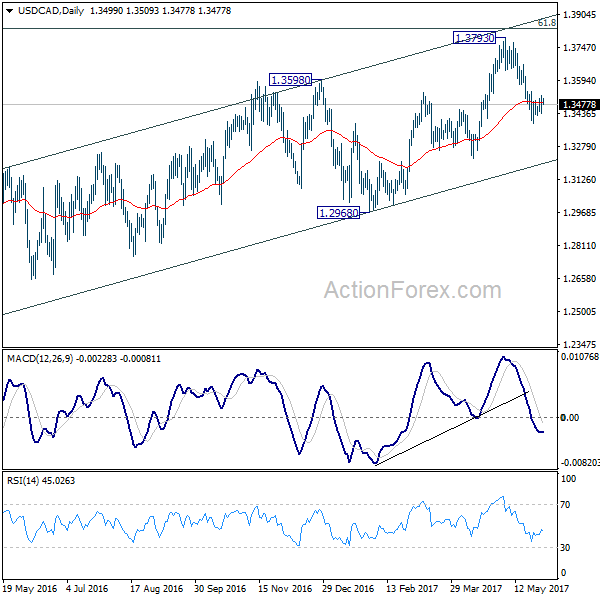
In the bigger picture, price actions from 1.4689 medium term top are seen as a correction pattern. The first leg has completed at 1.2460. Rise from 1.2460 is seen as the second leg and could have completed at 1.3793, ahead of 61.8% retracement of 1.4689 to 1.2460 at 1.3838. Break of 1.3222 should indicate the start of the third leg while further break of 1.2968 should confirm. Nonetheless, sustained trading above 1.3838 would pave the way to retest 1.4689 high.
Currencies: Euro Holds Strong Even As EMU Inflation Declines
Sunrise Market Commentary
- Rates: US 10-yr yield heading for test of 2.16% support?
Today's market calendar heats up in the US. Risks for ADP are tilted on the downside of expectations while the price component of the manufacturing ISM could disappoint as well. This combination could push the US 10-yr yield for a test of 2.16% support (currently 2.21%) and push the US Note future temporary to a new contract high. - Currencies: Euro holds strong even as EMU inflation declines
Yesterday, the euro outperformed the other majors even as EMU inflation dropped more than expected. The dollar remained in the defensive. Today, the focus is on the US ADP report and the manufacturing ISM, ahead of tomorrow's key payrolls. A test of EUR/USD 1.1268 resistance is likely. Sterling still feels political headwinds.
The Sunrise Headlines
- US equities managed to undo initial weakness and closed the day marginally lower. Overnight, Japanese stocks outperform on strong data (capex, PMI, company profits) while China loses ground on a sub-50 PMI reading.
- President Trump said he would make an announcement today on the Paris climate treaty, with White House officials saying he is expected to withdraw from the accord, although they cautioned that the situation may yet change
- SF Fed Williams said that 3 rate increases is a reasonable view for this year, but there is upside potential for the economy which would warrant 4 hikes. He isn't worried about recent inflation data which reflect “temporary factors”.
- The private Chinese Caixin manufacturing PMI fell to 49.6 from 50.3 in April (vs 50.1 consensus), the lowest level since June 2016 and back below the boom/bust mark (50).
- The US economy expanded at a modest to moderate pace from early April through late May but showed little sign of breaking out of a recent trend of sluggish inflation, the latest Beige Book showed.
- Brazil's central bank slashed the key interest rate from 11.25% to 10.25%, continuing its pace of cuts amid a political crisis that has sown uncertainty just as the economy was seen as crawling back from its worst recession ever.
- Today's eco calendar is interesting with ADP employment, weekly claims and manufacturing PMI/ISM's in EMU (final), the UK and the US. Spain and France tap the market. Several ECB governors speak at Brussels economic forum and Fed Powell talks on the normalization of monetary policy
Currencies: Euro Holds Strong Even As EMU Inflation Declines
Euro rebounds. Dollar continues to struggle.
The euro outperformed other major currencies yesterday. EMU inflation declined more than expected, but German and EMU unemployment beat market consensus. The combination of good growth, low inflation and the expectation of only gradual ECB normalisation supported European assets and the euro. At the same time, the dollar remained in the defensive. EUR/USD came within reach of the 1.1268 correction top, but a real test didn't occur. The pair closed the day at 1.1244. USD/JPY remained in the defensive even as US equities reversed most of the intraday dip. The pair finished the day at 110.78.
Overnight, country specific issues dominated trading in several Asian markets. Positive capital spending data and corporate profits supported Japanese equities. The yen stays strong despite positive risk sentiment. USD/JPY hovers in the 111 area. A rebound in the oil price is also slightly positive for regional sentiment. The Chinese picture is a bit ambiguous. The Caixin manufacturing PMI dropped below 50 (49.6) and weighs on Chinese equities. At the same time, the yuan jumps sharply higher. Chinese authorities apparently want to discourage CNY/CNH shorts and fixed CNY/USD sharply stronger. The poor Chinese PMI and disappointing domestic capital spending also weigh on the Aussie dollar. AUD/USD dropped to the 0.74 area. EUR/USD maintains yesterday's gains.
The EMU manufacturing PMI is expected to confirm the strong preliminary ready (57) today. However the focus for trading will be on the US data. ADP private job creation is expected more or less stable at 180K. Recent labour subindices in other surveys showed a loss of momentum. Is there a risk for a downward ADP surprise? The US ISM manufacturing is expected little changed at 54.7. We don't have much reason to take different view from the consensus. We also keep an eye at the prices sub-index. Here is maybe a risk for some easing. To conclude: US data might confirm a scenario of decent growth, but a negative surprise is possible. Over the previous days, the decline of the dollar slowed and the euro rally took a breather. Yesterday's price action suggested that both underlying trends aren't over yet. Of late, the USD's reaction to the ISM and ADP was often modest. The payrolls are more important. Even so, we don't expect the US data to provide much USD support. CB speakers and the decision of Trump on the Paris Climate agreement (risk-off in case of a rejection?) are wildcards. A real test of the EUR/USD top at 1.1268 is likely. USD/JPY hardly profits from constructive risk sentiment
In a broader perspective, the dollar traded soft recently. US data were a bit disappointing, markets turned more cautious on Trump's pro-growth agenda and US yields declined. At the same time, the euro profited of reduced political risk on the region. Last week, there were tentative signs that the dollar decline could slow. However, the jury is still out whether enough USD softness is discounted? This week's payrolls and, to a lesser extent today's ISM, might be important in this assessment.
Technical picture
The USD/JPY rally ran into resistance early May. A mini-sell-off pushed the pair below the previous top (112.20), making the short-term picture negative. Return action lower in the 108.13/114.37 range is possible.
Earlier this month, it looked that EUR/USD could revisit 1.0821/1.0778 support (gap), but poor US data and political upheaval propelled EUR/USD north of the 1.1023 range top. The pair reached a short-term correction top at 1.1268. The correction top at 1.1300/1.1366 is next resistance. USD sentiment will have to be extremely negative to clear this hurdle short-term. So, a clean break of this won't be that easy. A return below 1.1023 would indicate that the upside momentum has eased.
EUR/USD: holding near recent top. US eco data to decide whether there is room for further gains
EUR/GBP
Sterling decline slows, but political uncertainty still weighs
Yesterday morning, investors sold sterling after a YouGov poll indicated that the Conservative party might fail to secure a majority in the June 08 election. Other polls still indicate quite a substantial lead for PM May. Cable dropped temporary below 1.28. EUR/GBP rebounded north of 0.87. The pressure on sterling eased later in the session, maybe as other polls still give quite a significant lead for the conservative party. Especially cable rebounded and closed the session at 1.2890, reversing the overnight loss. EUR/GBP closed the session at 0.8723, still within reach of the recent top.
Today, the UK manufacturing PMI is expected to decline slightly from 57.3 to 56.5. However, the focus for sterling trading remains on the potential outcome of the UK election. Political uncertainty will probably prevent a sustained sterling rebound before the June 08 election. However, in a day-to day perspective, sterling could enter some calmer waters as quite some negative news should already be discounted after the recent sell-off. Next resistance comes in 0.8788.
EUR/GBP nears recent highs as election uncertainty grows
Oil Remained Under Pressure Yesterday Though It Has Recovered Slightly This Morning
Market movers today
Today we have PMI releases for May in the UK, Norway, Sweden, Spain and Italy, and US ISM manufacturing.
In the US, we will also get the ADP job report where the market consensus is for 180 ,000 new jobs being created in May, up from 177,000 in April. The US ISM index is expected to decline slightly to 54.6 in May from 54.8 in April, according to market consensus.
For the UK PMI release, as the PMI manufacturing index for the euro area increased slightly in May, there may be upside risk to our expectat ion of a slight fall in the UK index.
This morning we published our bi-annual global outlook called Big Picture. We lower our forecast for global growth due to downward revisions in the US and China. We no longer look for a fiscal boost in the US in 2018 and policy tightening in China has exceeded our expectations. Our forecast for the euro area is broadly unchanged. For more details see The Big Picture: Less tailwind for the global economy.
Selected market news
The European fixed income market eagerly awaited the first eurozone May inflat ion data yesterday. It showed a slightly bigger than expected drop in inflation to 1.4% from the previous 1.9%. Importantly, core inflation dropped from 1.2% to 0.9%. The low adds to the pressure on the ECB to keep its rhetoric dovish at its meeting next week. However, the impact of the slightly lower than expected inflation numbers was muted in the fixed income market . It might underline that the market , especially after the dovish words from him earlier in the week, is already positioned for a dovish Draghi.
However, the market could be in for a surprise. German hawks Weidman and Lautenschäger yesterday used the opportunity - just hours before the " silent period" of the ECB before the 8 June meeting kicks in - to give their views. Weidman said: " In my view, the current economic out look together with the improvement in the balance of risks suggests that the Governing Council is beginning to discuss whether and when it will be time to adjust our forward guidance". Laut enschäger added: " All ingredients for an appropriate increase in prices are present . Against that backdrop, we should prepare to slowly reduce the dose of monetary medicine."
OIL remained under pressure yesterday though it has recovered slightly this morning. The market continues to doubt that the OPEC cuts will be enough to stabilise the market given the surge in US oil production. The lower oil price spills over to the inflation market and coupled with the loss of confidence in Trump's fiscal boost , US market -based inflation expectations like 5y5y are now back at levels not seen since before he was elected.
In the UK, all eyes are now on the polls ahead of the 8 June election after a poll from YouGov on Tuesday said that Theresa May and her Conservative Party could lose their absolute majority in the House of Commons. Other polls have not confirmed this change.