Sample Category Title
Gold Analysis: Reaches Near 1,270 level
'We remain friendly on gold and suspect that we will likely push higher over the course of the coming week.' – Edward Meir, INTL FCStone (based on Reuters)
Pair's Outlook
The yellow metal started the week below the 1,270 mark with a decline. The reason for the decline was the fact that the commodity price already reached and has bounced off the resistance put up by the monthly PP, which is located at the 1,269.77 level. In general, a continuation of the surge in the future is still expected. However, before that the bullion is most likely going to retreat until it finds support in the weekly PP at the 1,261.80 level. Afterwards, the already mentioned monthly level of significance will pose a resistance. Although, due to the month ending soon that resistance will become obsolete soon.
Traders' Sentiment
SWFX traders remain almost neutral, as 51% of open positions are long. Meanwhile, 67% of pending commands are set to buy the metal.
Daily Technical Analysis: GBP/JPY Now Moment Sellers Could Be Waiting At Confluence Zone
The GBP/JPY has broken through a flat bottom descending triangle that has been forming on H1 time frame. The triangle is classified as a running one due to lack of vortex at the top (the pinnacle). At this point the price is retracing towards the POC zone (W H3, D H3, order block, ATR pivot, 38.2) 143.20-40. If there are now moment sellers within the zone, the price could reject towards 142.00 and 141.65. Have in mind that UK banks will be closed today in observance of the Spring Bank Holiday, so the price might not get to it's full projected target if rejection from POC happens.
EUR/USD Daily Outlook
Daily Pivots: (S1) 1.1148; (P) 1.1191 (R1) 1.1222; More....
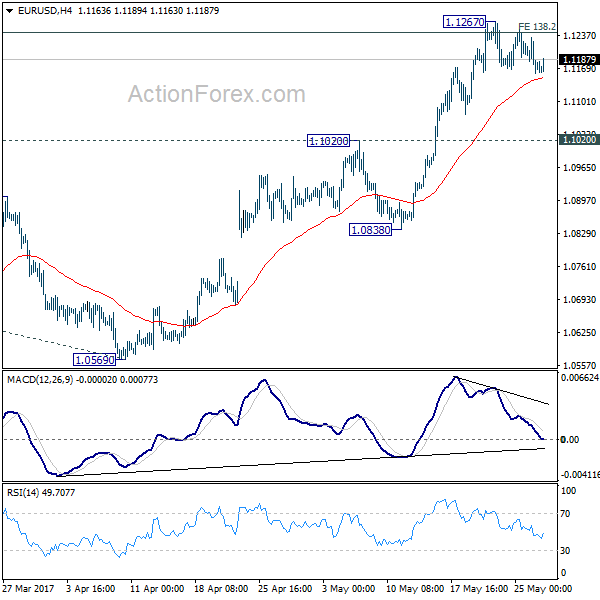
Intraday bias in EUR/USD remains neutral for the moment. At this point, remain cautious on strong resistance from 1.1245/98 (138.2% projection of 1.0339 to 1.0828 from 1.0569 at 1.1245) to limit upside and bring reversal. But another rise will be in favor as long as 1.1020 resistance turned support holds. Decisive break of 1.1298 will carry larger bullish implication and target 1.1615 resistance next. On the downside, though, break of 1.1020 resistance turned support will indicate rejection from 1.1245/98 and turn bias to the downside for 1.0838 support first.
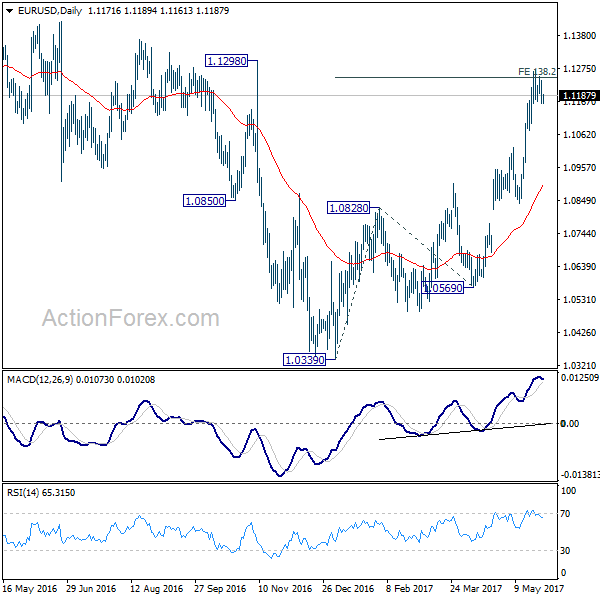
In the bigger picture, the case for medium term reversal continues to build up with EUR/USD staying far above 55 week EMA (now at 1.0888). Also, bullish convergence condition is seen in weekly MACD. Focus will now be on 1.1298 key resistance. Rejection from there will maintain medium term bearishness and would extend the whole down trend from 1.6039 (2008 high). However, firm break of 1.1298 will indicate reversal. In such case, further rally would be seen back to 1.2042 support turned resistance next.
GBP/USD Daily Outlook
Daily Pivots: (S1) 1.2737; (P) 1.2841; (R1) 1.2908; More...
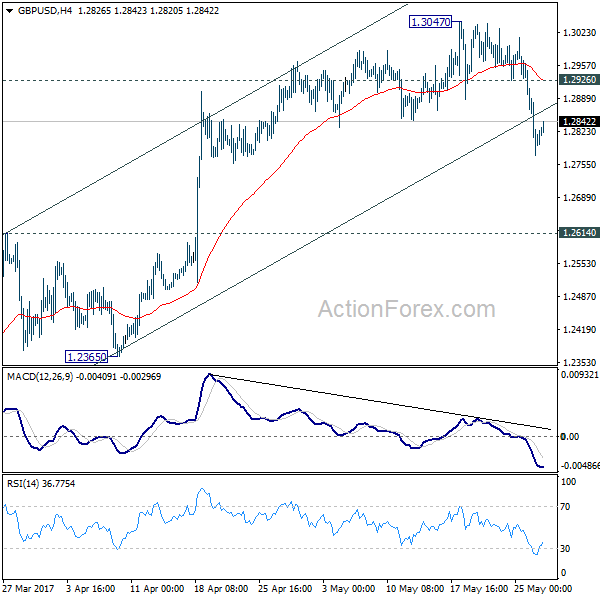
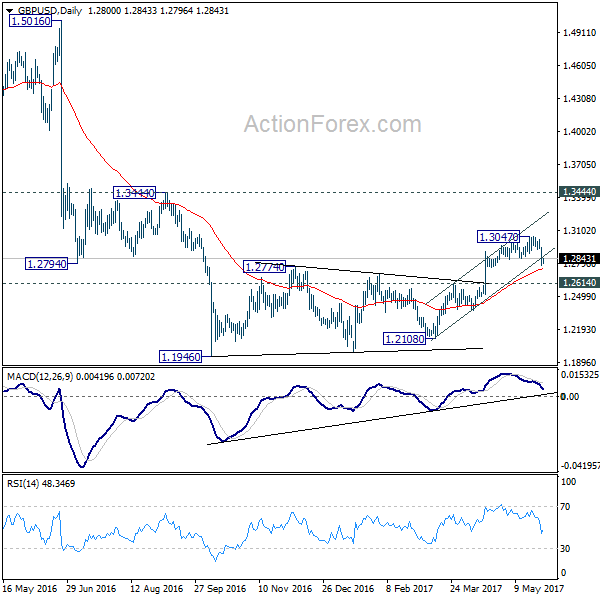
Intraday bias in GBP/USD remains on the downside despite mild recovery today. As noted before, a short term top is in place at 1.0347 on bearish divergence condition in 4 hour MACD. Also, rise from1.2108 could have completed too. Deeper fall would be seen for 1.2614 resistance turned support first. Break there should also indicate completion of whole consolidation pattern from 1.1946 and target a retest on this low. Meanwhile, above 1.2926 minor resistance will turn focus back to 1.3047 high instead.
In the bigger picture, fall from 1.7190 is seen as part of the down trend from 2.1161. The rejection from 55 week EMA is maintaining bearishness in the pair. Also, at this point, as long as 1.3444 resistance holds, fall from 1.7190 is still expected to continue. Break of above mentioned 1.2614 support will affirm this bearish case.
Technical Outlook: GBPUSD – Friday’s Long Red Candle Weighs And Risks Fresh Downside After Correction
Cable is consolidating above 1.2800 handle on Monday, following Friday's strong fall. Strong bearish acceleration was triggered after thick weekly cloud repeatedly capped bull-leg from 1.2365. Dip found footstep at 1.2775 and managed to close above 1.2786 pivot (Fibo 38.2% of 1.2356/1.3047 upleg), sidelining immediate downside risk.
However, Friday's long bearish candle continues to weigh, with daily studies losing traction and seeing risk of further easing.
Current action could be seen as positioning for fresh easing with extended upticks seen on oversold slow stochastic on daily chart, expected to stay capped under converged 20/10 SMA's (1.2926/35 respectively). Bearish continuation requires close below Fibo 1.2786 support to open way for extension towards 55SMA (1.2694) and daily cloud top at 1.2656.
Conversely, sustained break above 20/10SMA's would signal an end of corrective phase from 1.3047 (18 May peak).
Res: 1.2866, 1.2895, 1.2911, 1.2935
Sup: 1.2786, 1.2775, 1.2694, 1.2656
USD/CHF Daily Outlook
Daily Pivots: (S1) 0.9707; (P) 0.9722; (R1) 0.9745; More.....
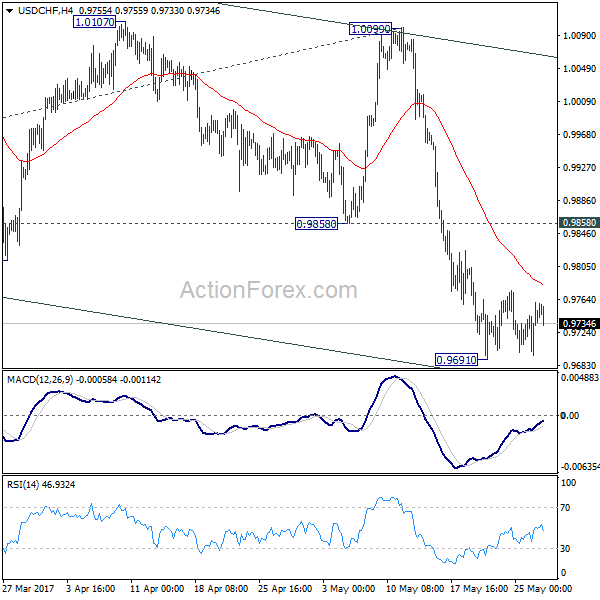
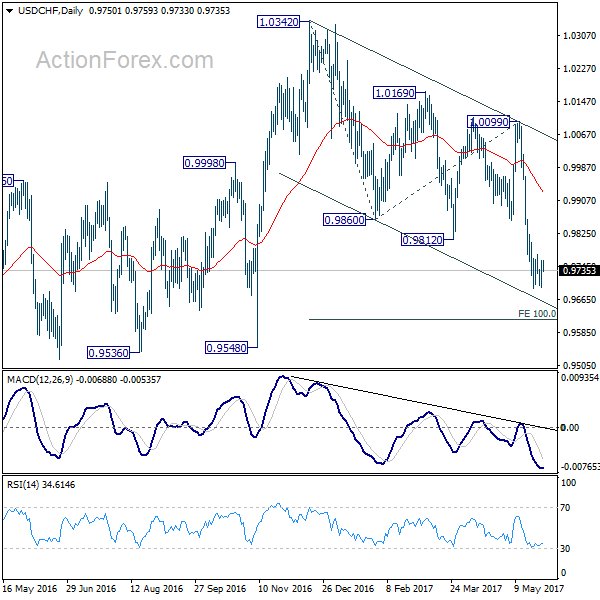
Intraday bias in USD/CHF remains neutral at this point. Consolidation from 0.9691 could extend and stronger recovery cannot be ruled out. But upside should be limited by 0.9858 support turned resistance and bring fall resumption. Whole decline from 1.0342 is still in progress and below 0.9691 will target 100% projection of 1.0342 to 0.9860 from 1.0099 at 0.9617. We'll start to look for reversal signal below there.
In the bigger picture, USD/CHF is bounded in medium term range of 0.9443/1.0342 for the moment. Consolidative trading would likely continue and medium term outlook remains neutral. Break of 1.0342 key resistance is needed to confirm underlying bullish momentum in the pair. Meanwhile, downside attempts should be contained by 0.9443 key support level.
Technical Outlook: EURUSD – Risk Of Extended Pullback On Break Below 10SMA
The Euro was in red in Asia on Monday, probing below rising 10SMA (1.1173) and pressuring Friday's low at 1.1160.
Near-term studies turned negative and keep the downside at risk as slow stochastic on daily chart is heading south and showing more room at the downside.
Also, red weekly candle with long upper shadow weighs on near-term action.
Firm break below Friday's low would risk extension towards next key support at 1.1100 (Fibo 38.2% of 1.0839/1.1268 upleg) where extended correction should be ideally contained.
The pair is currently ridding on the fourth (corrective) wave of five-wave cycle from 1.0820 (24 Apr low) which should ideally end at 1.1100 zone and support scenario of fresh upside attempts after correction as overall structure is bullish.
Upside targets remain at 1.1268 (23 May high) and 1.1299 (09 Nov 2016) post US election high).
Alternatively, firm break below 1.1100 pivot would risk deeper correction and expose Fibo supports at 1.1053 and 1.1000.
ECB President Mario Draghi is due to speak later today and may move the pair if he says something new and apart from his usual rhetoric.
Res: 1.1183, 1.1234, 1.1250, 1.1268
Sup: 1.1160, 1.1100, 1.1086, 1.1053
USD/JPY Daily Outlook
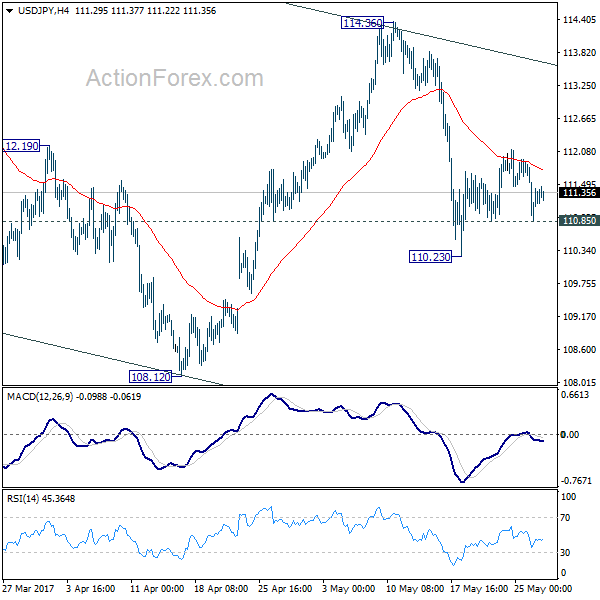
Daily Pivots: (S1) 110.84; (P) 111.34; (R1) 111.82; More...
Intraday bias in USD/JPY remains neutral at this point. Rise from 110.23 is seen as a correction and the larger fall is expected to resume later. On the downside, below 110.85 minor support will turn bias to the downside to extend the fall from 114.36 to 108.12 low. Break there will resume the whole decline from 118.65. In that case, we'll look for bottoming signal again at 61.8% retracement of 98.97 to 118.65 at 106.48.
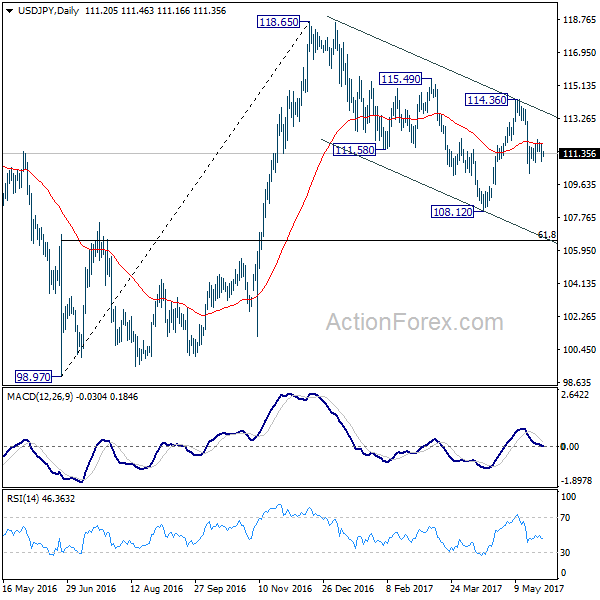
In the bigger picture, price actions from 125.85 high are seen as a corrective pattern. It's uncertain whether it's completed yet. But in case of another fall, downside should be contained by 61.8% retracement of 75.56 to 125.85 at 94.77 to bring rebound. Overall, rise from 75.56 is still expected to resume later after the correction from 125.85 completes.
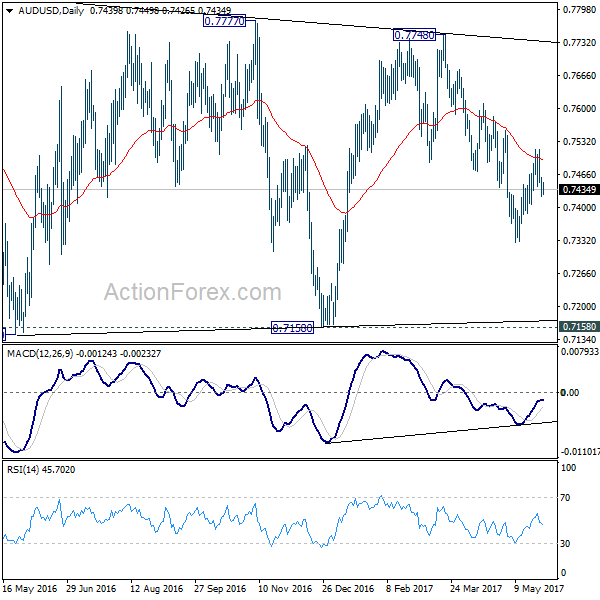
AUD/USD Daily Outlook
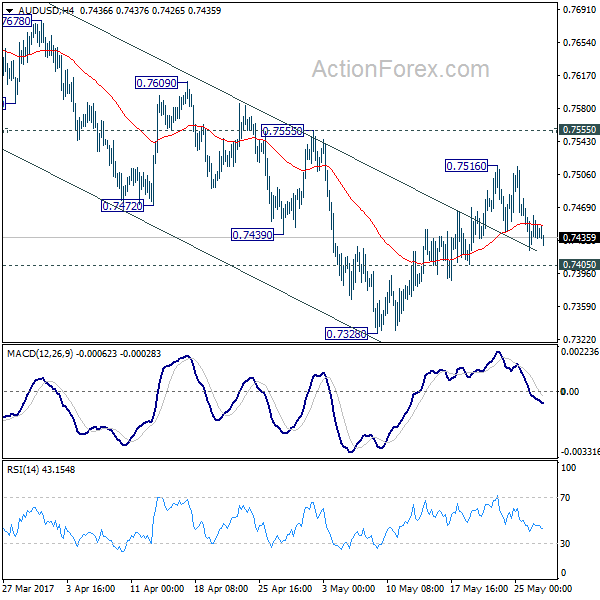
Daily Pivots: (S1) 0.7423; (P) 0.7441; (R1) 0.7462; More...
Intraday bias in AUD/USD remains neutral for the moment. Overall, as long as 0.7555 resistance holds, fall from 0.7748 is still expected to continue. Below 0.7405 minor support will turn bias to the downside for 0.7382. Break there will target 0.7144/7158 support zone. However, firm break of 0.7555 will argue that fall from 0.7748 is completed and turn bias back to the upside.
In the bigger picture, we're still treating price actions from 0.6826 low as a corrective pattern. And, as long as 38.2% retracement of 0.9504 to 0.6826 at 0.7849 holds, long term down trend from 1.1079 is expected to resume sooner or later. Break of 0.6826 low will target 0.6008 key support level. However, firm break of 0.7849 will indicate that rise from 0.6826 is developing into a medium term rebound, rather than a sideway pattern. In such case, stronger rise should be seen to 55 month EMA (now at 0.8115) and above.
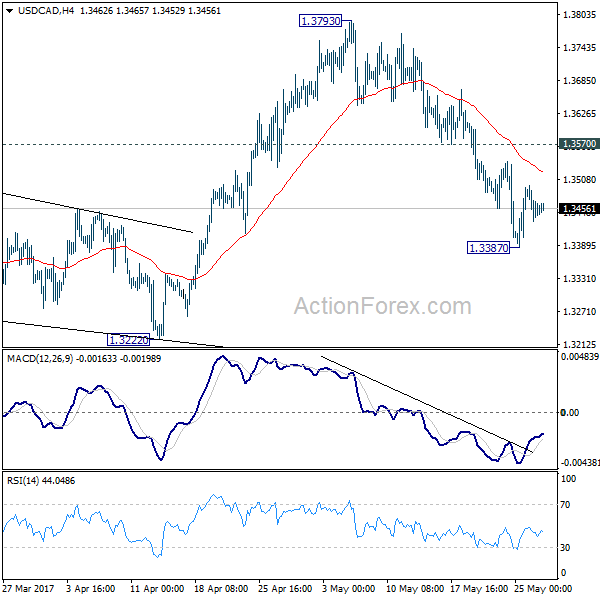
USD/CAD Daily Outlook
Daily Pivots: (S1) 1.3420; (P) 1.3458; (R1) 1.3485; More....
Intraday bias in USD/CAD remains neutral for the moment. Some consolidation would be seen above 1.3387 temporary low. But upside of recovery should be limited by 1.3570 resistance and bring fall resumption. At this point, we're still favoring the case that rise from 1.2968 has completed. And the larger rise from 1.2460 could have finished too. Below 1.3387 will target 1.3222 support first. Break of 1.3222 will affirm our bearish view and target 1.2968 key support level for confirmation. However, break of 1.3570 will turn focus back to 1.3793 high instead.
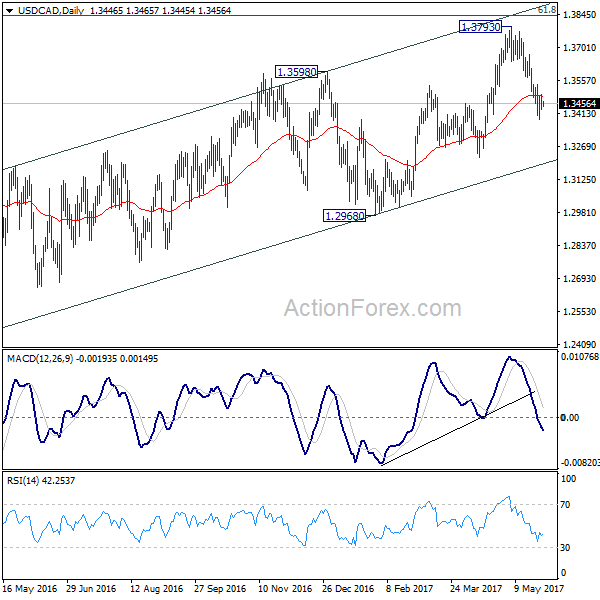
In the bigger picture, price actions from 1.4689 medium term top are seen as a correction pattern. The first leg has completed at 1.2460. Rise from 1.2460 is seen as the second leg and could have completed at 1.3793, ahead of 61.8% retracement of 1.4689 to 1.2460 at 1.3838. Break of 1.3222 should indicate the start of the third leg while further break of 1.2968 should confirm. Nonetheless, sustained trading above 1.3838 would pave the way to retest 1.4689 high.