Sample Category Title
Dollar Looks To A New Week, OPEC Meeting In Focus
The US dollar index will be looking to a fresh week with the possibility of a rebound following last week's sharp declines. On Friday, the US dollar edged lower with no major economic events to report.
Oil prices were back in the limelight ahead of this week's OPEC meeting on Thursday, 25 May 2017. The OPEC leaders and Russia are widely expected to extend the production cut until March 2018. Oil prices closed at $50.33, rising 2% by Friday's close.
Looking ahead, economic data today is light which puts Fed members Harker and Kashkari's speeches in the limelight.
EURUSD intraday analysis
The US dollar index will be looking to a fresh week with the possibility of a rebound following last week's sharp declines. On Friday, the US dollar edged lower with no major economic events to report.
Oil prices were back in the limelight ahead of this week's OPEC meeting on Thursday, 25 May 2017. The OPEC leaders and Russia are widely expected to extend the production cut until March 2018. Oil prices closed at $50.33, rising 2% by Friday's close.
Looking ahead, economic data today is light which puts Fed members Harker and Kashkari's speeches in the limelight.
USDJPY intraday analysis
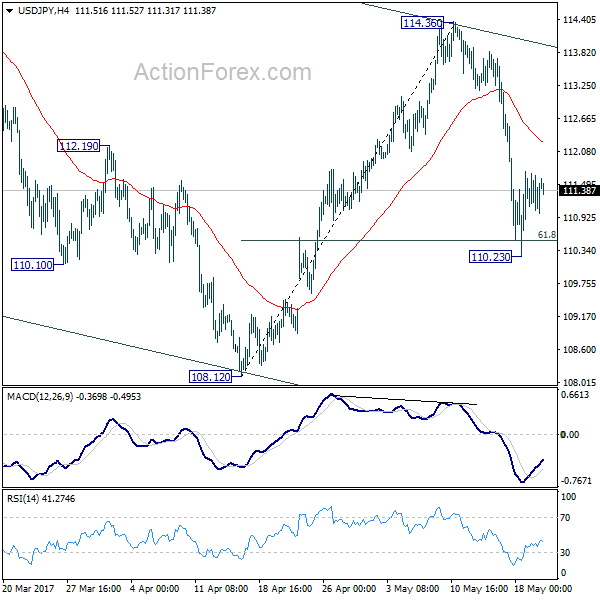
USDJPY (111.53): USDJPY has been pushing higher since the open today, although price action is clearly pointing to a bearish flag pattern as seen on the 4-hour chart.
Resistance is seen likely to form at 112.00 and only above this level can we expect to see some upside gains. To the downside, a break down from the bearish flag pattern is essential at 110.79 which will push the USDJPY lower towards the next immediate support at 109.50 and 109.00 levels.
XAUUSD intraday analysis
XAUUSD (1252.33): Gold prices continue to consolidate near the 1250 handle following last week's rally towards 1265 highs.
The rising wedge pattern on the daily chart remains in play which could potentially signal a move lower towards 1200.00 potentially. In the near term, gold prices remain range bound within 1263 and 1250 levels and a break down below one of these levels is needed to push gold prices further
Trade Idea : GBP/USD – Stand aside
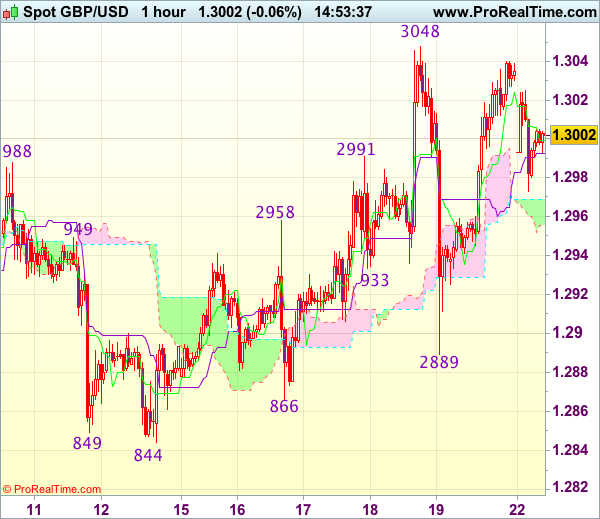
GBP/USD - 1.2995
Most recent candlesticks pattern : N/A
Trend : Near term up
Tenkan-Sen level : 1.2999
Kijun-Sen level : 1.2996
Ichimoku cloud top : 1.2969
Ichimoku cloud bottom : 1.2958
New strategy :
Stand aside
Position : -
Target : -
Stop : -
Despite staging a strong rebound from 1.2889 to 1.3040 on Friday, the subsequent retreat after faltering below last week’s high of 1.3048 suggest further choppy trading below this level would be seen and pullback to 1.2950-55 cannot be ruled out, however, reckon downside would be limited to 1.2920-25 and said support at 1.2889 should remain intact, bring another rebound later.
On the upside, expect recovery to be limited to 1.3020-25 and price should falter below said resistance at 1.3048, bring retreat later. Only a bream of said resistance at 1.3048 would confirm recent upmove has resumed an extend further gain to 1.3075-80 and possibly towards 1.3100-10 later. As near term outlook is mixed, would be prudent to stand aside in the meantime.
Trade Idea : EUR/USD – Stand aside
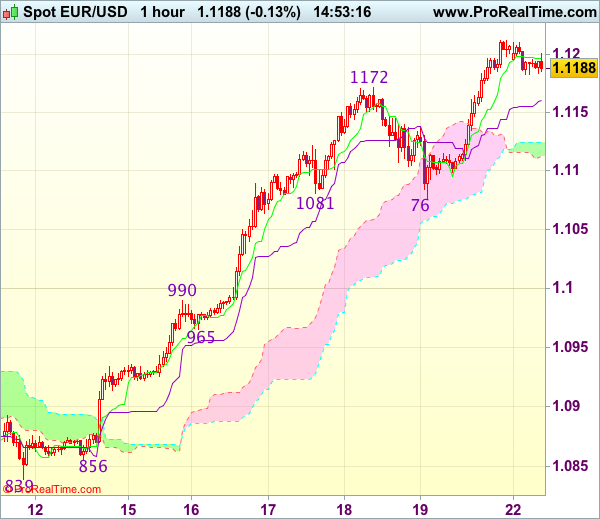
EUR/USD - 1.1186
Most recent candlesticks pattern : N/A
Trend : Up
Tenkan-Sen level : 1.1195
Kijun-Sen level : 1.1161
Ichimoku cloud top : 1.1124
Ichimoku cloud bottom : 1.1113
New strategy :
Stand aside
Position : -
Target : -
Stop : -
As the single currency has eased after rising to 1.1212 last week, suggesting consolidation below this level would be seen and pullback to the Kijun-Sen (now at 1.1161) is likely, below there would bring minor correction towards the upper Kumo (now at 1.1124, however, reckon downside would be limited to 1.1100 and bring another rise later, above said resistance would extend gain to 1.1240-45 (50% projection of 1.0839-1.1172 measuring from 1.1076) but loss of momentum should limit upside and reckon 1.1280-85 (61.8% projection) would hold from here, risk from there is seen for a retreat later.
In view of this, would not chase this rise here and would be prudent to stand aside in the meantime. Below the the lower Kumo (now at 1.1113) would suggest top is possibly formed, risk correction to 1.1076 support first, however, break there is needed to add credence to this view.
Trade Idea : USD/JPY – Sell at 112.05
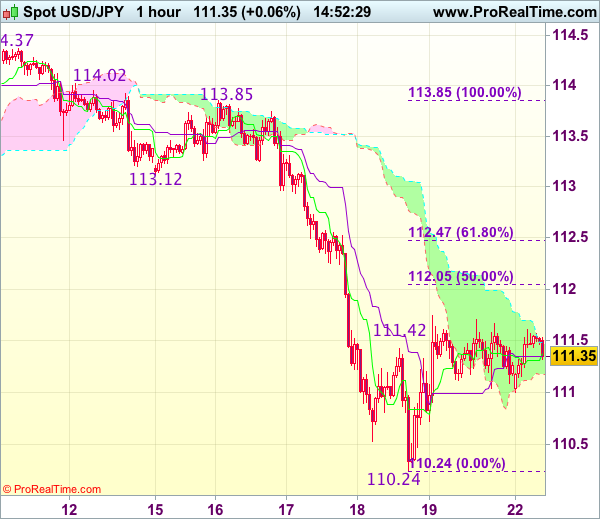
USD/JPY - 111.39
Most recent candlesticks pattern : N/A
Trend : Near term down
Tenkan-Sen level : 111.38
Kijun-Sen level : 111.35
Ichimoku cloud top : 111.49
Ichimoku cloud bottom : 111.18
Original strategy :
Sell at 112.05, Target: 110.85, Stop: 112.40
Position : -
Target : -
Stop : -
New strategy :
Sell at 112.05, Target: 110.85, Stop: 112.40
Position : -
Target : -
Stop : -
As the greenback found support at 110.24 last week and rebounded, retaining our view that further consolidation above this level would be seen and corrective bounce to 112.00-05 (50% Fibonacci retracement of 113.85-110.24) cannot be ruled out, however, reckon upside would be limited and bring another decline later, below 110.70-75 would suggest the rebound from 110.24 has ended, bring retest of this level first.
In view of this, would be prudent to sell dollar on further subsequent recovery as 112.05-10 should limit upside and bring another decline. Above 112.35-40 would defer and signal low is formed instead, risk a stronger rebound to 112.65-70.
EUR/USD Daily Outlook
Daily Pivots: (S1) 1.1130; (P) 1.1171 (R1) 1.1246; More....
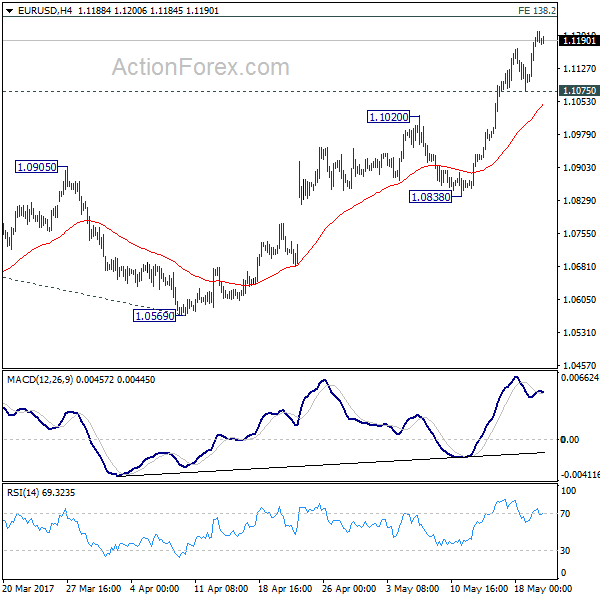
Intraday bias in EUR/USD remains on the upside for the moment. Current rise would target 138.2% projection of 1.0339 to 1.0828 from 1.0569 at 1.1245, which is close to 1.1298 key resistance. We'll stay cautious on strong resistance from 1.1245/98 to limit upside and bring reversal. Break of 1.1075 minor support will turn bias back to the downside for 1.0838 support. However, sustained break of 1.1298 will carry larger bullish implications.
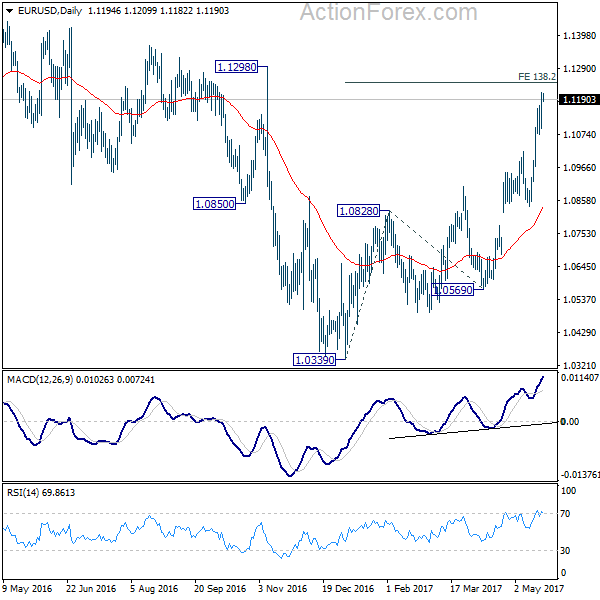
In the bigger picture, the case for medium term reversal continues to build up with EUR/USD now far above 55 week EMA. Also, bullish convergence condition is seen in weekly MACD. Focus will now be on 1.1298 key resistance. Rejection from there will maintain medium term bearishness and would extend the whole down trend from 1.6039 (2008 high). However, firm break of 1.1298 will indicate reversal. In such case, further rally would be seen back to 1.2042 support turned resistance next.
GBP/USD Daily Outlook
Daily Pivots: (S1) 1.2952; (P) 1.2995; (R1) 1.3075; More...
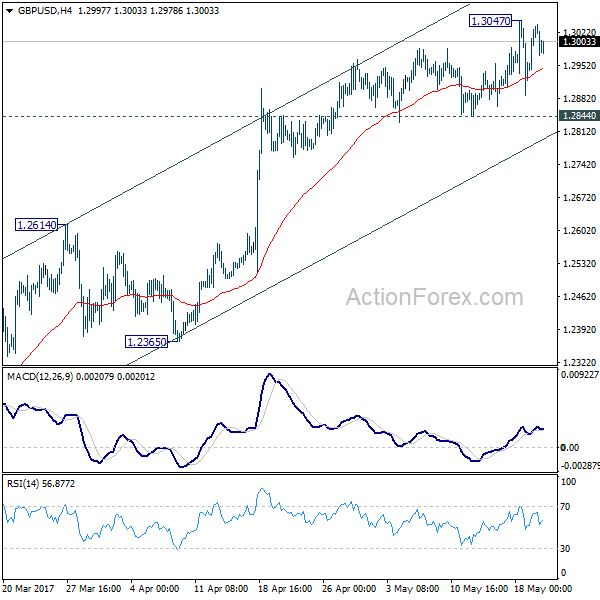
Intraday bias in GBP/USD remains neutral for the moment. with 1.2844 minor support intact, further rise is mildly in favor. However, as we are still viewing price actions from 1.1946 as a corrective move, we'd expect upside to be limited below 1.3444 resistance to bring near term reversal. On the downside, break of 1.2844 will indicate short term topping and turn bias back to the downside for 1.2614 resistance turned support first.
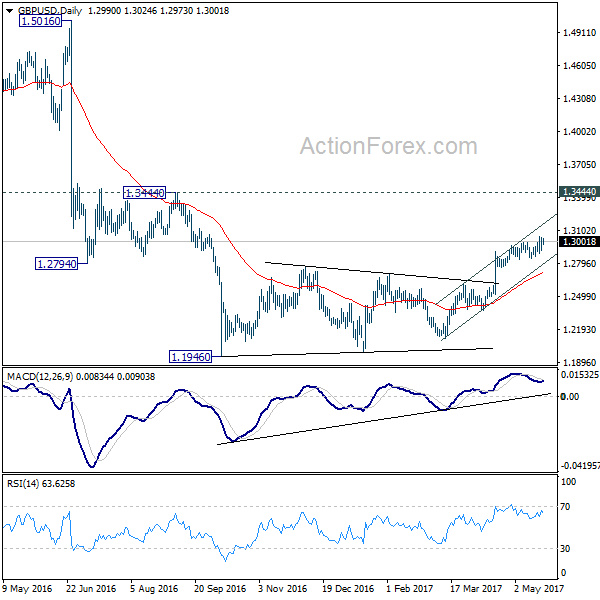
In the bigger picture, fall from 1.7190 is seen as part of the down trend from 2.1161. There are signs of reversal, like breaking of 55 week EMA, weekly MACD turned positive, and monthly MACD crossed above signal line. But still, break of 1.3444 resistance is need to confirm medium term bottoming. Otherwise, outlook will remains bearish for extend the down trend through 1.1946 low.
USD/CHF Daily Outlook
Daily Pivots: (S1) 0.9694; (P) 0.9749; (R1) 0.9778; More.....
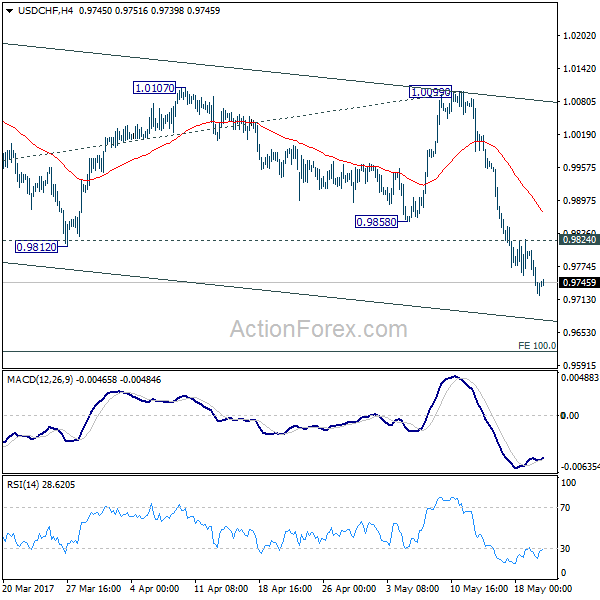
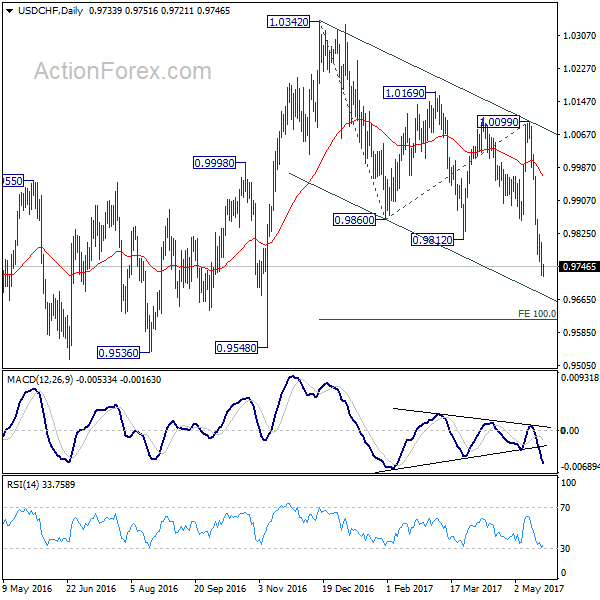
Intraday bias in USD/CHF remains on the downside for the moment. Current fall from 1.0342 should now target 100% projection of 1.0342 to 0.9860 from 1.0099 at 0.9617. We'll start to look for bottoming signal again below there. On the upside, above 0.9824 minor resistance will turn intraday bias neutral again and bring consolidations first, before staging another fall.
In the bigger picture, USD/CHF is bounded in medium term range of 0.9443/1.0342 for the moment. Consolidative trading would likely continue and medium term outlook remains neutral. Break of 1.0342 key resistance is needed to confirm underlying bullish momentum in the pair. Meanwhile, downside attempts should be contained by 0.9443 key support level.
USD/JPY Daily Outlook
Daily Pivots: (S1) 110.95; (P) 111.32; (R1) 111.62; More...
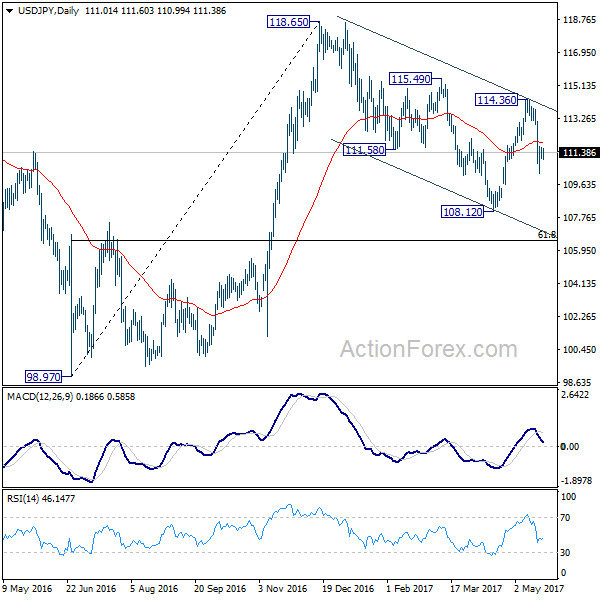
Intraday bias in USD/JPY remains neutral for consolidation above 110.23 temporary low. Overall, the development suggests that whole corrective decline from 118.65 is going to extend lower. Below 110.23 turn bias back to the downside and send USD/JPY through 108.12 low. In that case, we'll look for bottoming signal again at 61.8% retracement of 98.97 to 118.65 at 106.48.
In the bigger picture, price actions from 125.85 high are seen as a corrective pattern. It's uncertain whether it's completed yet. But in case of another fall, downside should be contained by 61.8% retracement of 75.56 to 125.85 at 94.77 to bring rebound. Overall, rise from 75.56 is still expected to resume later after the correction from 125.85 completes.
Daily Technical Analysis: EURUSD, GBPUSD, USDJPY, USDCHF
EURUSD
The EURUSD had a bullish momentum last week topped at 1.1211. The bias is bullish in nearest term testing 1.1300 – 1.1350 area. Immediate support is seen around 1.1175 – 1.1150. A clear break below that area could trigger further bearish pullback testing 1.1080 but overall I remain bullish and any downside pullback should be seen as a good opportunity to buy. On the upside, a clear break and daily close above 1.1350 could trigger further bullish pressure testing 1.1600 region this week (weekly EMA 200).
GBPUSD
The GBPUSD had a bullish momentum last week topped at 1.3047. Price gaps lower earlier today opened at 1.2997 and hit 1.2973. The bias is neutral in nearest term but overall I remain bullish. Immediate support is seen around 1.2970. A clear break below that area could trigger further bearish pressure testing 1.2945 and the trend line support (see my H1 chart below) located around 1.2900 region which is a good place to buy with a tight stop loss. On the upside, a clear break and daily close above 1.3050 would expose 1.3185 region.
USDJPY
The USDJPY had a bearish momentum last week bottomed at 110.23 but closed higher at 111.25 and hit 111.60 earlier today in Asian session. The bias is bullish in nearest term testing 112.00 and the trend line resistance as you can see on my H4 chart below, which is a good place to sell targeting 108.13 area with a tight stop loss above the trend line resistance. Immediate support is seen around 111.00. A clear break below that area could lead price to neutral zone in nearest term testing 110.50 or lower. On the upside, a clear break back above the trend line resistance would activate my wait and see mode as direction would become unclear.
USDCHF
The USDCHF had a bearish momentum last week bottomed at 0.9725. The bias is bearish in nearest term testing 0.9650 area as a part of the false breakout bearish scenario as you can see on my H4 chart below. Immediate resistance is seen around 0.9750. A clear break above that area could lead price to neutral zone in nearest term testing 0.9813/55 resistance area which is a good place to sell with a tight stop loss.
USD/CAD Daily Outlook
Daily Pivots: (S1) 1.3474; (P) 1.3542; (R1) 1.3577; More....
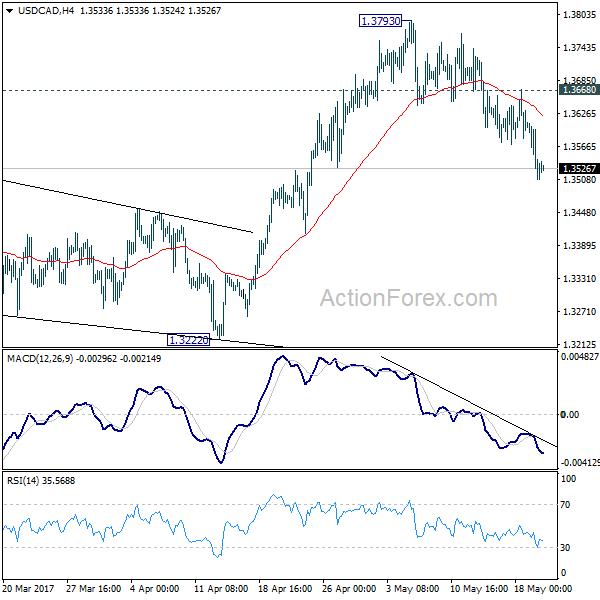
Intraday bias in USD/CAD remains on the downside for the moment. Rise from 1.2968 should be completed at 1.3793, ahead of 1.3838 key fibonacci resistance. Deeper fall would be seen for 1.3222 support next. Also, the corrective rally from 1.2460 could have finished too, ahead of 1.3838 fibonacci level. Break of 1.3222 will affirm this case and target 1.2968 key support level for confirmation. On the upside, break of 1.3668 minor resistance is needed to indicate completion of the fall from 1.3793. Otherwise, outlook will remain cautiously bearish in case of recovery.
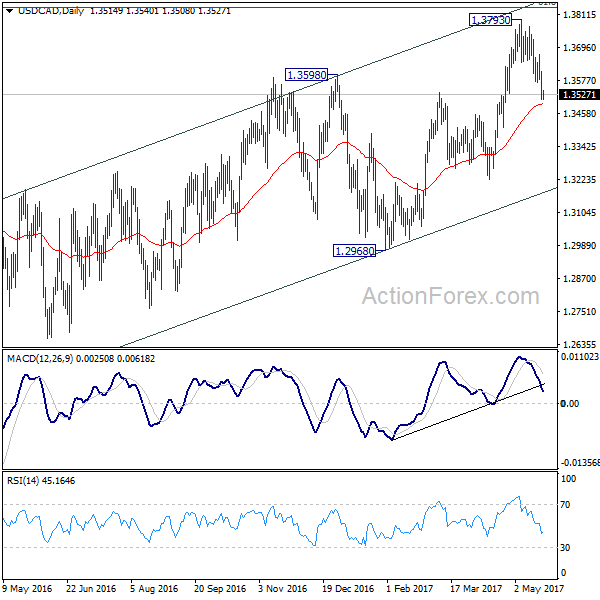
In the bigger picture, price actions from 1.4689 medium term top are seen as a correction pattern. The first leg has completed at 1.2460. Rise from 1.2460 is seen as the second leg and would end at around 61.8% retracement of 1.4689 to 1.2460 at 1.3838. Break of 1.3222 should indicate the start of the third leg while further break of 1.2968 should confirm. Nonetheless, sustained trading above 1.3838 would pave the way to retest 1.4689 high.