Sample Category Title
GBP/CHF Elliott Wave Analysis
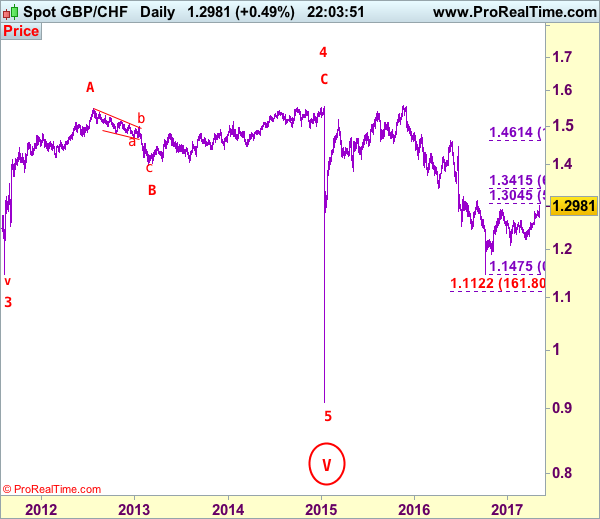
GBP/CHF – 1.2978
GBP/CHF – Circle wave v ended at 0.9106 and major correction has commenced for subsequent gain to 1.5547.
As sterling has surged again after brief pullback to 1.2729 late last week and price finally broke above indicated previous resistance at 1.2915, adding credence to our view that another leg of corrective upmove from 1.1475 low is underway, hence further gain to 1.3000, then 1.3045-50 (50% Fibonacci retracement of 1.4614-1.1475) and possibly towards previous chart resistance at 1.3122 would be seen, however, near term overbought condition should limit upside and reckon 1.3190-00 would hold from here.
To recap the larger degree count, the selloff from 2.4965 (July 2007) is the beginning of wave V with circle and is labeled as 1: 2.3760, 2: 2.4425, wave 3 extension ended at 1.1470, followed by wave 4 at 1.5547, the quick rebound from 0.9106 suggests wave 5 as well as entire circle wave V could have ended there, hence consolidation with mild upside bias is seen for major correction to take place, bring initial test of 1.5547 (previous 4th of a lesser degree).
On the downside, whilst initial pullback to 1.2940-50 cannot be ruled out, reckon downside would be limited to 1.2890-00 and bring another rise later. Below 1.2800-10 would defer and risk weakness towards said support at 1.2729 but only a drop below this level would signal a temporary top is formed instead, bring correction of recent upmove to 1.2690-95, then towards 1.2600-10 which is likely to contain sterling’s downside.
Recommendation: Buy at 1.2895 for 1.3150 with stop below 1.2795.
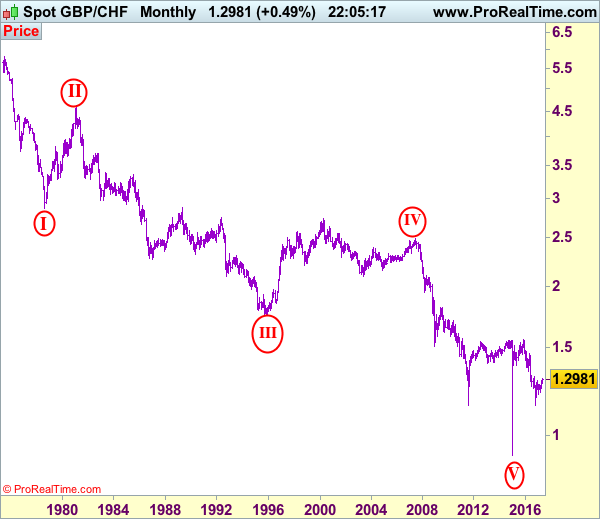
On the Monthly chart, the longer-term count is that major downtrend is under way with circle wave I at 2.8645 (Sep 1.978), then wave II with circle at 4.6175 (Feb 1981), the wave III with circle ended at 1.7425 (Nov 1995) and followed by wave IV with circle at 2.4965 (July 2007 with a short wave C) and wave V with circle has possibly ended at 0.9106. A monthly close above 1.5547 would add credence to this view, bring major correction to 1.7000, then towards psychological level at 2.0000.
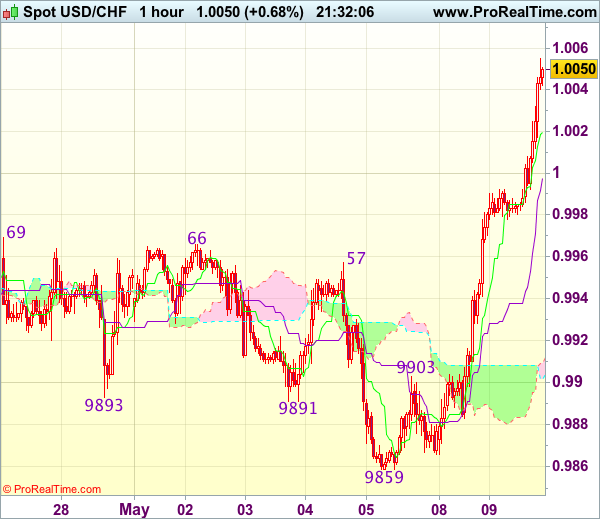
Trade Idea Update: USD/CHF – Buy at 0.9980
USD/CHF - 1.0043
Original strategy :
Buy at 0.9955, Target: 1.0055, Stop: 0.9920
Position : -
Target : -
Stop : -
New strategy :
Buy at 0.9980, Target: 1.0080, Stop: 0.9945
Position : -
Target : -
Stop : -
As the greenback has rallied yesterday and broke above indicated resistance at 0.9966-69, adding credence to our view that low has been formed at 0.9859 and suggesting recent decline from 1.0108 top has ended, hence consolidation with upside bias remains for further gain to 1.0067 resistance, however, near term overbought condition should prevent sharp move beyond previous resistance at 1.0090 and price should falter below chart point at 1.0108, bring retreat later.
In view of this, we are looking to buy dollar on dips as 0.9980 should limit downside. Below previous resistance at 0.9957 would defer and suggest top is possibly formed, bring test of 0.9920-25 but break of previous resistance at 0.9903 is needed to add credence to this view, brig further fall to 0.9880-85.
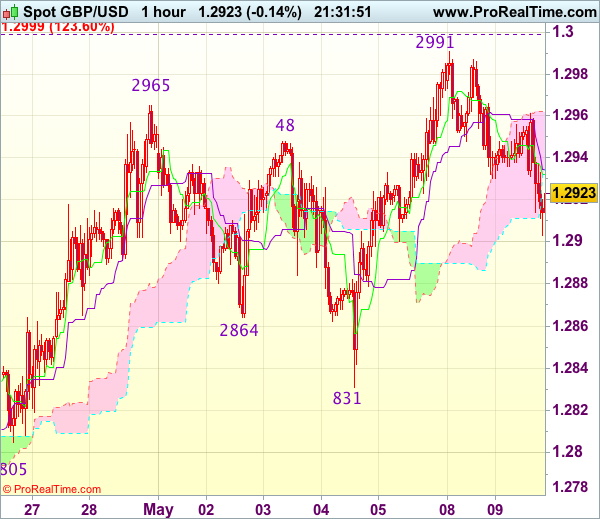
Trade Idea Update: GBP/USD – Sell at 1.2960
GBP/USD - 1.2931
Original strategy :
Sell at 1.2960, Target: 1.2860, Stop: 1.2995
Position : -
Target : -
Stop : -
New strategy :
Sell at 1.2960, Target: 1.2860, Stop: 1.2995
Position : -
Target : -
Stop : -
Although cable rose to as high as 1.2991 yesterday, the subsequent retreat suggests consolidation below this level would be seen and pullback to 1.2900-10 is likely, however, break there is needed to suggest top is possibly formed, bring further fall to 1.2875-80 but price should stay well above last week’s low at 1.2831, risk from there is seen for another rebound later.
In view of this, we are looking to turn short on recovery. Above said resistance at 1.2991 would extend recent upmove to 1.2999-00 (1.236 times projection of 1.2109-1.2616 measuring from 1.2365 and psychological resistance), then towards 1.3040-50 which is likely to hold from here due to near term overbought condition.
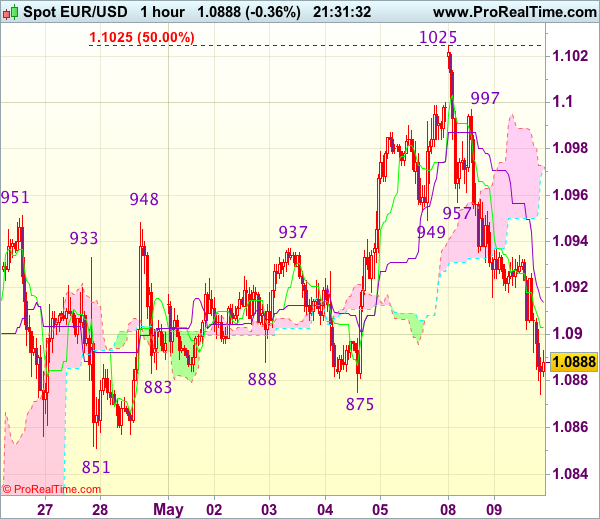
Trade Idea Update: EUR/USD – Sell at 1.0970
EUR/USD - 1.0893
Original strategy :
Sell at 1.0970, Target: 1.0870, Stop: 1.1005
Position : -
Target : -
Stop : -
New strategy :
Sell at 1.0970, Target: 1.0870, Stop: 1.1005
Position : -
Target : -
Stop : -
Euro’s selloff after yesterday’s initial brief rise to 1.1025 suggests top has been formed there and consolidation with mild downside bias is seen for further fall to 1.0875 support, however, a sustained break below there is needed to add credence to this view, bring retracement of recent rise to 1.0851 support and possibly towards 1.0825-30 but reckon 1.0800 would hold from here due to near term overbought condition.
In view of this, we are looking to sell euro on recovery as 1.0970-80 should limit upside. Above resistance at 1.0997 would bring retest of said yesterday’s high at 1.1025, however, break there is needed to signal recent upmove from 1.0340 low has resumed for headway to 1.1050 but reckon upside would be limited to 1.1065-70 (61.8% projection of 1.0602-1.0951 measuring from 1.0851).
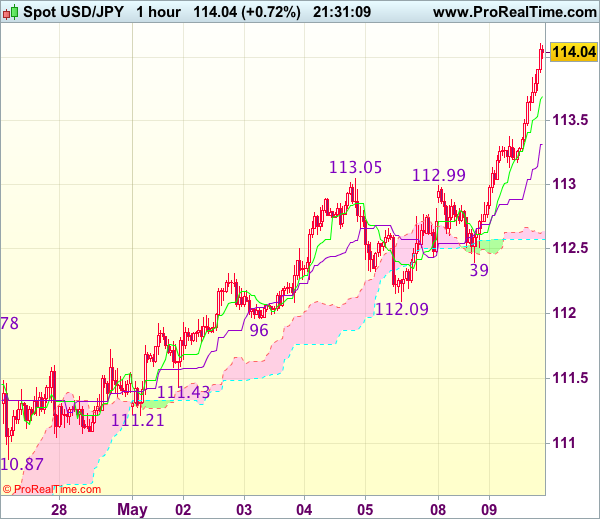
Trade Idea Update: USD/JPY – Buy at 113.35
USD/JPY - 114.09
Original strategy :
Buy at 113.10, Target: 114.10, Stop: 112.75
Position : -
Target : -
Stop : -
New strategy :
Buy at 113.35, Target: 114.45, Stop: 113.00
Position : -
Target : -
Stop : -
As dollar’s upmove has gathered momentum, suggesting recent upmove is still in progress and bullishness remains for further gain to 114.25-30 (100% projection of 110.87-113.05 measuring from 112.09) and then 114.50-55 (100% projection of 108.13-111.78 measuring from 110.87), however, near term overbought condition should limit upside to 114.75-80 and price should falter below 115.00, bring retreat later.
In view of this, would not chase this rise here and would be prudent to buy dollar on pullback as the Kijun-Sen (now at 113.31) should contain downside. Only below previous resistance at 113.05 would defer and suggest top is formed, bring correction of recent upmove to 112.70-80 but reckon support at 112.39 would remain intact.
WTI Tests Major Support Zone Ahead of OPEC Meeting
The US shale oil industry has seen a marked recovery since February last year because of higher oil prices. The US Baker Hughes data, that records the number of new Oil Rigs, is showing additional Rigs added every week. The increase in shale oil supply has offset OPEC's recent output cut effort to an extent.
However, the Saudi Arabia Oil Minister, Khalid al-Falih, stated on Monday May 8, at the Asia Oil and Gas Conference in Malaysia that "the output cut could be extended another 6 months or even further into 2018". OPEC will hold a meeting in Vienna on May 25 where the decision whether to extend the output cut agreement will likely be announced.
WTI has retraced substantially around 12.88% since April 12 as prices have reached a mid-term major resistance zone, where there is heavy selling pressure.
Notably, the downtrend was held since last Frida, as it was trading at a mid-term major support zone between $43 – $45 where there is stronger support.
On the 4-hourly chart, the price has moved from the lower Bollinger band to the middle Bollinger band, suggesting the recent bearish momentum is waning.
If a firm extension decision is made after the meeting then it will likely result in a rebound in oil prices. Conversely, if no further extension is made, it will likely result in further falling of oil prices.
The resistance is at $47.00, followed by $47.50 and $48.00.
The support line is at $46.50, followed by $46.00 and $45.50.
The US EIA Crude Oil Inventories data (for the week ending May 5) will be released at 15:30 BST on Wednesday May 10. Please be advised that this release is highly likely to cause volatility in oil prices.
USD/JPY Bearish Divergence Waiting For Sellers
The USD/JPY is in bullish trend following inverted SHS pattern on H4 chart. At this point we see bearish divergence looming at POC zone. POC zone 114.50-65 (W H5, Order block, historical sellers) could tank the price should we see a retracement into the zone. Adding to that, the ATR has already been overshot so the retracement is likely to happen. Targets are 114.00 and 113.50 (W H4 and M H4). Treat this setup as counter trend and a correction in an uptrend.
Trade Idea: GBP/USD – Sell at 1.2955
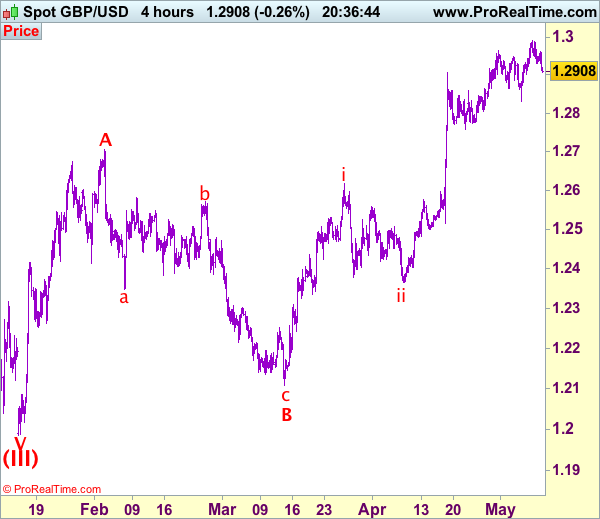
GBP/USD – 1.2918
Recent wave: Wave V of larger degree wave (III) has ended at 1.1986 and major correction has commenced from there for gain to 1.3000 and 1.3140-50
Trend: Near term up
Original strategy :
Buy at 1.2845, Target: 1.3025, Stop: 1.2785
Position: -
Target: -
Stop: -
New strategy :
Sell at 1.2955, Target: 1.2775, Stop: 1.3015
Position: -
Target: -
Stop:-
As cable has retreated after rising to 1.2995 yesterday, suggesting consolidation below this level would be seen with mild downside bias for minor correction to 1.2900 support, break there would bring further fall towards 1.2831 support, however, a break below this level is needed to signal a temporary top has been formed at 1.2995, bring retracement of recent rise to 1.2770-75 but previous support at 1.2757 should hold from here. We are keeping our view that the wave c as well as larger degree wave B has ended at 1.2109, hence impulsive wave C has commenced from there with wave i of C ended at 1.2616, follow by a correction to 1.2365 (end of wave ii) and wave iii rally is unfolding.
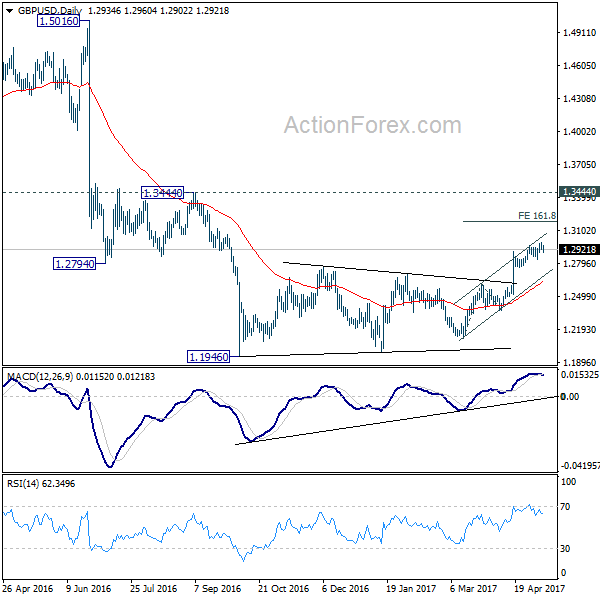
Our preferred count on the daily chart is that cable's rebound from 1.3500 (wave (A) trough) is unfolding as a wave (B) with A ended at 1.7043, followed by triangle wave B and wave C as well as wave (B) has ended at 1.7192, the subsequent selloff is the larger degree wave (C) which is still unfolding with minor wave (III) of larger degree wave 3 ended at 1.1986, hence wave (IV) correction is in progress which could either be a triangle wave (IV) of a complex formation but upside should be limited to 1.3500 and price should falter well below 1.4000, bring another decline in wave (V) of 3 for weakness to 1.1500, then 1.1200.
On the upside, whilst recovery to 1.2950-55 cannot be ruled out, reckon said resistance at 1.2995 would cap upside and bring another retreat later. Above said resistance at 1.2995 would extend recent upmove to 1.3040-50 but overbought condition should limit upside to 1.3075-80 and price should falter below 1.3100.
EUR/USD Mid-Day Outlook
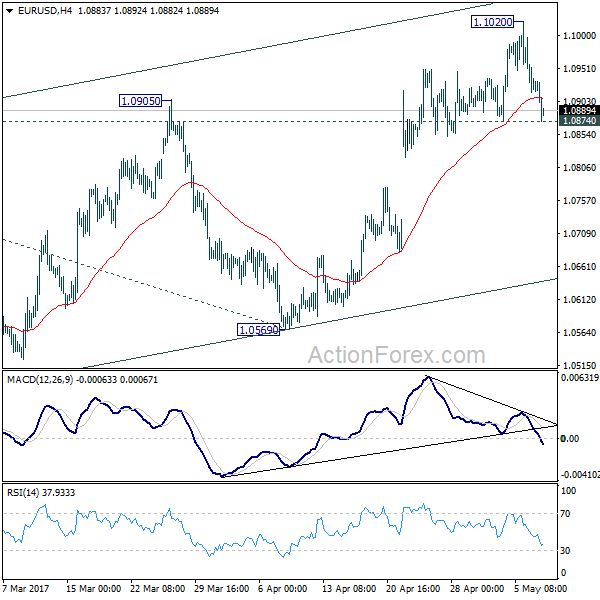
Daily Pivots: (S1) 1.0885; (P) 1.0953 (R1) 1.0991; More....
Intraday bias in EUR/USD remains neutral for consolidation below 1.1020 temporary top. Another rise will be expected as long as 1.0874 support holds. Above 1.1020 will extend current rally to 100% projection of 1.0339 to 1.0828 from 1.0569 at 1.1058. However, rise from 1.0339 is still seen as a corrective move. Hence we'd expect strong resistance from 1.1058 projection to limit upside and bring near term reversal. On the downside, break of 1.0874 support will turn bias back to the downside for 1.0569 support first.
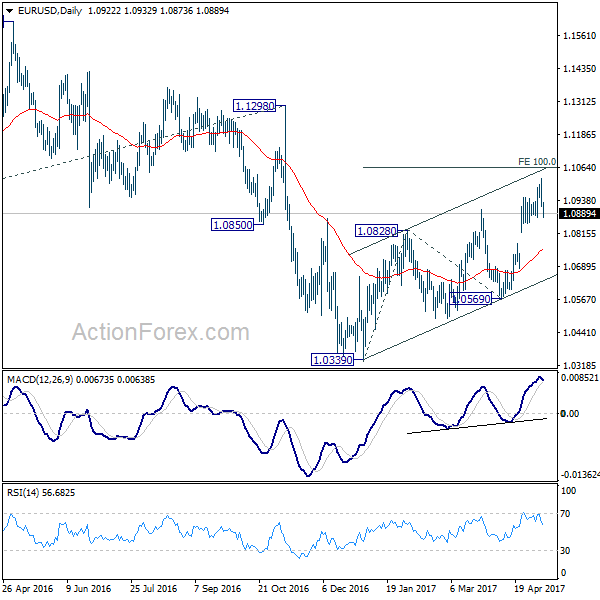
In the bigger picture, as long as 1.1298 key resistance holds, whole down trend from 1.6039 (2008 high) is still expected to continue. Break of 1.0339 low will send EUR/USD through parity to 61.8% projection of 1.3993 to 1.0461 from 1.1298 at 0.9115. However, considering bullish convergence condition in weekly MACD, break of 1.1298 will indicate long term reversal.
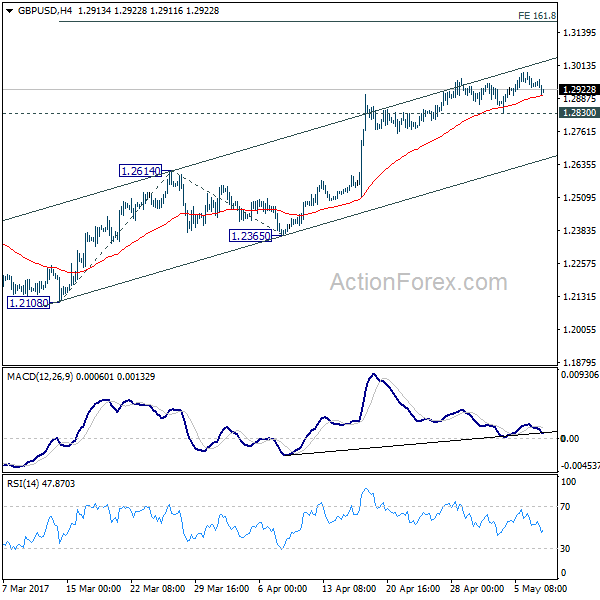
GBP/USD Mid-Day Outlook
Daily Pivots: (S1) 1.2917; (P) 1.2952; (R1) 1.2976; More...
No change in GBP/USD's outlook. With 1.2830 minor support intact, further rise is still expected. Current rally could target 161.8% projection of 1.2108 to 1.2614 from 1.2365 at 1.3184. At this point, price actions from 1.1946 are still interpreted as a correction pattern. Therefore, we'd expect strong resistance below 1.3444 to bring larger down trend resumption. On the downside, break of 1.2830 support will indicate short term topping. In such case, intraday bias will be turned back to the downside for 1.2614 support.
In the bigger picture, fall from 1.7190 is seen as part of the down trend from 2.1161. There is no sign of medium term reversal yet. Sustained trading below 61.8% projection of 2.1161 to 1.3503 from 1.7190 at 1.2457 will target 100% projection at 0.9532. Overall, break of 1.3444 resistance is needed to confirm medium term bottoming. Otherwise, outlook will remain bearish.