Sample Category Title
UK PMI composite unchanged at 50.5, triple whammy of growth, employment and inflation
UK PMI Manufacturing PMI slipped from 48.0 to 47.3, an 11-month low. Services PMI improved from 50.4 to 51.4. PMI Composite held steady at 50.5, signaling stagnation in overall economic activity.
Chris Williamson, Chief Business Economist at S&P Global Market Intelligence, described a "triple whammy" facing businesses: stalled growth, declining employment, and renewed inflationary pressures.
While the PMI suggests that the economy remained broadly stagnant in Q4, the outlook for 2025 appears increasingly uncertain. Weak confidence, labor market retrenchment, and inflation risks could weigh heavily on economic activity.
Williamson said BoE faces the difficult task of balancing support for growth against the need to maintain inflation control, suggesting a cautious approach to monetary easing in the coming months.
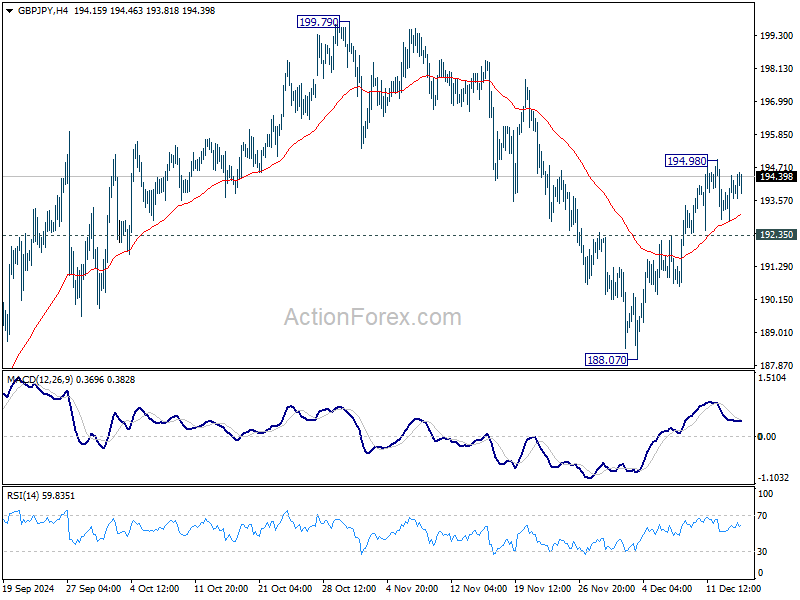
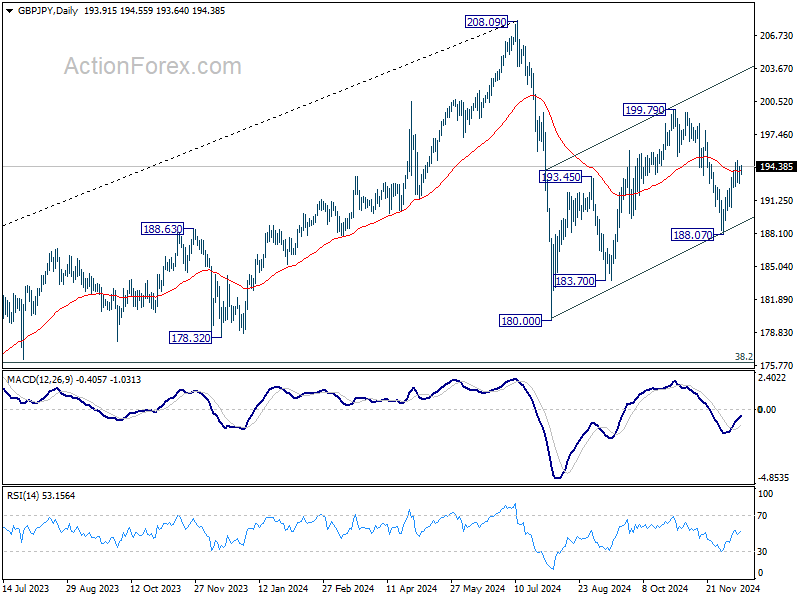
GBP/JPY Daily Outlook
Daily Pivots: (S1) 192.93; (P) 193.69; (R1) 194.53; More...
Intraday bias in GBP/JPY stays neutral as sideway trading continues. Corrective pattern from 180.00 could be extending with another rising level. Above 194.98 will extend the rise from 188.07 to 199.79 resistance. However, break of 192.35 will turn bias back to the downside for 188.07 instead.
In the bigger picture, price actions from 208.09 are seen as a correction to whole rally from 123.94 (2020 low). The range of consolidation should be set between 38.2% retracement of 123.94 to 208.09 at 175.94 and 208.09. However, decisive break of 175.94 will argue that deeper correction is underway.
EUR/JPY Daily Outlook
Daily Pivots: (S1) 160.16; (P) 160.86; (R1) 162.07; More...
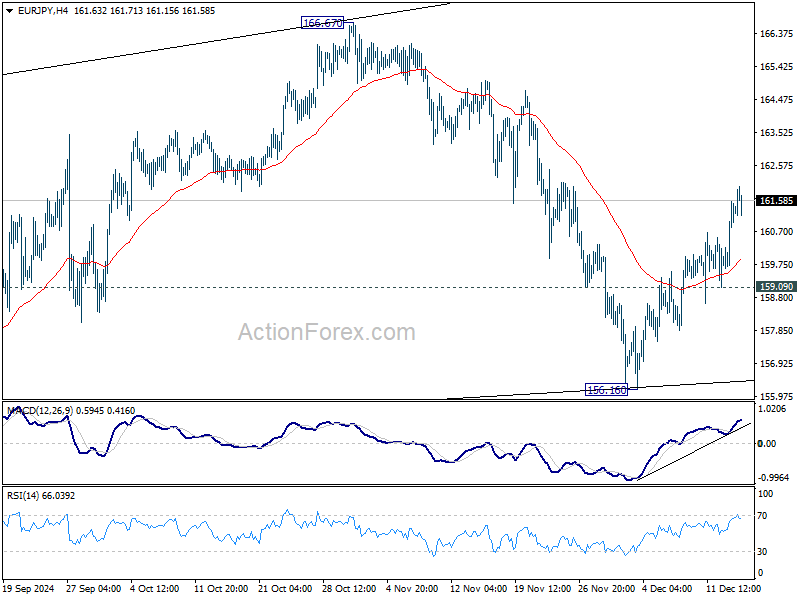
Intraday bias in EUR/JPY remains on the upside as rise from 156.16 is in progress. Sideway pattern from 154.40 might still be in progress, and is extending with another rising leg. Sustained break of 55 D EMA (now at 161.68) will pave the way to 166.67 resistance. On the downside, break of 159.09 support will turn bias back to the downside for 156.16 support instead.
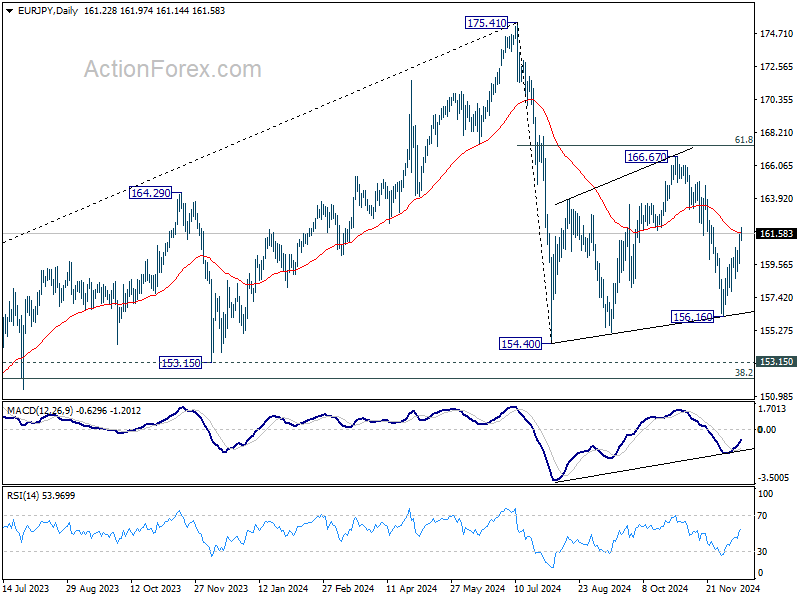
In the bigger picture, price actions from 175.41 are seen as correction to rally from 114.42 (2020 low). The range of consolidation should have been set between 38.2% retracement of 114.42 to 175.41 at 152.11 and 175.41 high. However, decisive break of 152.11 would argue that deeper correction is underway.
EUR/GBP Daily Outlook
Daily Pivots: (S1) 0.8273; (P) 0.8298; (R1) 0.8347; More...
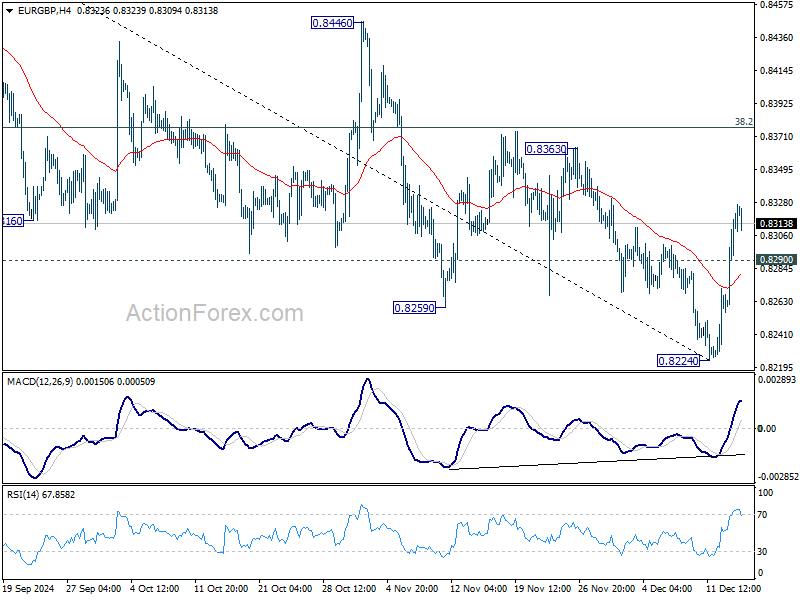
Intraday bias in EUR/GBP remains on the upside at this point. Rebound from 0.8224 short term bottom is in progress for 38.2% retracement of 0.8624 to 0.8224 at 0.8377. Firm break there will target 61.8% retracement at 0.8471, even as a corrective move. On the downside, break of 0.8290 minor support will bring retest of 0.8224 low instead.
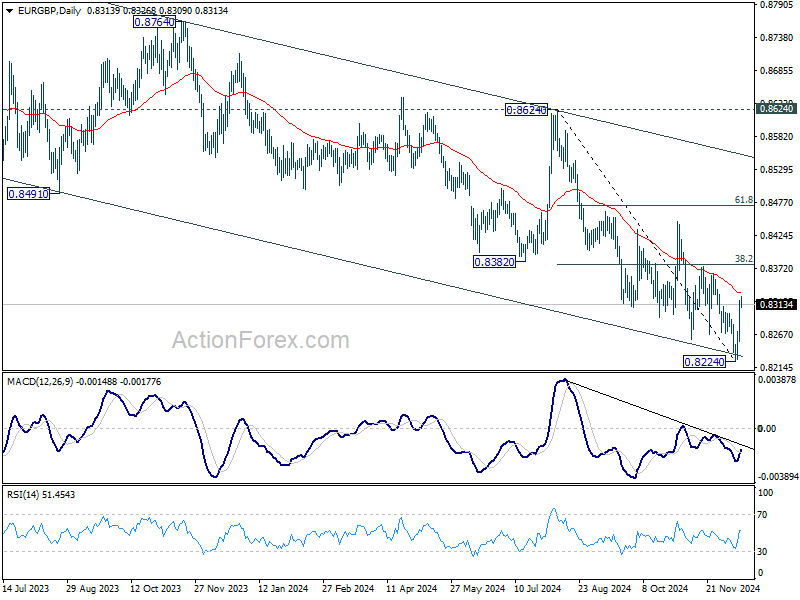
In the bigger picture, focus is now on whether 0.8201 key support (2022 low) is strong enough to complete the whole down trend from 0.9267 (2022 high). In any case, medium term outlook will be neutral at best until decisive break of 0.8624 key resistance. Otherwise, risk will stay on the downside even in case of strong rebound.
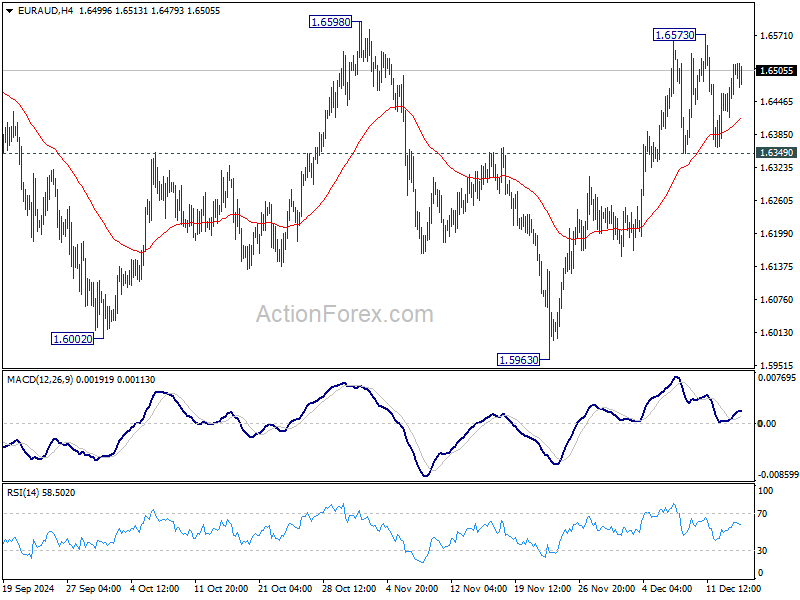
EUR/AUD Daily Outlook
Daily Pivots: (S1) 1.6434; (P) 1.6477; (R1) 1.6554; More...
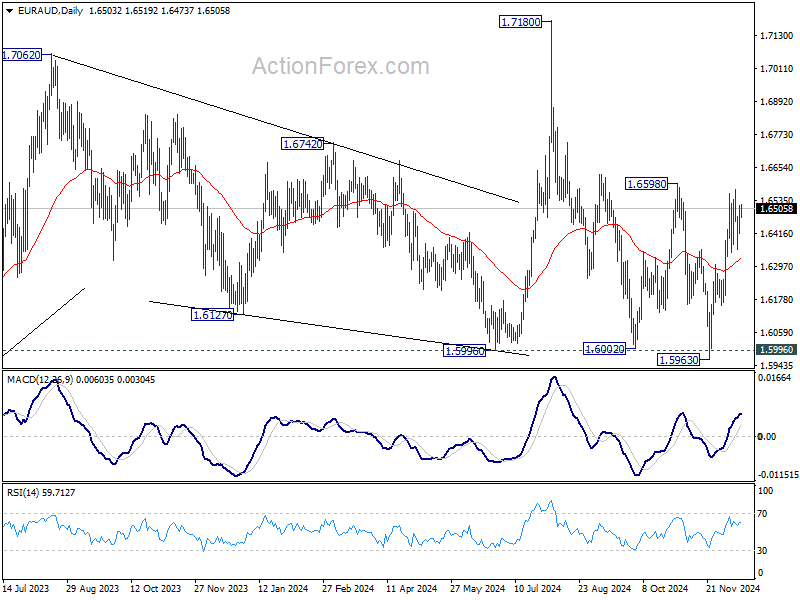
EUR/AUD is staying in range trading and intraday bias stays neutral. On the upside, decisive break of 1.6598 resistance should confirm that whole fall from 1.7180 has complete with three waves down to 1.5963. Further rise should then be seen to retest 1.7180 next. Nevertheless, sustained break of 1.6359 will indicate rejection by 1.6598, and turn bias back to the downside.
In the bigger picture, EUR/AUD is holding on to 1.5996 key support despite brief breach. Larger up trend from 1.4281 (2022 low) is still in favor to resume through 1.7180 at a later stage. Nevertheless, sustained break of 1.5995 will indicate that such up trend has completed. Deeper decline would be seen to 61.8% retracement of 1.4281 to 1.7180 at 1.5388, even as a correction.
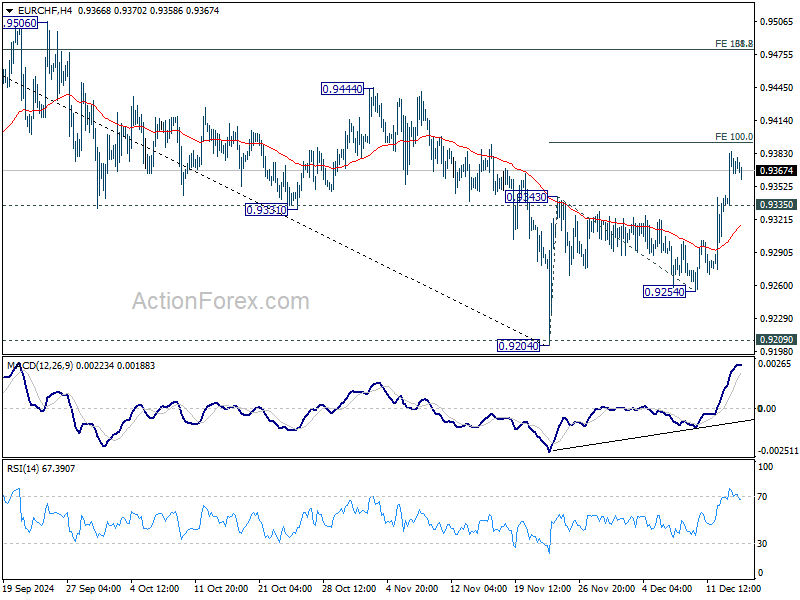
EUR/CHF Daily Outlook
Daily Pivots: (S1) 0.9346; (P) 0.9366; (R1) 0.9397; More....
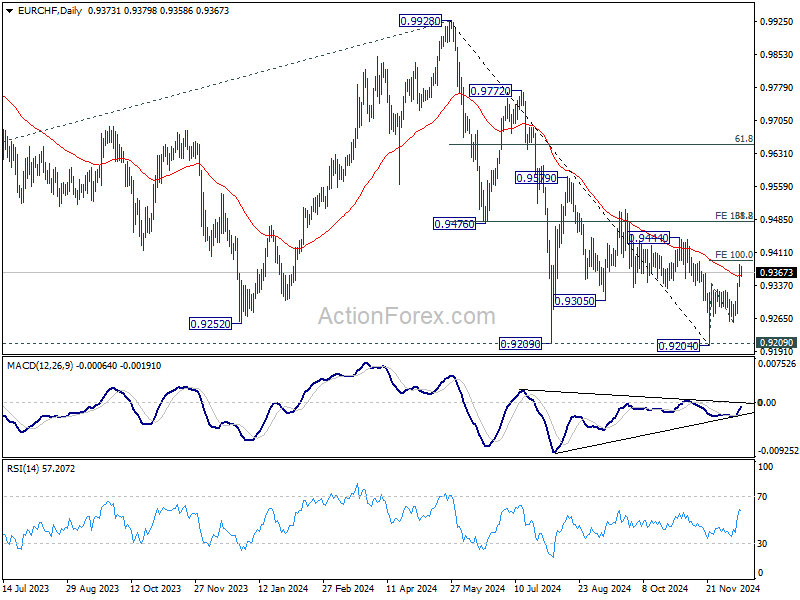
Intraday bias in EUR/CHF stays on the upside as rise from 0.9204 is in progress for 100% projection of 0.9204 to 0.9343 from 0.9254 at 0.9393. Decisive break there could prompt upside acceleration through 0.9444 resistance to 161.8% projection at 0.9479. On the downside, below 0.9335 minor support will turn intraday bias neutral first. But further rally will remain in favor as long as 0.9254 support holds.
In the bigger picture, the break of 55 D EMA (now at 0.9359) suggests that a medium term bottom might be in place already. Strong rise could be seen 38.2% retracement of 0.9928 to 0.9204 at 0.9481. Reaction from there would reveal whether rebound from 0.9204 is merely a corrective rise, or reversing the down trend from 0.9928.
Eurozone PMI improves to 49.5 with potential positive surprises from politics ahead
Eurozone PMI Services rose notably from 49.5 to 51.4, marking a return to expansion territory. However, PMI Manufacturing remained static at 45.2, firmly in contraction. Consequently, PMI Composite edged up from 48.3 to 49.5, signaling ongoing weakness in overall economic momentum.
Cyrus de la Rubia, Chief Economist at Hamburg Commercial Bank, noted that the service sector's rebound is a "welcome boost" to the Eurozone economy, while manufacturing continues to face a severe downturn.
Inflationary pressures remain a concern, particularly in the services sector. Input costs have risen for the third consecutive month, largely due to higher wage agreements, with businesses passing these costs onto customers. This persistent inflation challenge informed ECB's cautious decision earlier this month to cut rates by just 25bps.
Germany and France, the Eurozone’s largest economies, add to the uncertainty with ongoing political challenges, delaying necessary reforms to stimulate growth. Despite this, de la Rubia suggested there is potential for "positive surprises" in 2025 if clearer economic policies emerge from future governments.
EUR/USD Daily Outlook
Daily Pivots: (S1) 1.0463; (P) 1.0493; (R1) 1.0534; More...
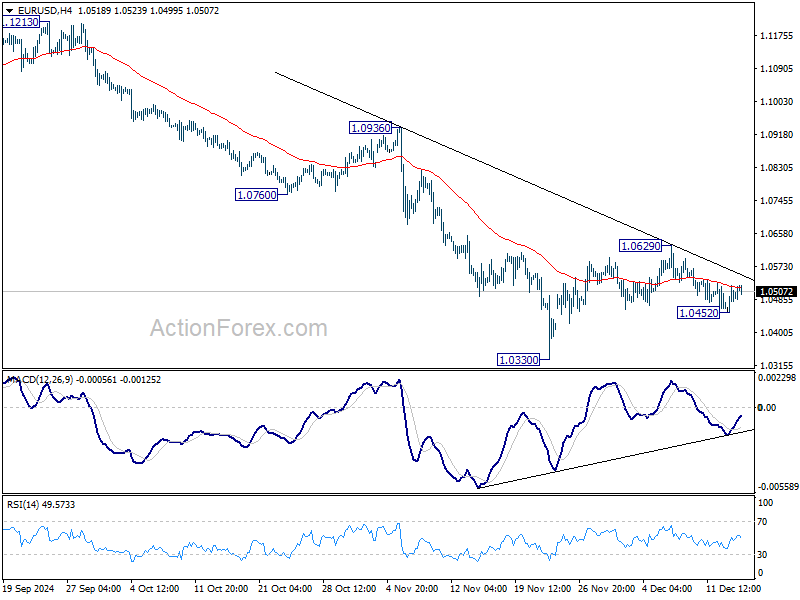
Intraday bias in EUR/USD remains neutral for the moment. Corrective pattern from 1.0330 might extend further. But outlook will stay bearish as long as 55 D EMA (now at 1.0678) holds. On the downside, below 1.0452 will bring retest of 1.0330 low.
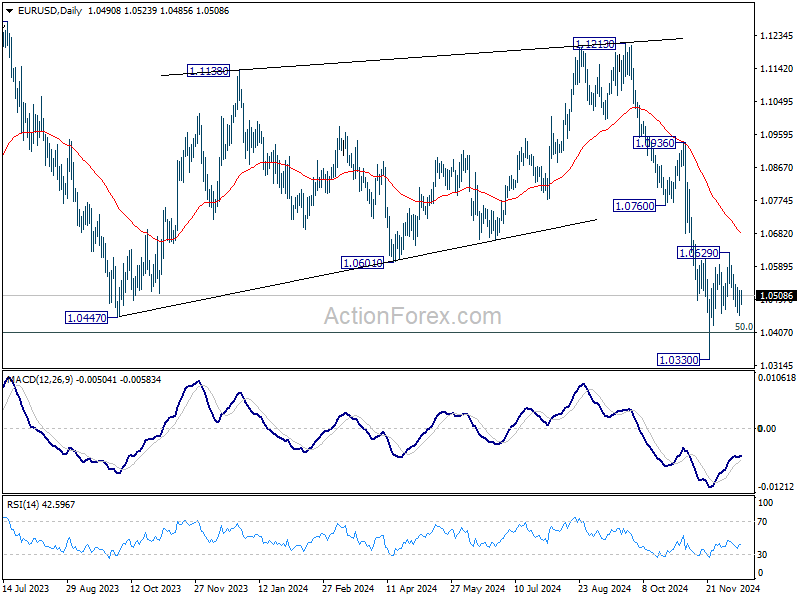
In the bigger picture, focus stays on 50% retracement of 0.9534 (2022 low) to 1.1274 at 1.0404. Strong rebound from this level will keep price actions from 1.1273 (2023 high) as a medium term consolidation pattern only. However, sustained break of 1.0404 will raise the chance that whole up trend from 0.9534 has reversed. That would pave the way to 61.8% retracement at 1.0199 first. Firm break there will target 0.9534 low again.
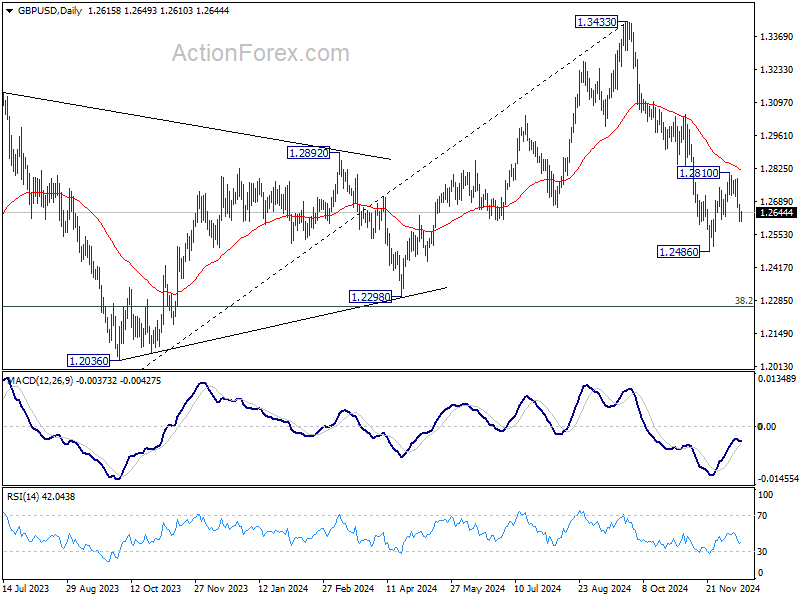
GBP/USD Daily Outlook
Daily Pivots: (S1) 1.2592; (P) 1.2638; (R1) 1.2668; More...
Intraday bias in GBP/USD remains neutral with focus on 1.2615 minor support. Corrective recovery from 1.2486 might have completed at 1.2810 already. Break of 1.2615 will resume the fall from 1.3433 through 1.2486 to 1.2298 cluster support zone.
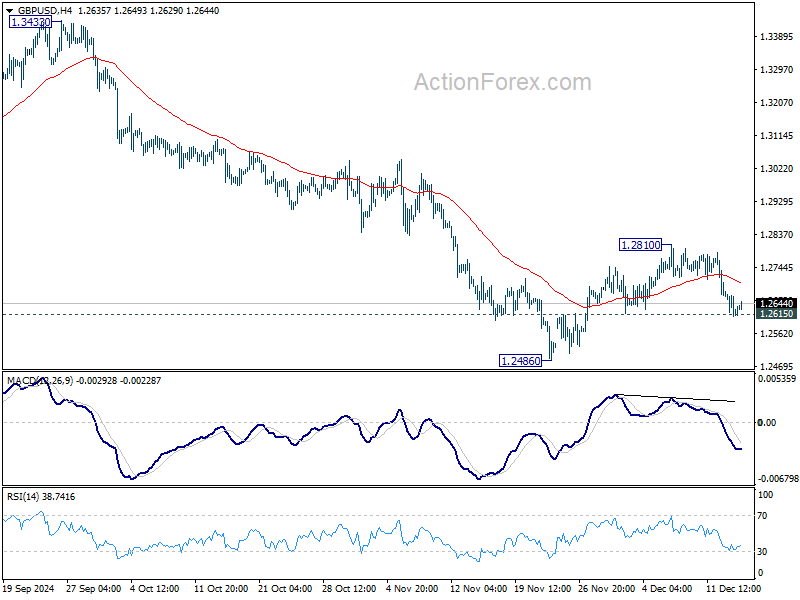
In the bigger picture, price actions from 1.3433 medium term are seen as correcting whole up trend from 1.0351 (2022 low). Deeper decline could be seen to 38.2% retracement of 1.0351 to 1.3433 at 1.2256, which is close to 1.2298 structural support. But strong support is expected there to bring rebound to extend the corrective pattern.
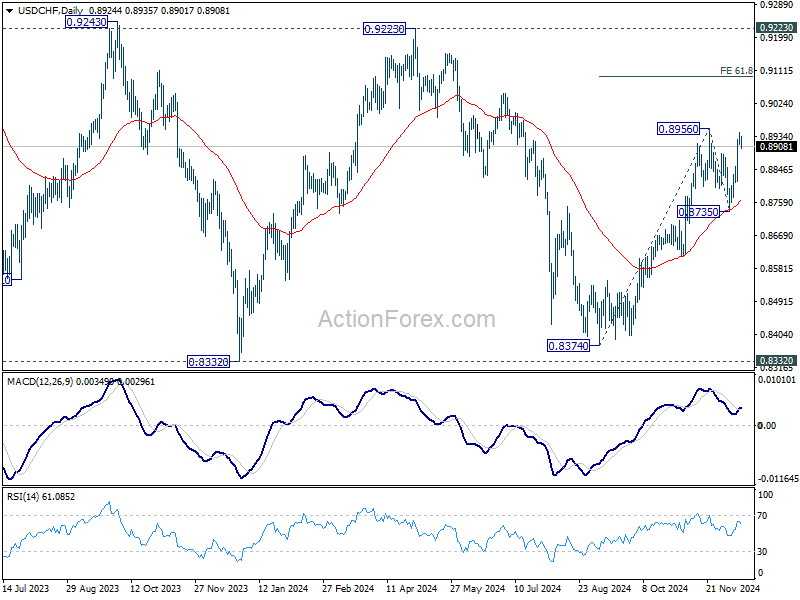
USD/CHF Daily Outlook
Daily Pivots: (S1) 0.8907; (P) 0.8927; (R1) 0.8947; More…
Intraday bias in USD/CHF stays on the upside with focus on 0.8956 resistance. Decisive break there will confirm resumption of whole rally from 0.8374. Next target is 61.8% projection of 0.8374 to 0.8956 from 0.8735 at 0.9095. On the downside, below 0.8866 minor support will delay the bullish case and bring more consolidations first.
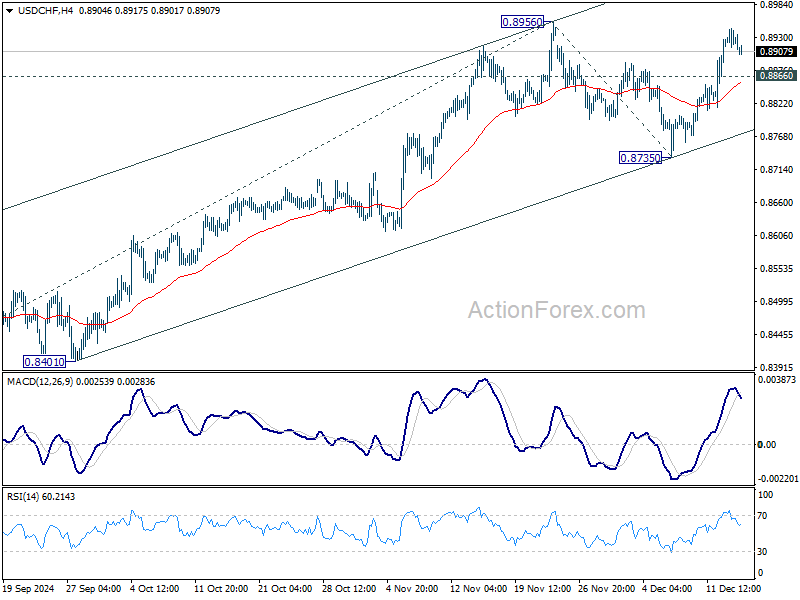
In the bigger picture, price actions from 0.8332 (2023 low) are currently seen as a medium term corrective pattern, with rise from 0.8374 as the third leg. Overall outlook will continue to stay bearish as long as 0.9223 resistance holds. Break of 0.8332 low is in favor at a later stage when the consolidation completes.