Sample Category Title
RBA’s April Minutes Revealed Concerns Over Labor And Housing Markets
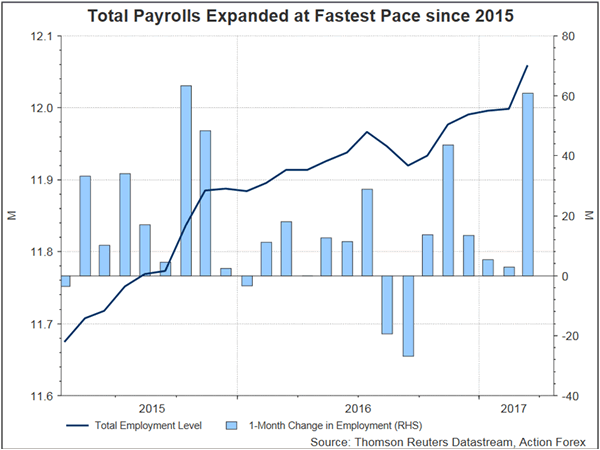
RBA minutes for the April meeting came in less upbeat than the March one, underpinning concerns over developments in Australia's labor and housing market. Policymakers concluded by noting that "developments in the labour and housing markets warranted careful monitoring over coming months". Note, however, that the meeting was held ahead of the release of the March employment report which showed that full-time payrolls rose the most in nearly 30 years. Aussie slumped after the minutes to a 3-day low 0.552.
Softer conditions in the labour market
Policymakers acknowledged that low interest rates had continued to support moderate growth in Australia at the beginning of 2017. However, they cautioned over the weaker than expected indicators of household consumption, attributing them to the "softer conditions in the labour market". The members were concerned over the employment market, noting that positive forward-looking indicators of labour demand had failed to lead to an improvement in labour market conditions.
We have to point out that this judgment was made before the release of the March employment report which did depict encouraging developments in the job market. Employment rose +60.9K from February, beating expectations of a +20K increase. Of which full-time jobs jumped +74.5K, the biggest increase since December 1987 while part-time jobs dropped -13.6K.
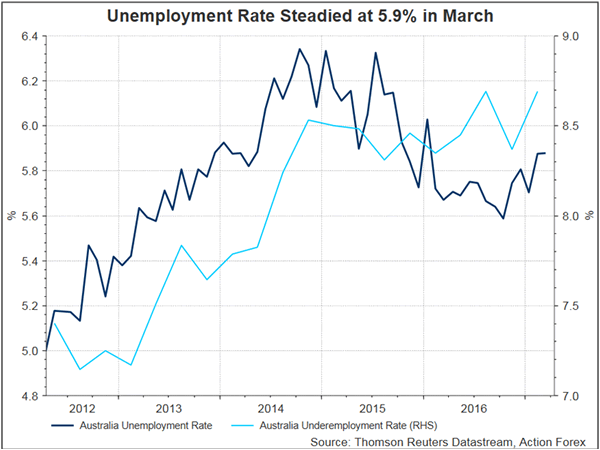
The unemployment rate steadied at 5.9% with participation rate adding +0.2 percentage point to 64.8%.
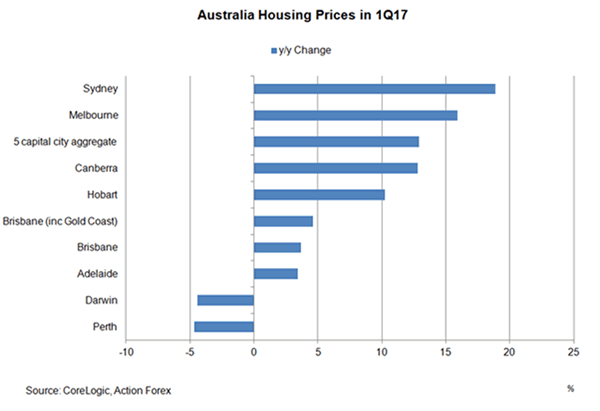
Increasing concern on housing market
Another big concern haunting the members is the housing market. The minutes suggested that “growth in housing credit continued to outpace growth in household incomes, suggesting that the risks associated with the housing market and household balance sheets had been rising”. Policymakers were apparently concerned that soft income growth has led to an increase in household debt ratios, despite modest slowdown in household credit growth. The minutes added that the current “developments needed to be kept under review and depending on how the system responds to the various measures” and “the Council of Financial Regulators would consider further measures if needed”.
Less upbeat than March
Policymakers refrained from delivering an upbeat forward guidance as it was in March. In the March minutes, RBA suggested that "year-ended growth was expected to pick up gradually to be above its potential rate over the forecast period". However, it only noted this month that "Australian economy had continued to grow moderately at the beginning of 2017, supported by the low level of interest rates". This apparently sounded less confident over the growth outlook. In the concluding statement, it was added that that "developments in the labour and housing markets warranted careful monitoring over coming months".
EUR/USD Candlesticks and Ichimoku Analysis
Weekly
• Last Candlesticks pattern: Shooting star
• Time of formation: 03 May 2016
• Trend bias: Down
Daily
• Last Candlesticks pattern: Shooting star
• Time of formation: 3 May 2016
• Trend bias: Sideways
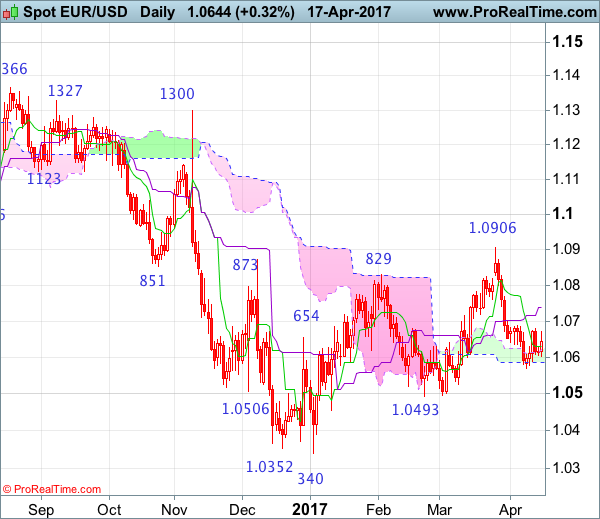
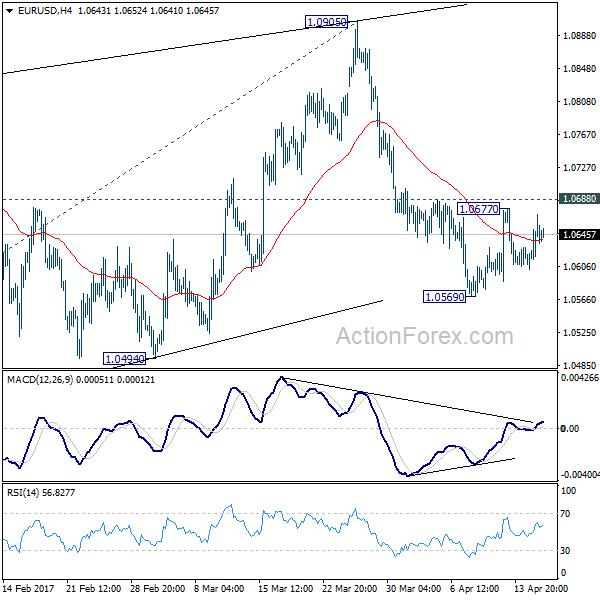
EUR/USD – 1.0645
As the single currency found support at 1.0570 and recovered last week, suggesting consolidation above this level would be seen and another bounce to 1.0678 resistance cannot be ruled out, however, still reckon upside would be limited to 1.0700 and bring another decline, below said support at 1.0570 would signal the fall from 1.0906 top is still in progress and extend fall to 1.0525 support but a daily close below key support at 1.0493 is needed to confirm early erratic rise from 1.0340 low (this year’s low) has ended at 1.0906, bring further fall to 1.0440-50 and possibly towards 1.0390-00, having said that, said support at 1.0340 should remain intact.
On the upside, although consolidation is seen with initial upside bias, reckon 1.0700 would limit upside and bring another decline. A daily close above the Kijun-Sen (now at 1.0738) would abort and suggest first leg of decline from 1.0906 has ended instead, risk a stronger rebound to 1.0765-70 but upside should be limited to 1.0800 and price should falter well below 1.0870-75, bring another selloff later this month.
Recommendation: Hold short entered at 1.0670 for 1.0500 with stop above 1.0770.
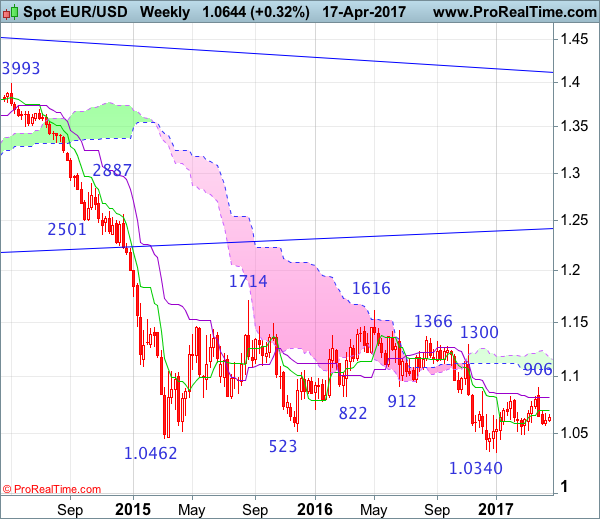
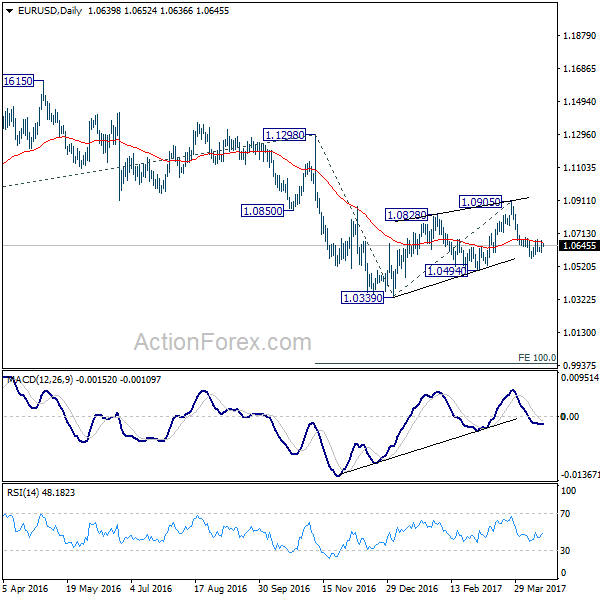
On the weekly chart, although the single currency found support at 1.0570 and recovered, as the selloff from 1.0906 suggests top is possibly formed there, reckon upside would be limited to the Tenkan-Sen (now at 1.0700) and bring another decline, below said support at 1.0570 would extend weakness to 1.0525. Looking ahead, only a break of indicated pivotal support at 1.0493 would signal the rebound from 1.0340 has ended at 1.0906, bring further fall to key support at 1.0454, a sustained breach below this level would provide confirmation, then further fall to 1.0390-00 and later retest of this January low would follow.
On the upside, expect recovery to be limited to the Tenkan-Sen (now at 1.0700) and brig another decline. Above 1.0730-40 would bring test of 1.0780, however, reckon upside would be limited to 1.0825-30 and price should falter well below said resistance at 1.0906, bring another decline later. Only a break of 1.0906 would revive near term bullish view for the erratic rise from 1.0340 low to bring retracement of recent decline to 1.0930-35 (61.8% Fibonacci retracement of 1.1300-1.0340) and possibly 1.1000, however, reckon upside would be limited to 1.1050-60 and price should falter below 1.1100-10, risk from there is seen for a retreat to take place later.
USD/JPY Candlesticks and Ichimoku Analysis
Weekly
• Last Candlesticks pattern: Marubozu
• Time of formation: 14 Nov 2016
• Trend bias: Down
Daily
• Last Candlesticks pattern: Shooting star
• Time of formation: 15 Feb 2017
• Trend bias: Down
USD/JPY – 109.05
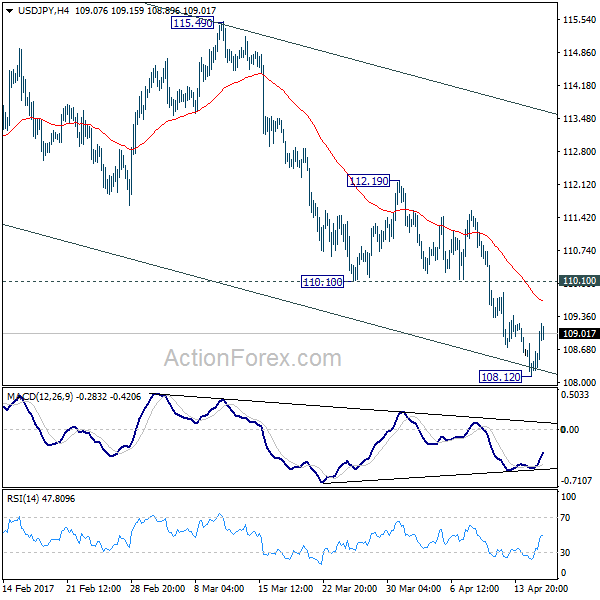
The greenback did meet renewed selling interest at 111.58 (a short position was met at 111.50) and dollar has fallen again in line with our bearish expectations, the indicated downside target at 109.50 was met (with 200 points profit) as price fell to as low as 108.13 yesterday before rebounding. Although this anticipated has justified our bearishness and adds credence to our view that the decline from 118.66 top is still in progress, yesterday’s rebound from 108.13 formed a hammer bullish reversal pattern on the daily chart, suggesting consolidation above this level wold be seen and corrective bounce to the Tenkan-Sen (now at 109.86) is likely, however, reckon 110.40-50 would limit upside and bring another decline later. A break of said support at 108.13 would extend recent decline to 107.85-90 (61.8% Fibonacci retracement of 101.19-118.66) and possibly 107.40-50 but oversold condition should prevent sharp fall below 106.75-80 (1.236 time projection of 118.66-111.59 measuring from 115.51) and 105.90-00 should hold, bring rebound later.
On the upside, whilst initial recovery to the Tenkan-Sen (now at 109.86) is likely, reckon upside would be limited to 110.40-50 and bring another decline later. Above said resistance at 111.58 would defer but only a daily close above the Kijun-Sen (now at 111.67) would suggest a temporary low is possibly formed, risk test of resistance at 112.20 but only a sustained breach above this level would provide confirmation, bring correction of recent selloff to 112.90 (previous resistance) and possibly towards other resistance at 113.54.
Recommendation : Our short position entered at 111.50 met target at 109.50 with 200 points profit and would sell again at 110.40 for 108.40 with stop above 111.40.
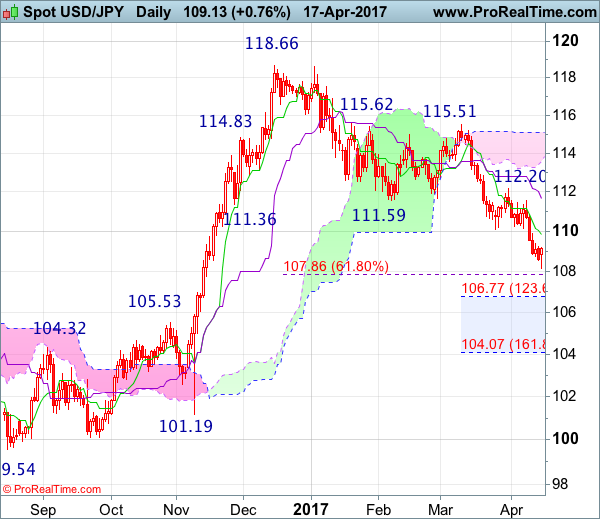
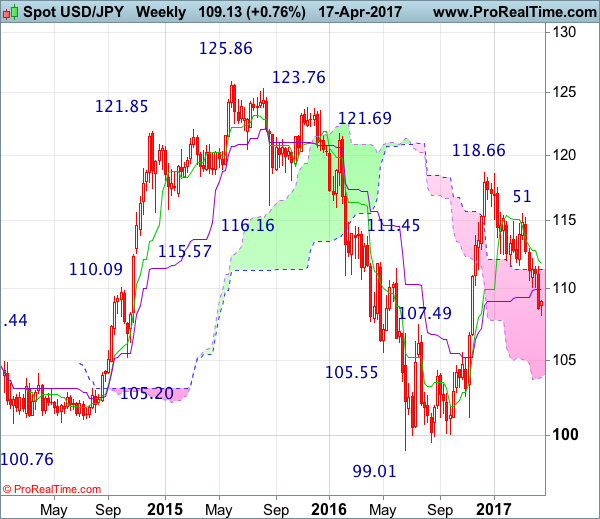
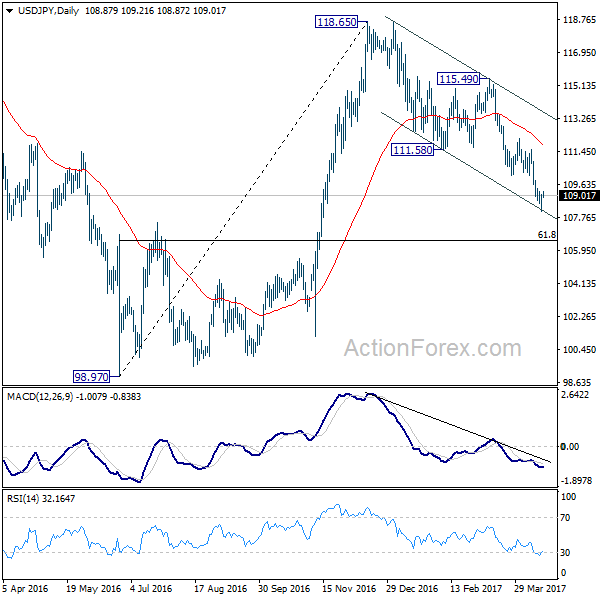
On the weekly chart, as the greenback has fallen again in line with our bearish expectation, adding credence to our view that top has been formed at 118.66 earlier and mild downside bias remains for the retreat from there to bring retracement of recent upmove, hence further weakness to 107.85-90 (61.8% Fibonacci retracement of 101.19-118.66), then towards 107.00, however, near term oversold condition should prevent sharp fall below 106.50-55 (61.8% Fibonacci retracement of 99.01-119.52) and reckon previous resistance at 105.53 (now support) would remain intact.
On the upside, although initial recovery to the Kijun-Sen (now at 109.93) cannot be ruled out, reckon upside would be limited to 110.40-50 and bring another decline. Above resistance at 111.58 would defer and risk test of the Tenkan-Sen (now at 111.82) but a weekly close above 112.20-26 resistance level is needed to signal a temporary low is formed instead, bring a stronger rebound to 113.00, then test of 113.54 resistance and possibly 114.00-10, however, price should falter well below resistance at 115.51.
EUR/USD Daily Outlook
Daily Pivots: (S1) 1.0605; (P) 1.0638 (R1) 1.0674; More....
Intraday bias in EUR/USD remains neutral for the moment. Near term bearish outlook is unchanged. That is, correction from 1.0339 has completed with three waves up to 1.0905. Fall from there is resuming larger down trend. On the downside, break of 1.0569 minor will turn bias to the downside for 1.0494 support first. Decisive break there should confirm our bearish view. In that case, EUR/USD should drop through 1.0339 to 100% projection of 1.1298 to 1.0339 from 1.0905 at 0.9946. On the upside, however, break of 1.0688 resistance will delay the bearish case and turn focus back to 1.0905 resistance instead.
In the bigger picture, as long as 1.1298 key resistance holds, whole down trend from 1.6039 (2008 high) is still expected to continue. Break of 1.0339 low will send EUR/USD through parity to 61.8% projection of 1.3993 to 1.0461 from 1.1298 at 0.9115. However, considering bullish convergence condition in weekly MACD, break of 1.1298 will indicate term reversal. this would also be supported by sustained trading above 55 week EMA.
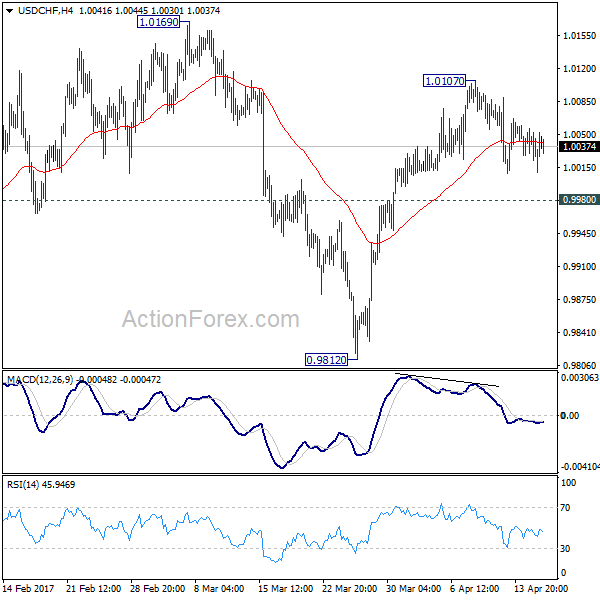
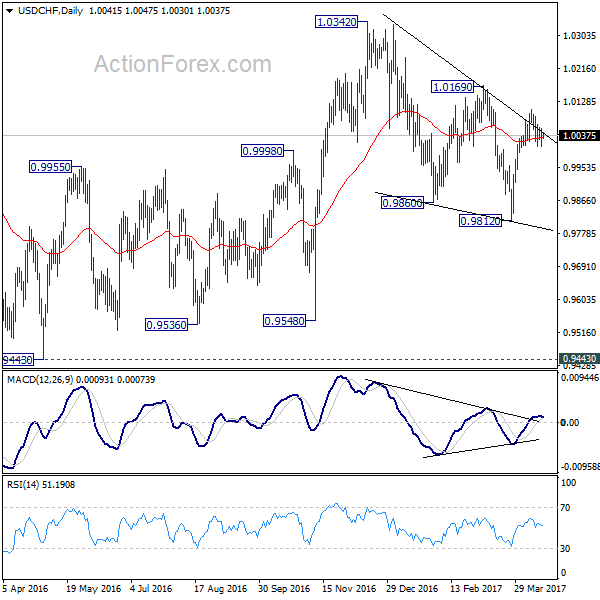
USD/CHF Daily Outlook
Daily Pivots: (S1) 1.0015; (P) 1.0035; (R1) 1.0060; More.....
Intraday bias in USD/CHF remains neutral for the moment. Near term bullish outlook is unchanged. That is, corrective from 1.0342 has completed with three waves down to 0.9812. And, rise from 0.9548 is resuming. On the upside, break of 1.0107 will turn bias to the upside for 1.0169 resistance. Break there should confirm our bullish view and should target a test on 1.0342 key resistance next. However, below 0.9980 will dampen this bullish case and turn bias back to the downside for 0.9812 low.
In the bigger picture, we're still maintaining that firm break of 1.0342 key resistance is needed to confirm underlying bullish momentum in the cross. However, the corrective nature of the fall from 1.0342 to 0.9812 is starting to give the medium term outlook a bullish favor. Hence, in stead of looking for topping signal around 1.0342, we'd now pay closer attention to upside acceleration as USD/CHF approaches this level again.
USD/JPY Daily Outlook
Daily Pivots: (S1) 108.33; (P) 108.69; (R1) 109.26; More....
USD/JPY formed a temporary low at 108.12 after hitting near term channel support. Intraday bias is turned neutral first. Current development argues that rise from 98.97 is already completed at 118.65. Hence, we'd expect upside of recovery to limited by 110.10 minor resistance to bring another decline. Below 108.12 will target 61.8% retracement of 98.97 to 118.65 at 106.48. Sustained break there will pave the way back to 98.97 low. Nonetheless, break of 110.10 will be the first sign of near term bottoming and turn bias back to the upside for 112.19 resistance instead.
In the bigger picture, price actions from 125.85 high are seen as a corrective pattern. Current development suggests that it's not completed yet and is extending. In case of deeper decline, downside should be contained by 61.8% retracement of 75.56 to 125.85 at 94.77 to bring rebound. Rise from 75.56 is still expected to resume later after the correction from 125.85 completes.
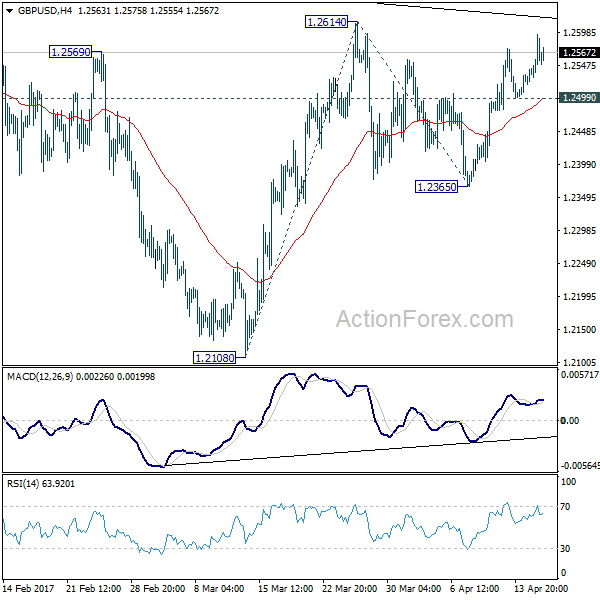
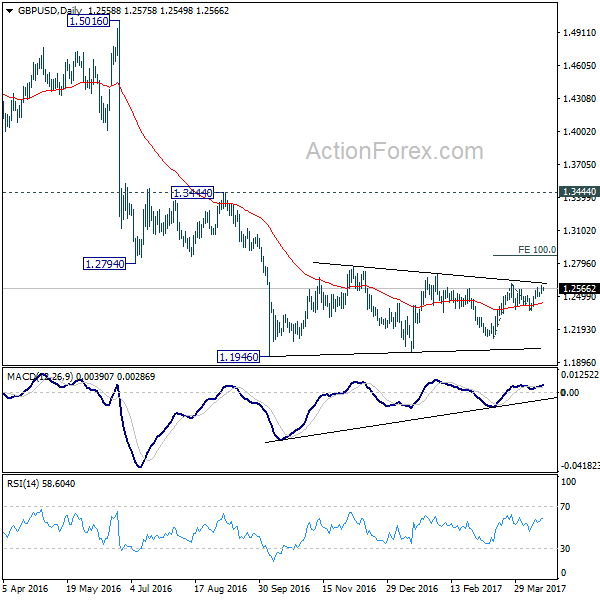
GBP/USD Daily Outlook
Daily Pivots: (S1) 1.2522; (P) 1.2558; (R1) 1.2599; More...
Intraday bias in GBP/USD remains mildly on the upside for 1.2614 resistance. Break there will resume the rise from 1.2108 and target 100% projection of 1.2108 to 1.2614 from 1.2365 at 1.2871. However, such rally is seen as part of the consolidation from 1.1946 low. Hence, we'd expect strong resistance around 55 week EMA (now at 1.3016) to limit upside and bring down trend resumption. On the downside, break of 1.2499 minor support will turn bias back to the downside for 1.2365 support first.
In the bigger picture, fall from 1.7190 is seen as part of the down trend from 2.1161. There is no sign of medium term reversal yet. Sustained trading below 61.8% projection of 2.1161 to 1.3503 from 1.7190 at 1.2457 will target 100% projection at 0.9532. Overall, break of 1.3444 resistance is needed to confirm medium term bottoming. Otherwise, outlook will remain bearish.
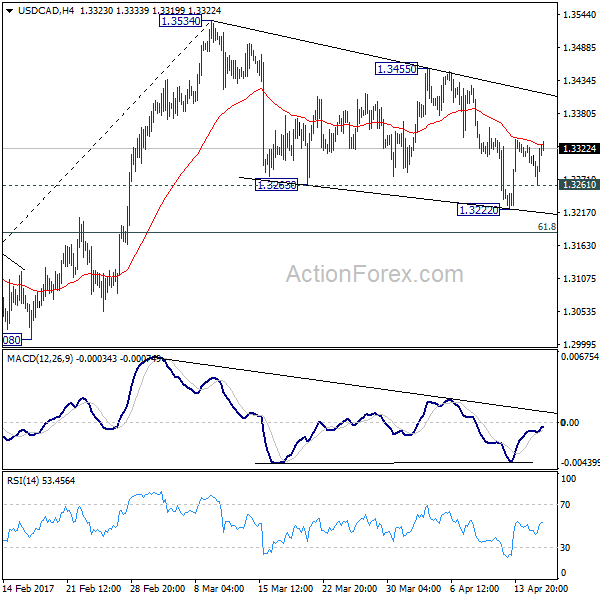
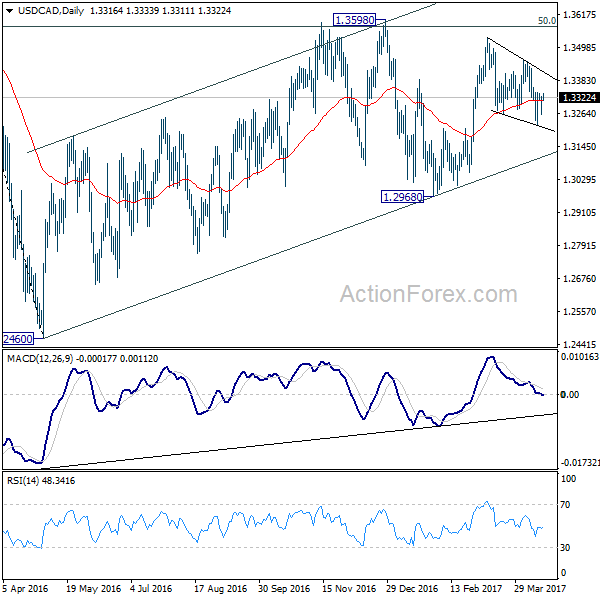
USD/CAD Daily Outlook
Daily Pivots: (S1) 1.3277; (P) 1.3299; (R1) 1.3337; More....
Intraday bias in USD/CAD remains mildly on the upside for the moment. As noted before, correction from 1.3534 is likely finished with three waves down to 1.3222. Further rise should be seen to 1.3455 next. Break there will confirm this bullish case and send USD/CAD to 1.3598 resistance. In that case, whole rise from 1.2460 is likely resuming too. On the downside, below 1.3261 minor support will bring another fall. But we'd expect strong support from 61.8% retracement of 1.2968 to 1.3534 at 1.3184 to contain downside and bring rebound.
In the bigger picture, price actions from 1.4689 medium term top are seen as a correction pattern. The first leg has completed at 1.2460. The second leg from 1.2460 is likely still in progress and could target 61.8% retracement of 1.4689 to 1.2460 at 1.3838. We'd look for reversal signal there to start the third leg. However, break of 1.2968 will argue that the third leg has already started and should at least bring a retest of 1.2460 low. Meanwhile, sustained trading above 1.3838 would pave the way to retest 1.4689 high.
European Open Briefing: Risk Appetite Remained Low In Asia
Global Markets:
- Asian stock markets: Nikkei up 0.20 %, Shanghai Composite fell 0.05 %, Hang Seng declined 1.00 %, ASX 200 fell 1.10 %
- Commodities: Gold at $1285 (-0.50 %), Silver at $18.38 (-0.70 %), WTI Oil at $52.60 (-0.15 %), Brent Oil at $55.30 (-0.15 %)
- Rates: US 10-year yield at 2.25, UK 10-year yield at 1.05, German 10-year yield at 0.19
News & Data:
- China House Prices YoY (Mar): 11.30% (prev 11.80%)
- RBA Minutes: Judged Steady Rates Consistent with Growth and Inflation Targets
- Asia stocks slip amid North Korea concerns, dollar up on Mnuchin comments – RTRS
- Oil prices mixed after U.S. production seen rising – RTRS
- Dollar/yen off five-month low but U.S.-Japan trade issues limit rise – RTRS
Markets Update:
Risk appetite remained low in Asia. Hong Kong and Australian markets reopened after a long weekend and declined more than 1 % on the day. The other major stock markets posted a small loss as well.
Increasing tensions between the US and North Korea are keeping traders cautious. Nevertheless, Gold fell slightly in the past few trading sessions, as the Dollar regained some strength. The metal is looking a bit overbought in the short-term, and a retracement towards $1270 seems likely.
The Australian Dollar came under pressure overnight. The RBA minutes did not deliver any new information, it was rather the risk-off sentiment that weighed on the currency. AUD/USD fell from 0.76 to 0.7560. Support is seen at 0.7550 and then again at 0.75.
USD/JPY managed to recover slightly, but the rally was capped ahead of 109.20. Strong resistance is seen in the area between 109.20 and 109.30. Support now lies at 108.50 and ahead of 108.00.
Upcoming Events:
- 13:30 GMT – US Building Permits
- 13:30 GMT – US Housing Starts
- 14:15 GMT – US Industrial Production
- 14:15 GMT – US Manufacturing Production
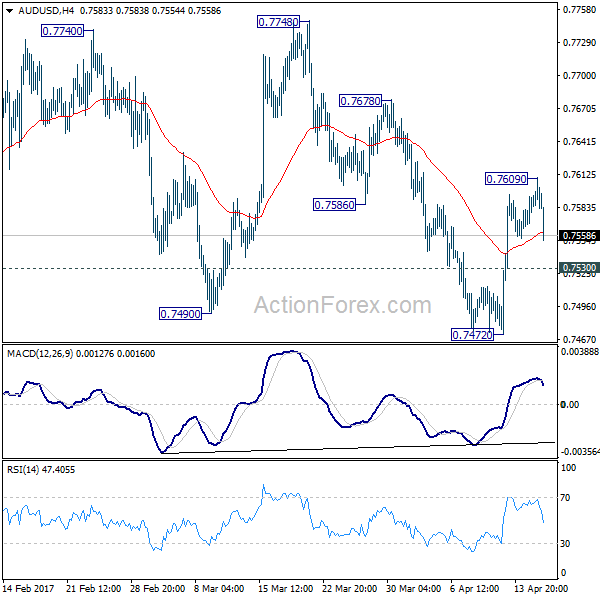
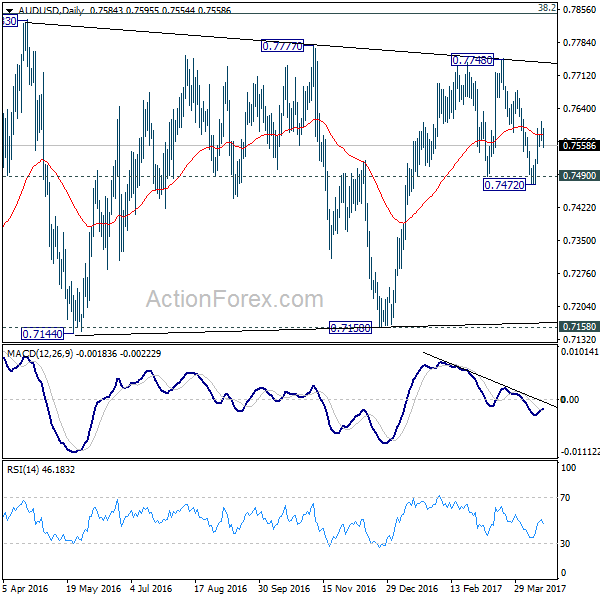
AUD/USD Daily Outlook
Daily Pivots: (S1) 0.7565; (P) 0.7588; (R1) 0.7611; More...
AUD/USD retreats today as rebound from 0.7472 lost momentum after hitting 0.7609. Intraday bias is turned neutral first. At this point, we're still slightly favoring the case that pull back from 0.7748 is completed at 0.7472. And rise fro 0.7158 is possibly resuming. Above 0.7609 will target 0.7678 resistance first. Break there will confirm this case and send AUD/USD through 0.7748 towards long term fibonacci level at 0.7849. On the downside, though, below 0.7530 minor support will turn bias back to the downside for 0.7472 instead.
In the bigger picture, we're still treating price actions from 0.6826 low as a correction. And, as long as 38.2% retracement of 0.9504 to 0.6826 at 0.7849 holds, long term down trend from 1.1079 is expected to resume sooner or later. Break of 0.6826 low will target 0.6008 key support level. However, firm break of 0.7849 will indicate that rise from 0.6826 is developing into a medium term rebound, rather than a sideway pattern. In such case, stronger rise should be seen to 55 month EMA (now at 0.8144) and above.