Sample Category Title
Weekly Report: Energy, Commodities, Indices, Forex
ENERGY
WTI Oil rallied for the third consecutive week and hit fresh five-week high at $53.74, gaining 1.15% for the week. Oil price was supported by heightened geopolitical tensions in the Middle East, the region that provides more than a quarter of world's oil output. Crude oil price accelerated higher last week after United States fired missiles on Syrian air base that raised tensions with Russia and threatened of further escalation. Another hot point was North Korea which made several missile tests that prompted the US to send their warships in the region. Tensions were further heated after North Korea threatened of launching their nuclear weapons if being attacked. Additional support to the oil prices were hopes that agreement between OPEC and non-OPEC oil producers for production cut by 1.8 million barrels per day would extend for additional six months. Reactions in oil markets on initial decision to cut oil output until June were good, as oil price recovered strongly, but extended action is needed to sustain current recovery in oil prices. US Crude oil hit its five-week high on Wednesday but pulled back despite unexpected fall in US weekly crude inventories by 2.2 million barrels against forecasted build of 87.000 barrels. Oil price dipped around $1 on Wednesday, as increase in US shale oil production weighed on support from Crude stocks draw and geopolitical tensions. Oil price remained steady despite closing below $53.00 handle, supported by fundamentals as well as bullish technical studies. However, overbought studies warn of deeper correction before oil price resumes rally, as key short-term barriers at $55.00 zone remain in focus. Oil may extend correction towards $ 52.20 where initial support lies, with strong technical support at $51.70 zone required holding and keeping bullish structure intact. Conversely, loss of the latter support would signal stronger correction of the recent $47.07/$53.74 rally. Brent oil hit five week high at $56.62, meeting its initial target, Mar 7 high, but was dragged down on by overbought technical studies.
Brent price accelerated higher at the beginning of the week, supported by shutdown of Libya's largest oilfield and being supported by rising geopolitical tensions. Again, strong bearish signal is developing in daily technical studies where slow stochastic is emerging from overbought zone and also formed bearish divergence, which may signal stronger correction. Immediate support lies at $55.00, ahead of converged 55/100d Moving Averages at $54.40 and $54.00 Fibonacci 38.2% support, where extended correction should find support.
US Natural Gas futures rose over 1% on Thursday after data showed expected built in gas storage. Natural Gas contract for May delivery spiked to $3.230 per million BTU on Thursday, where it closed for the week. Recovery on Thursday was not enough to improve negative picture as gas price fell nearly 3% on Tuesday, ending week in red. Weekly report showed 10 billion cubic feet of natural gas added into storage in the week ended April 7, which was slightly above forecasted 9 billion cubic feet. Solid data prompted short-covering that boosted gas price to emerge above important technical barrier at $3.205, but the price stayed capped by daily Tenkan-sen at 3.228, break of which is needed for fresh bullish signal.
COMMODITIES
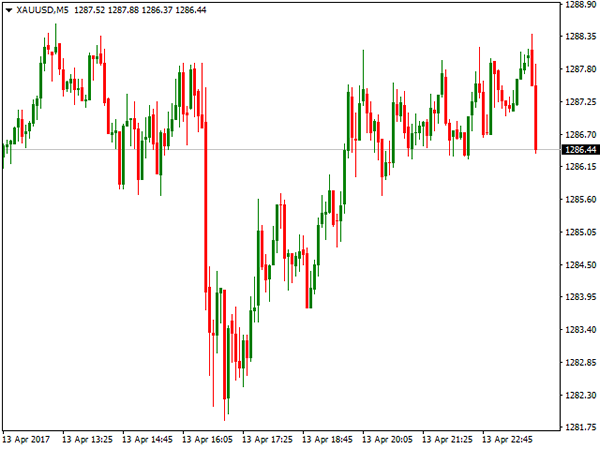
Spot gold was the top performer of the last week, gaining 2.55% for the week, marking the biggest weekly gains since the first week of June 2016. The yellow metal ended week just under fresh five-month peak at $1288, posted after strong bullish acceleration, boosted by rising tensions over US relations with Russia, after US attack at Syrian airbase and North Korean missile tests that both raised tensions in those regions. Adding to geopolitical concerns, the US military dropped its largest non-nuclear device ever-used in combat in Afghanistan on Tursday. Gold price was boosted by strong safe haven buying as investors abandoned riskier assets amid rising geopolitical tensions and moved into traditional safe haven gold. Last week's gold rally was also boosted by sharp fall of the dollar, caused by comments from US President Trump on Thursday, who said that the US currency is too strong, adding that he prefers low interest rates. Gold is very sensitive to the changes in US interest rates and reacted in swift acceleration after Trump's comment which added to existing support from geopolitical tensions. Rally took out Fibonacci 76.4% barrier at $1286 and now eyes next strong obstacle at $1293, top of weekly Ichimoku cloud, break of which would open way towards psychological $1300 barrier. Strong bullish sentiment is supported by firmly bullish technical studies, however, gold price may ease in coming sessions, in corrective action, signalled by overbought technical studies. Initial support lies at $1281, followed by $1279/70 support zone which should contain corrective dips.
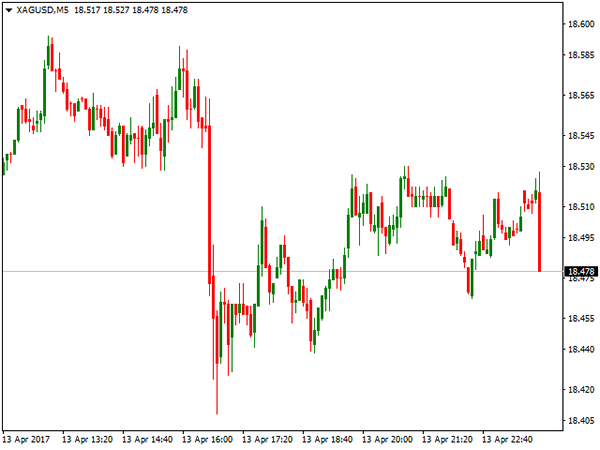
Spot Silver was up over 3% last week and hit fresh five-month high at $18.594 on Thursday, boosted by increase demand for precious metals in rising geopolitical tensions. Along with strong fundamentals Silver is supported by bullish technical studies, as last week's rally exceeded previous peak of Feb 27 at $18.478, on completion of $18478/$16817 corrective phase that signals continuation of bull-leg from $16817, Mar 15 correction low. Last week's rally has dented another strong technical resistance at $18.534 (weekly Ichimoku cloud top), firm break of which would trigger bullish extension towards psychological / Fibonacci barrier at $19.000.
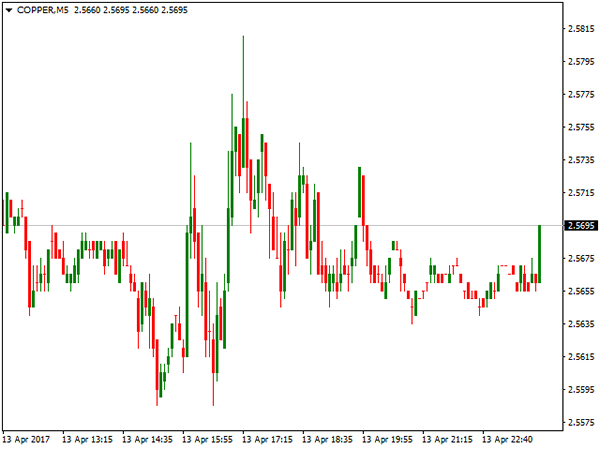
Copper contract for May delivery fell 2.76% last week and hit three-month low at $2.5345 on Wednesday, on steady descend last week, after Peru increased copper output, upstaging top producer Chile. The world's second biggest producer Peru has benefited from lower production costs and untapped reserves. In addition, persistent concerns about weak demand from top metal consumers, such as China, kept copper price under pressure last week, extending broader weakness from mid-February's 2.8215 peak, the highest in nearly two years. Copper managed to recover some losses on Thursday, supported by weaker dollar and upbeat trade data from China that increased hopes for stronger demand. Technical studies remain bearish and see strong risk of further fall in copper price, as last week's fall also dented key technical supports at $2.5580 and $2.5400, firm break of which would trigger fresh bearish acceleration towards round-figure $2.5000 level and another strong technical support at $2.4530. On the flip side, $2.6345 marks strong resistance, regain of which would ease bearish pressure.
Copper contract for May delivery fell 2.76% last week and hit three-month low at $2.5345 on Wednesday, on steady descend last week, after Peru increased copper output, upstaging top producer Chile. The world's second biggest producer Peru has benefited from lower production costs and untapped reserves. In addition, persistent concerns about weak demand from top metal consumers, such as China, kept copper price under pressure last week, extending broader weakness from mid-February's 2.8215 peak, the highest in nearly two years. Copper managed to recover some losses on Thursday, supported by weaker dollar and upbeat trade data from China that increased hopes for stronger demand. Technical studies remain bearish and see strong risk of further fall in copper price, as last week's fall also dented key technical supports at $2.5580 and $2.5400, firm break of which would trigger fresh bearish acceleration towards round-figure $2.5000 level and another strong technical support at $2.4530. On the flip side, $2.6345 marks strong resistance, regain of which would ease bearish pressure.
INDICES
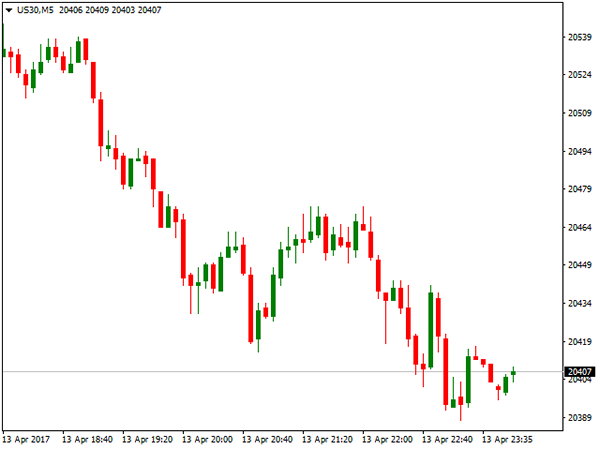
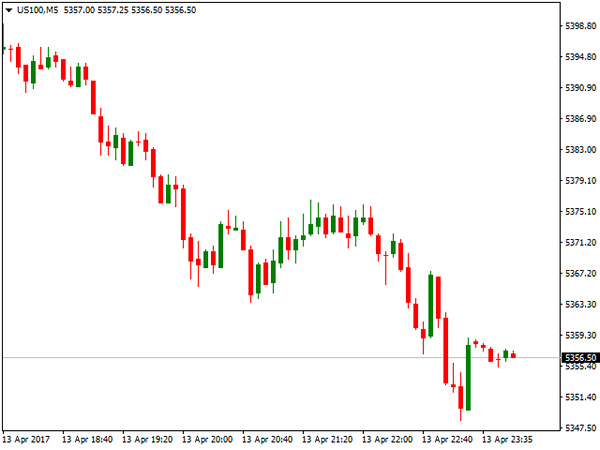
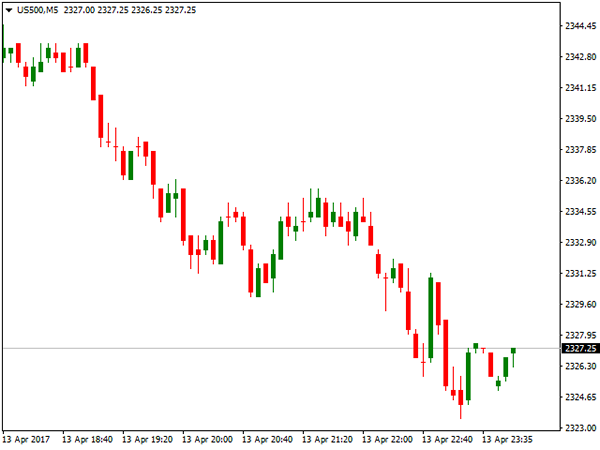
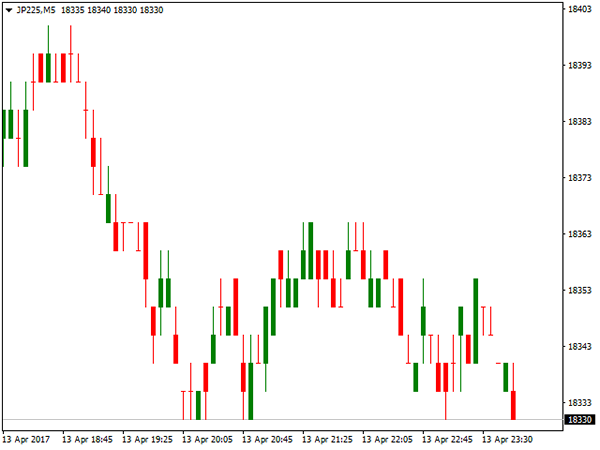
Wall Street ended week in red as US sticks fell on global risks that increased safe haven demand. Uncertainty amid growing crisis over Middle East and North Korea that brought relations between USA and Russia to the lowest levels since cold war, as news of a massive bomb being dropped by the United States in eastern Afghanistan on Thursday added to uncertainty and kept investors away from riskier assets and moving into safe haven. Dow Jones index fell almost 1% last week on return to strong 20400/20350 support zone; S&P 500 index was 1.02% down and Nasdaq100 dropped 1.16% for the week. Banking and tech sectors were among top negative drivers. Wells Fargo shares fell 3.3% and pulled down S&P 500 after the bank reported a drop in mortgage banking revenue. Berkshire Hathaway also reported that it had cut the stake in the bank. JP Morgan fell 1.2%; Citigroup was down 0.8% as banks revealed more evidence of a slowdown in loan growth that offset better-than-expected quarterly profits. The S&P 500 banks index closed at its lowest level since early December. Dow Jones extended its pullback from fresh record high at 21160, posted in March, after strong post US elections rally, signalling deeper correction of 17418/21160 Nov / Mar rally, which may accelerate in case current tensions escalate into conflict. S&P 500 index ended second week in red and approaches key short-term support at 2317, which could spark further weakness on break lower, as fragile geopolitical situation keeps stock indexes under pressure. Japanese stocks continued to move lower and slumped to fresh four-month low at 18295 last week, dragging Nikkei 225 index into fifth consecutive week in red. Nikkei was down 2.29% for the week, marking the biggest weekly loss since early Oct 2016. Firmer yen on strong safe haven buying kept the index under pressure. Strongly bearish technical studies threaten of further weakness, along with fragile geopolitical situation which keeps investors in firm risk-off mode.
FOREX
Another turbulent week for the money market is behind. Highlights of the week were comments from US President Donald Trump who described the dollar as too strong, saying that he prefers low interest rates and hinted he may keep Fed Chair Janet Yellen after her mandate ends in 2018. This sent dollar sharply lower against the basket of major currencies in late Wednesday, early Thursday's trading. Another event that shook markets was rising tensions between USA and Russia over the Middle East, after US army fired missiles on Syrian airbase and threatened of further attacks that triggered strong reaction from Moscow. Also, North Korea made several missile tests that brought US warships into region, with China also being involved, rising threats of escalation of the conflict. Tensions were raised after North Korea announced that they will respond with nuclear weapons on any attack. All these prompted investors to migrate from riskier assets into traditional safe haven instruments, such as Gold and Japanese yen, which were top gainers of last week.
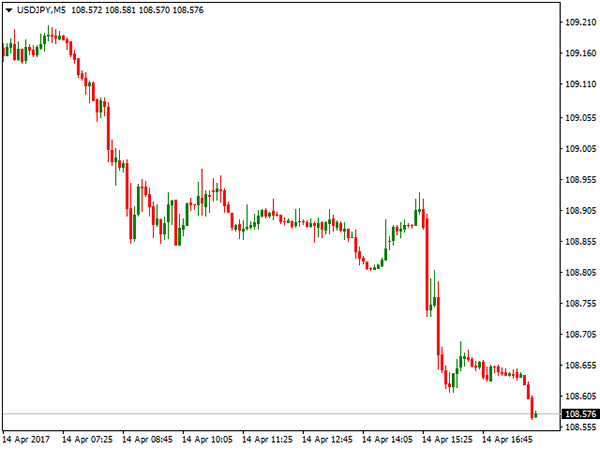
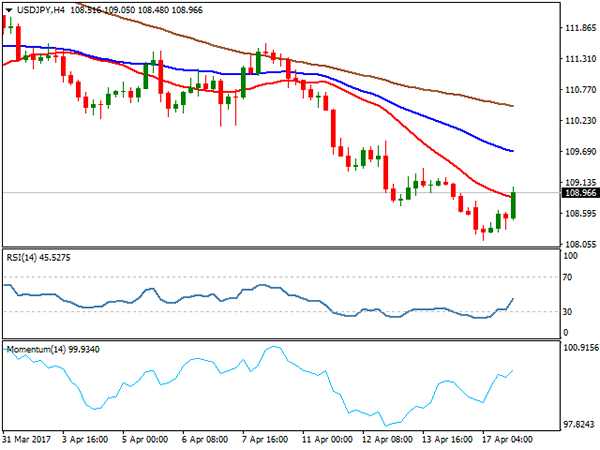
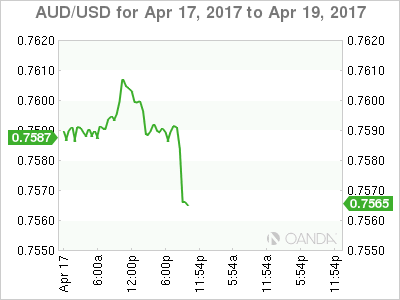
The dollar fell to the lowest levels since mid-November against Japanese yen, on strong bearish acceleration which broke below initial strong support at 110.00 zone and took out next key level at 108.70 (200SMA), below which weekly trading ended. The pair was down 2.6% for the week and seeing scope for further weakness on persisting geopolitical tensions and strong bearish technical studies.
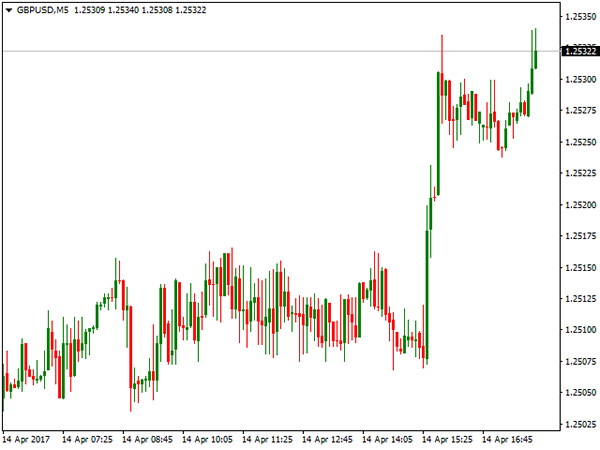
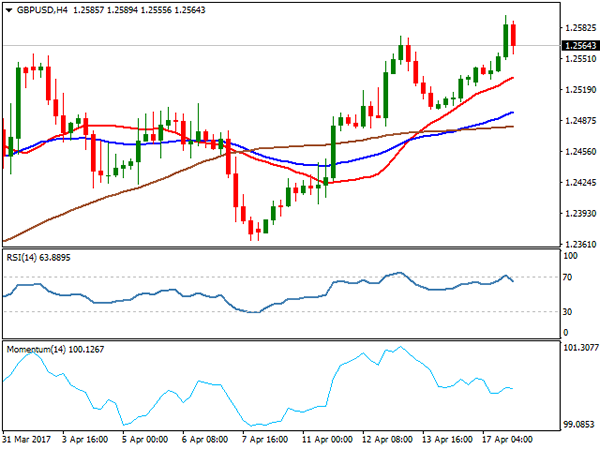
British pound benefited from strong economical data from UK released last week and rallied above 1.2500 against the dollar, gaining around 1.25% for the week. Cable bounced from weekly low at 1.2365 boosted by inflation data on Tuesday. Inflation remained steady in March, coming unchanged from the previous month at 2.3% but above forecasted 2.2%. Inflation is holding above BoE's 2% target which would gives good argument to those advocating for early rate hike. UK labour data, released on Wednesday, also showed good signals of stable growth, as average earnings jumped to 2.3% in March, beating forecast at 2.1% and February's 2.2% release. Although the unemployment rate remained unchanged at 4.7%, strong jump in jobless claims) 25.5K in Mar vs -10.2K forecast and -11.3K in Feb) suggests that UK employment have peaked and labour market may weaken as two-year Brexit process started.
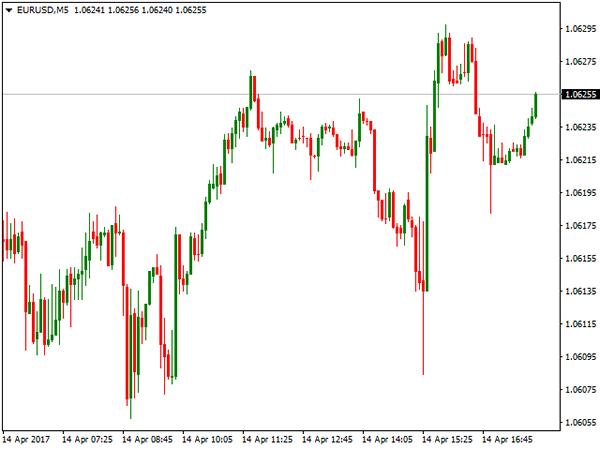
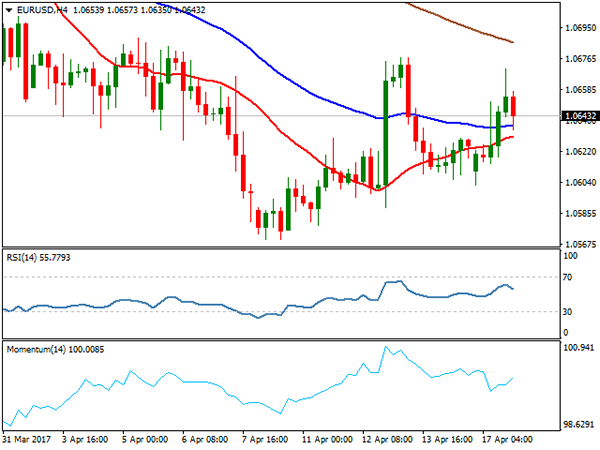
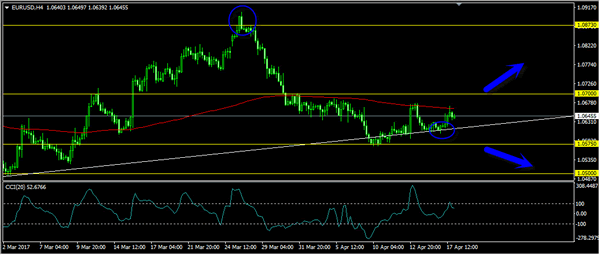
EURUSD ended week around the mid-point of last week's rally from 1.0570 to 1.0677, but maintained positive sentiment, as the week ended positively. The single currency received initial support from release Eurozone's investors confidence that rose to 23.9 in March, beating forecast at 20.1. On Tuesday, ZEW economic sentiment showed that German investor morale brightened in April, hitting its highest level since August 2015, buoyed by a strong Q1 performance of the bloc's largest economy. Economic sentiment surged to 19.5 points in April from 12.8 in March and beating forecast at 13.2 points. In addition, fresh weakness of the dollar triggered by remarks from President Trump, pushed the Euro to the week's high at 1.0677, but the pair was unable to hold gains and rally stalled ahead of pivotal barrier at 1.0700, keeping hopes of stronger advance sidelined for now. Profit-taking on strong dollar shorts dragged the Euro back to 1.0625 zone where it ended weekly trading.
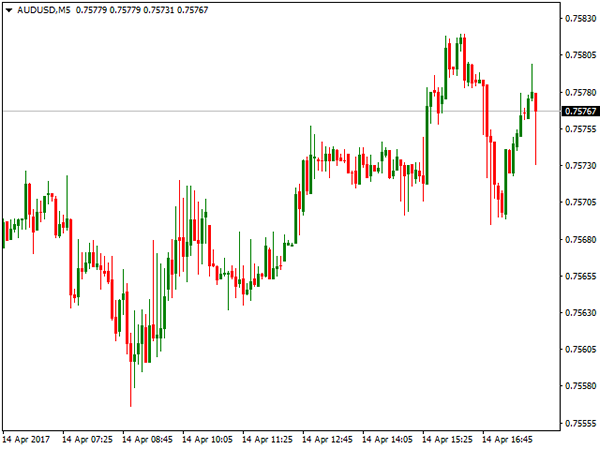
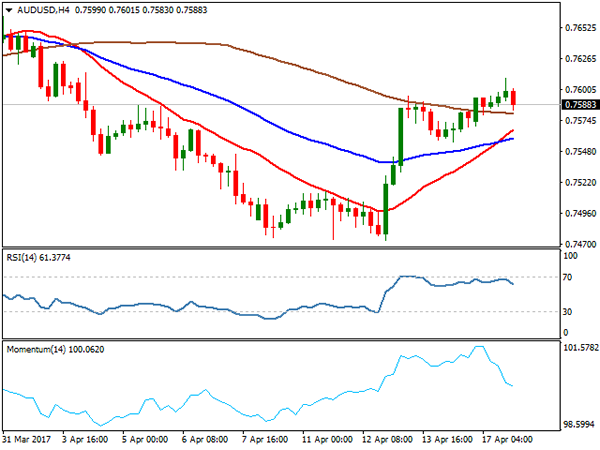
Australian dollar was among top winners, gaining 1.15% for the week, on bullish acceleration from week's low at 0.7472 to the highest traded at 0.7595. The Aussie received strong boost from Australian data that showed strong rise in Australian business condition which jumped in March to highs not seen since before the global financial crisis. Australia's NAB monthly survey showed index of business conditions climbed 6 points to +14 in March, which is well above long-run average at +5. The AUD USD pair broke above strong technical barriers at 0.7517 and 0.7550, generating strong bullish signal and managed to close for the week above 0.7550 (200SMA), after being additionally boosted by remarks of Donald Trump which undermined the US currency.
Foreign Exchange Market Commentary: EUR/USD, USD/JPY, GBP/USD,AUDUSD, GBPCAD, GOLD, WTI CRUDE, DJIA
EUR/USD
The EURUSD maintained positive tone on Monday’s holiday-thinned market. The pair regained traction from Asian session low at 1.0601 after repeated failure to clearly penetrate daily Ichimoku cloud (spanned between 1.0621 and 1.0584), which continues to underpin near-term action. Fresh bullish acceleration peaked at 1.0670, retracing the largest part of 1.0677/1.0601 downleg, but failed to regain last week’s high at 1.0677 and open way towards key barrier at 1.0700. Profit-taking at the end of the day dragged the price below important double-Fibonacci barrier at 1.0648 (23.6% of 1.0906/1.0570 descend and 61.8% of 1.0677/1.0601 downleg) and sidelined immediate hopes of stronger recovery. Studies on lower timeframes are bullish and expected to hold positive alignment on close above 1.0630 (daily Tenkan-sen). On the other side, daily technicals are bearish that keeps the downside vulnerable.Stronger bearish signal could be expected on close below initial pivots – daily Tenkan-sen / daily Ichimoku cloud top that would re-expose key supports at 1.0583/70 (daily Ichimoku cloud base / Apr 10 low).
Support: 1.0630, 1.0601, 1.0581, 1.0570
Resistance: 1.0648, 1.0670, 1.0677, 1.0700
USD/JPY
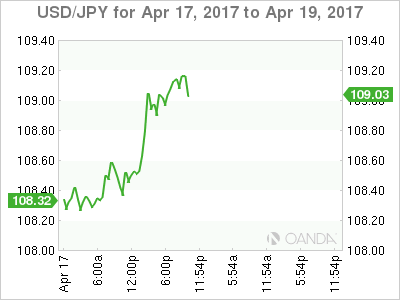
USD JPY currency pair took a breather on Monday, on recovery above 109.00 barrier, in attempts above broken 200SMA barrier at 108.81 and signal stronger correction from fresh five-month low at 108.11, posted in early Monday’s trading. The pair is pressured by rising tensions over North Korea, following another missile test and US started bringing their warships in the region that prompted investors into safe-haven Japanese yen. Technical studies are firmly bearish and favour further easing towards next target at 107.86 (Fibonacci 61.8% of 101.18/118.66 rally). Monday’s bounce could be seen as technical correction on oversold conditions and should be ideally capped under 110.00 mark, before bears resume, as long bearish candle of last week (the biggest one-week loss since the third week of July 2016) heavily weighs on markets.
Support: 108.81, 108.56, 108.11, 107.76
Resistance: 109.43, 109.84, 110.00, 110.25
GBP/USD
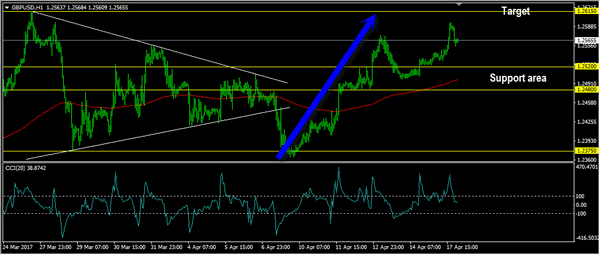
GBPUSD pair held bullish tone on Monday, despite low volumes on extended holiday trading. In eventless session, cable was driven by bullish sentiment and positive technicals and extended recovery from last Thu/Fri higher base at 1.2500, to reach levels close to psychological 1.2600 barrier. Strong bullish setup of daily studies keeps focus at the upside, however, final push towards targets at 1.2615/24 (Mar 27 high/200SMA) could be delayed on overbought conditions. Slow stochastic on daily chart reversed from overbought territory, signalling consolidative/ corrective action which should be ideally contained by hourly Kijun-sen line at 1.2551, to keep intact session low / broken Fibonacci 61.8% of 1.2615/1.2365 at 1.2523. Alternative scenario requires return and break below 1.2500 pivot to revive near-term bears.
Support:1.2551, 1.2523, 1.2500, 1.2480
Resistance: 1.2574, 1.2595, 1.2615, 1.2624
AUDUSD
The Aussie dollar remains well supported and extended recovery against its US counterpart on Monday, ending the fourth straight bullish day on rally from 0.7472 base (Apr 10;11;12 lows). Extended correction that retraced over 61.8% of 0.7675/0.7472 descend, peaked at 0.7610 on brief probe above daily Ichimoku cloud top at 0.7605 that was capped by daily Kijun-sen for now. Consolidation under daily cloud top could be anticipated as slow stochastic is overbought on daily chart, with limited downside, ahead of renewed attack at key 0.7600/10 resistance zone. Firm break and close above here is needed to confirm recovery continuation towards target at 0.7679 (Mar 30 high). Broken 200SMA at 0.7551 is expected to contain extended downticks.
Support: 0.7570, 0.7551, 0.7519, 0.7500
Resistance: 0.7605, 0.7610, 0.7630, 0.7640
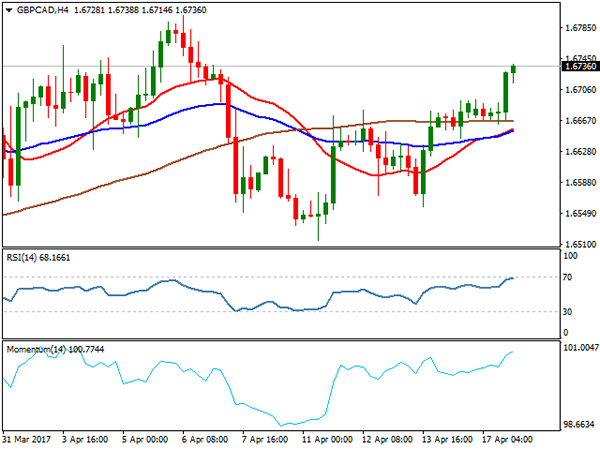
GBPCAD
The GBPCAD cross extended gains on Monday, marking the third consecutive bullish day. Fresh bullish extension peaked at 1.6736 (over 76.4% retracement of 1.6800/1.6515 downleg) and generated strong bullish signal on close above 200SMA at 1.6690 and daily Tenkan-sen line at 1.6657. The latest move higher turned daily technical studies into full bullish setup for final push towards target at 1.6800 (Apr 6 high), with possible extension towards peaks of Mar 27/28 at 1.6888/80. Broken 200SMA is expected to protect the downside, as rising 20SMA is underpinning the action (currently at 1.6665).
Support: 1.6714, 1.6690, 1.6665, 1.6657
Resistance: 1.6736, 1.6762, 1.6800, 1.6880
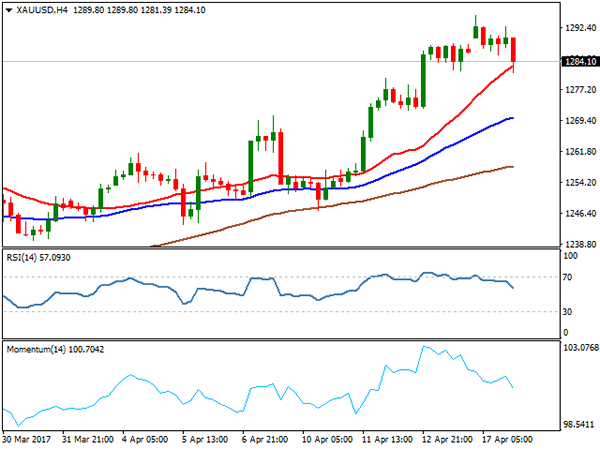
GOLD
Spot Gold eased and closed in red on Monday after hitting fresh five-month high at $1295, in early Monday’s trading, on brief probe above weekly Ichimoku cloud top at $1292. The yellow metal remains strongly supported by rising geopolitical tension that triggered risk aversion and strongly increased demand for safe haven gold. Monday’s easing was signalled by overbought daily RSI / slow stochastic, with technical correction expected to ideally find support at above rising hourly Ichimoku cloud (spanned between $1282 and $1275) which underpinned the rally since Apr 11). Final break and close above weekly cloud top is expected to spark acceleration for final attack at psychological $1300 barrier and next target at $1307 (Nov 2 high).
Support: 1281, 1275, 1271, 1265
Resistance: 1292, 1295, 1300, 1307
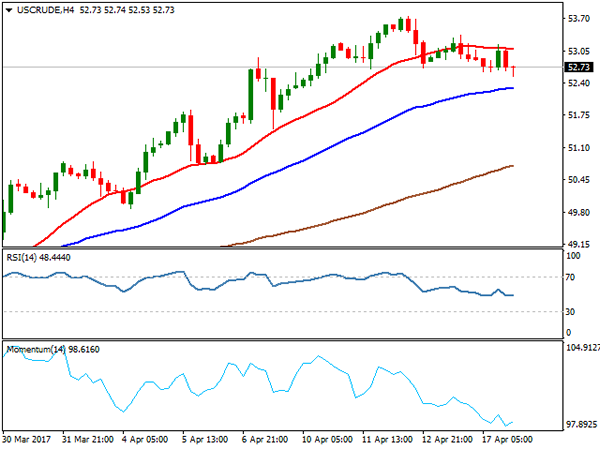
WTI CRUDE OIL
WTI oil fell further on Monday, extending pullback from fresh five-week high at $53.71, posted on Apr 12, to $52.53 (lowest of Monday). The price eased on overbought technical studies, despite rising geopolitical tensions that usually work in favour of oil price. However, signs the United States continue to increase output undermines OPEC efforts to support oil prices by extended production cut, which so far gave good results as oil price recovered from $47 to nearly $54 per barrel, within short period of time. Firmly bullish technicals remain supportive and favour fresh attempts higher after correction, which should be contained above sideways-moving daily Tenkan-sen line (currently at $51.80).
Support: 52.53, 52.17, 51.80, 51.19
Resistance: 53.18, 53.37, 53.74, 54.50
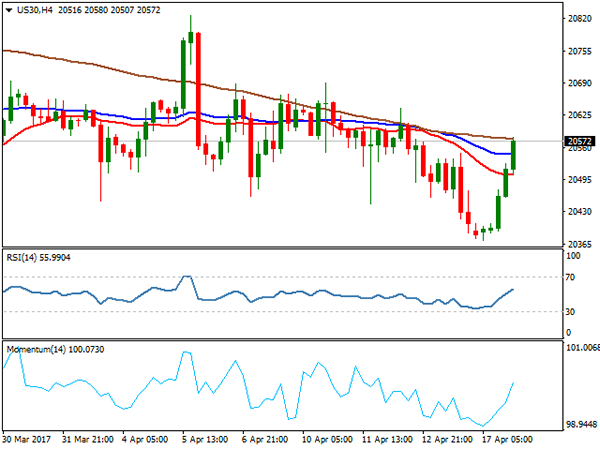
DJIA
Dow accelerated strongly on Monday and peaked at 20580 after hitting nearly nine-week low at 20372 in early Monday’s trading. Strong rally left long bullish daily candle that formed Bullish Engulfing pattern, generating reversal signal, after downside attempts were contained by daily Ichimoku cloud base.Recovery needs extension above daily Tenkan-sen line at 20580 which capped Monday’s rally, for further bullish signal, with break above daily Kijun-sen / cloud top trigger (20692/20703), needed to confirm reversal.Hourly cloud (spanned between 20527 and 20487) offers solid support which should contain dips and keep intact key support at 20385 (daily Ichimoku cloud base).
Support: 20527, 20587, 20432, 20385, 20266
Resistance: 20580, 20623, 20692, 20703
Market Morning Briefing: Dollar Strength
STOCKS
Slight recovery seen in most indices. But we need price confirmation to say that the corrective phase is over. Else there could be some more downside possibility in the near term.
Dow (20636.92, +0.90%) has bounced back from support near 20410 negating an immediate fall towards 20000. However, a break above 20800 is needed to take the index higher in the near term. While below 20800, we may expect movement in the 20800-20410 region.
Dax (12109, -0.38%) was closed for Easter Monday yesterday. We will have to see price action near support levels of 12100 to see the next course of direction. A bounce towards 12220 is possible in the coming sessions.
Shanghai (3223.87, +0.05%) continues to trade in the lower end of the broad 3300-3175 region. A bounce back towards 3250 and higher is possible in the coming sessions.
Nikkei (18398.24, +0.23%) has bounced from 18200 and could re-test the earlier support turned resistance near 18650. In case some rejection is seen from 18650, Nikkei could come off towards 18200-18000 levels again in the near term. But note 3-day support on the line charts which indicates that there could be some upside potential also in the near term.
Levels near 9100-8900 is very crucial to hold Nifty (9139.30, -0.13%) at higher levels and produce a bounce back in the medium term. For now, we may allow for a fall towards 9000-8900 in the near term but will have to keep a close watch on the price action near those levels.
COMMODITIES
Muted price action was seen in Bullion as traders are possibly in a pause mode and closely watching the geo-political scenario. Any negative surprise could trigger volatility into the markets.
Gold (1286) has closed at slightly lower levels from the crucial resistance of 1305. We continue to look for a bounce beyond 1305 levels in the near term. But before that gold may spend a few sessions within the 1265-1305 regions to overcome from its near term overbought condition.
Silver (18.36) has tested immediate support near 18.30 before closing slightly higher. A break below 18.30 could take it down to 17.70. Overall we need to wait for confirmation on a break on either side of the 18.30-18.65 region for immediate directional clarity.
Copper (2.58) has been stuck in the range of 2.55-2.70, with a pivot at 2.61. If copper could not trade above 2.61, it could fall towards 2.55 regions again. In the medium term 2.53-55 are going to be a strong support but a close below that could open up 2.50 and 2.45 levels respectively.
Brent (55.30) and WTI (52.59) have fallen from their resistance levels of 56.80 and 53 and trading within the range of 55-56.80 for Brent and 51.70-53 for WTI respectively. The trend is still bullish in the near to medium term time frame while they are within their respective ranges. Any corrective fall may face buying pressure at the lower levels. Only a fresh weekly rise in U.S. drilling activity could keep a lid on the bullish momentum.
FOREX
Dollar strength has been embraced by the US Treasury secretary, contrary to the view of the US president but that has helped Dollar to hold its ground and weaken Yen.
Dollar Index (100.26) has been consolidating in the narrow range of 100.00-50 for the last 4 sessions which may continue for another couple of sessions. Only a move above 100.70-85 can extend the rise to the major resistance at 101.30-40. Major support remains unchanged at 99.80.
In a similar way, Euro (1.0650) has been stuck in the range of 1.0600-80 for the last 4 sessions with no clear directional bias. Wait for a breakout from the broader range of 1.0550-1.0700 for a trending move but the sideways consolidation may continue for the week.
Dollar Yen (108.98) has bounced sharply from our support of 108.25 and now it requires a break above 109.25-40 to confirm an upside reversal. In case of a successful break above 109.25-40, higher level of 110.00 and 111.50 may come into consideration.
Pound (1.2565) remains almost unchanged near the major resistance of 1.2600-40. As discussed yesterday, while expecting the currency to oscillate in the range of 1.2350-1.2640 for the next few days, we may keep in mind the larger timeframe bullish possibility as a break above 1.2640 may signal a rise towards 1.2800.
Aussie (0.7560) rose above the resistance of 0.7595 for a brief moment before it came down in a correction. Still, another leg up towards 0.7640-75 may be pending if the immediate support of 0.7525 holds.
Dollar-Rupee (64.51) has shows intent to test the higher end of the near term range of 64.20-70 but no signs of any immediate breakout from the range is visible yet.
INTEREST RATES
The US yields may try to test the immediate support turned resistance levels in the next couple of sessions. In case it manages to break above the immediate support levels, we could see a rise towards 3.0-3.1% on the 30Yr yield and 2.45 on the 10Yr yield in the near term; else another leg of rejection may be anticipated in the near term.
The German yields look bearish for the near term. The 5Yr 9-0.52%), 10Yr (0.19%) and the 30YR (0.92%) are all trading low.
The UK yields are almost stable but look bearish for the coming sessions, the 10-5Yr (0.534%) may head towards 0.40% in the medium etrm.
USD/CAD Loonie Flat As Chinese GDP Get Cancelled By Late Dollar Rally
The Canadian dollar was slightly ahead of its US counterpart in the first trading session of the week. The CAD got a boost coming back from the Easter long weekend to the news of higher industrial production in China that beat expectations with a 7.6 percent gain. The Chinese GDP also improved on the forecast with a 6.9 gain. Commodity currencies improved based on the data out of China ahead of a week with few meaningful economic indicators, but plenty of political risk heading into the French elections on Sunday.
Oil prices fell as profit taking took place as crude has been on an upward trajectory and continues to be supported by comments from Organization of the Petroleum Exporting Countries (OPEC) on the success of the production cut agreement. The group of oil producers will meet in Vienna this weekend and sure to be in the agenda is the extension of the deal. Canadian and US producers have benefited from improved pricing, as they are not part of the cut and have raised the number of rigs in service.
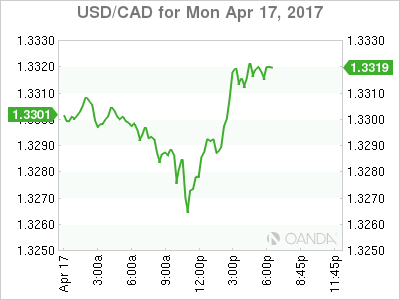
The USD/CAD lost 0.091 percent in the last 24 hours. The currency is trading at 1.3314 on a thin trading market as the Easter holiday is still in effect in some regions. The US dollar has been weaker against all majors, except the JPY, on comments from Treasury Secretary Mnuchin that confirmed that the failure to introduce healthcare reform will have a negative impact on proposed tax reforms targeted to get before congress before August.
The loonie will trade on little Canadian fundamental data with the Consumer Price Index (CPI) to be released on Friday, April 21 and forecasted to show a gain of 0.4 percent.
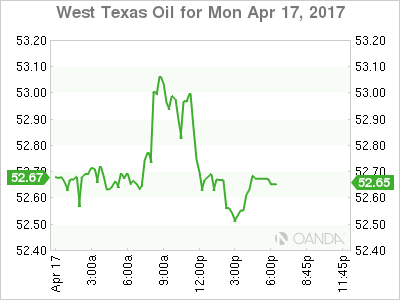
Energy prices lost 0.394 percent on Monday trading. The price of West Texas is trading at $52.55 after some investors decided to close longs after three weeks of gains. US production has put pressure on the rise of crude, but the OPEC has offset that with comments of a possible extension of the production deal that stabilized prices last year and got into effect in January of 2017.
Compliance was a huge question mark last year, but as numbers by the OPEC show all producers are close to full compliance. Russia is one of the nations that could do better, while Saudi Arabia is picking the slack by over cutting.
Oil prices have also been bid by the rise in geopolitical risk and potential disruptions to energy supplies. US Vice President Mike Pence warned North Korea today about testing the resolve of President Trump.
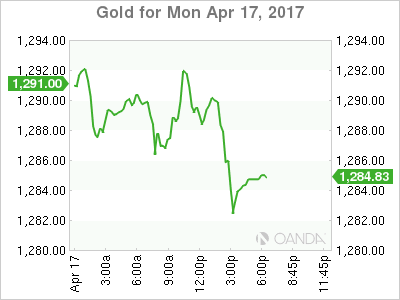
Gold lost 0.293 percent in the last 24 hours. The price of the yellow metal is trading at $1,283 after the appetite for risk has returned to markets slowly as more markets rejoin the trading cycle after the Easter holiday. Gold has traded as high as $1,295 in the session and thanks to geopolitical events triggering a flight to safety it could easily break above the $1,300 price level ahead of the French elections where a too close to call polls and the two round system creating a lack of interest could end up triggering another wave of anxiety.
Market events to watch this week:
Tuesday, April 18
8:30am USD Building Permits
Wednesday, April 19
10:30am USD Crude Oil Inventories
Thursday, April 20
8:30am USD Philly Fed Manufacturing Index
8:30am USD Unemployment Claims
11:30am GBP BOE Gov Carney Speaks
12:30pm GBP BOE Gov Carney Speaks
1:15pm USD Treasury Sec Mnuchin Speaks
Friday, April 21
4:30am GBP Retail Sales m/m
8:30am CAD CPI m/m
Saturday, April 22
All Day OPEC Meeting
Sunday, April 23
All Day French Elections
*All times EDT
(RBA) Minutes of the Monetary Policy Meeting of the Reserve Bank Board – 4 April 2017
Members Present
Philip Lowe (Governor and Chair), Guy Debelle (Deputy Governor), John Akehurst, Kathryn Fagg, John Fraser (Secretary to the Treasury), Ian Harper, Allan Moss AO, Carol Schwartz AM, Catherine Tanna
Others Present
Michele Bullock (Assistant Governor, Financial System), Luci Ellis (Assistant Governor, Economic), Christopher Kent (Assistant Governor, Financial Markets), Alexandra Heath (Head, Economic Analysis Department)
Anthony Dickman (Secretary)
International Economic Conditions
Members commenced their discussion of international developments by noting that conditions in the global economy had continued to improve over 2017. Survey measures of business conditions in both the manufacturing and services sectors were at high levels and growth in industrial production had increased further.
There had been a significant increase in the growth of global merchandise trade volumes. Data on merchandise imports suggested that stronger demand from east Asia (excluding Japan) and the United States had been an important source of this growth. At the same time, merchandise imports to some other emerging markets had stopped falling. Members noted that many economies had benefited from this increase in demand for traded goods; merchandise exports from Australia, much of Asia (excluding China) and other emerging economies had grown particularly strongly.
GDP growth was expected to be above potential over 2017 in all three major advanced economies, supported by accommodative monetary policies. As a result, spare capacity in the labour markets of these economies was likely to continue to decline.
Global inflation had increased, driven by the rise in oil prices over 2016. However, oil prices had been relatively stable since late 2016 and core inflation rates had remained low in most economies. This suggested that headline inflation could decline unless the reduction in spare capacity in the major advanced economies generated greater inflationary pressures.
The Chinese economy appeared to have strengthened over recent months, supported by accommodative financial conditions and increased public spending. Conditions in the residential property market had remained buoyant, although housing price growth had slowed sharply in those cities where policies to constrain speculative housing activity and price growth had been implemented. Growth in dwelling investment had increased over 2016 and growth in investment in the manufacturing sector had been stable since mid 2016. Members noted that growth in infrastructure investment had remained strong and had been significantly affected by policy settings in the past.
In the United States, household consumption was expected to be the key driver of expenditure growth, partly because of low borrowing costs and further improvements in labour market conditions and despite some indications that consumption growth had been weak at the start of 2017. In addition, investment intentions of the business sector had risen sharply. The risk of more protectionist policies remained, which could harm growth, but it was unclear what form these policies might take.
The prices of iron ore, oil and coking coal had declined since the previous meeting, but remained well above the lows of 2016. Other commodity prices had been little changed over the prior month. Members noted that the damage caused by Cyclone Debbie was likely to disrupt coking coal production in the Bowen Basin for a short time. Given that this is one of the largest coking coal-producing regions in the world (and accounts for around one-third of Australia's coal exports), short-term price increases were likely.
Members noted that iron ore production costs had declined significantly over the past five years and that Australian and Brazilian iron ore mines accounted for most of the lowest-cost iron ore production. Some Chinese producers had costs that were higher than the current iron ore price, partly because the quality of the iron ore deposits was relatively low. However, some of these mines remained open, possibly reflecting their vertical integration with steel mills, which were often state owned and accounted for a significant share of employment in particular regions.
Domestic Economic Conditions
Members commenced their discussion of the domestic economy by noting that conditions in the labour market had been somewhat weaker than had been expected. The unemployment rate had increased to 5.9 per cent in February and measures of underemployment – which capture workers who are willing and available to work more hours – had remained high. Overall, the ongoing spare capacity in the labour market was contributing to low wage growth outcomes.
Employment had declined a little in February but had increased by around 1 per cent over the preceding year; all of this growth had been in part-time employment. Employment outcomes had been strongest in Victoria, which had also experienced an increase in population growth following a rise in migration from other states and overseas. In contrast, employment outcomes had been weaker in New South Wales; employment conditions appeared to have remained strong in metropolitan Sydney, but had been relatively weak in regional areas. Employment outcomes in Western Australia were no longer deteriorating. Members noted that the adjustment of the labour market to changes in the locations and industries that were driving employment growth had not significantly boosted measures of structural unemployment. Forward-looking indicators of labour demand at the state level had been consistent with outcomes in the labour force data and continued to imply that aggregate employment growth could rise over coming months. However, members noted that these forward-looking indicators had been suggesting more positive employment outcomes than had been realised for some time.
Overall, GDP was likely to have expanded at a moderate rate in the March quarter. Early indications were that supply disruptions following Cyclone Debbie in Queensland and the floods in northern New South Wales were likely to be concentrated in coal production and some specific crops. At the time of the meeting, the overall effect on consumer prices and domestic demand growth, including from repairs and rebuilding, was not expected to be large. Survey measures of business conditions and confidence had remained above average.
Members observed that most of the large projects associated with the expansion of iron ore and coal production capacity in Australia had been completed. The remaining decline in mining investment expected over the subsequent year or so would, members noted, largely reflect the completion of liquefied natural gas (LNG) projects. Members discussed the high and rising supply of LNG into the Asian market over coming years and the implications for spot prices and Australian export volumes.
Indicators of household consumption had been a little weaker than expected in early 2017. The value of retail sales had fallen slightly in February, following average growth in January, and households' perceptions of their personal finances had declined to below-average levels. Retail price inflation had remained subdued, partly because competition had remained strong across the retail sector. Members noted that utilities prices were expected to put some upward pressure on retail costs, but that retail rents had been flat – or rising very marginally at most – across the major cities.
Conditions in the established housing market had continued to vary significantly by region. Housing price growth had been strongest in detached housing markets in Sydney and Melbourne and some indicators for the established housing markets in these cities had picked up in the preceding couple of months. In contrast, housing market conditions in Perth had remained weak, although there were signs that prices there may be stabilising. Vacancy rates had been increasing, particularly in Perth. Strong growth in the supply of new apartments was continuing to drive a wedge between price growth for apartments and detached houses in Melbourne and Brisbane. Private residential building approvals had rebounded in February; the large pipeline of work to be done was expected to support dwelling investment over the subsequent year or two.
Growth in housing credit to owner-occupiers had moderated slightly over the preceding six months, while growth in housing credit to investors had increased, although investor loan approvals had declined in February. Most of the increase in lending to investors had occurred in New South Wales and Victoria, which was consistent with the pattern of housing market activity. Members observed that the growth of housing credit to investors had initially moderated in response to the announcement by the Australian Prudential Regulation Authority (APRA) of a 10 per cent benchmark for investor credit growth in late 2014. In addition, the share of lending with high loan-to-valuation ratios had fallen. However, growth in investor credit had increased steadily since early 2016, despite the fact that banks had tightened lending standards and, on average, increased the margin between interest rates on investor housing loans and those on loans to owner-occupiers.
Financial Markets
Members commenced their discussion of financial markets with the observation that conditions generally had been relatively stable over the preceding month.
Members noted that the increase in the US federal funds rate in March had been well anticipated. Despite two increases in the federal funds rate since late 2016, financial conditions in the United States had eased slightly, including via a depreciation of the US dollar, a decline in corporate bond yields and a rise in equity prices. At the March meeting, the assessment by members of the Federal Open Market Committee of the appropriate course for monetary policy was unchanged, with the median projection being for two further increases in the policy rate in 2017. Market pricing continued to suggest a slightly slower pace of tightening than the official projections.
The European Central Bank (ECB) and the Bank of Japan had both left their policies unchanged in the prior month, while noting that domestic economic activity was improving. Market pricing implied that participants did not expect a further reduction in the ECB's deposit rate and, indeed, had some expectation of a small increase in the deposit rate by mid 2018.
There had been a marginal tightening in money market conditions in China in March, via another small increase in the cost of various lending facilities provided by the People's Bank of China. The renminbi had depreciated slightly on a trade-weighted basis, moving in line with the US dollar; this took it to its lowest level on a trade-weighted basis since 2014. Official reserve assets in China had stabilised around US$3 trillion and there appeared to have been some net private inflows of capital of late.
Conditions in sovereign bond markets had not changed noticeably over the prior month. The United Kingdom's formal notification of its intention to withdraw from the European Union had had little effect on financial market prices in the United Kingdom, with both the value of the pound and gilt yields little changed.
In Australian financial markets, government bond yields had been little changed over the prior month. Australian equity prices had increased and were noticeably higher than a year earlier. Prices of resource companies had declined in the preceding few months while prices of shares in other sectors, particularly the financial sector, had increased over March.
The Australian dollar was broadly unchanged against the US dollar and on a trade-weighted basis over the preceding month, but had appreciated over the previous year.
Members discussed the recently announced increases in housing lending rates. The increases had been mainly in response to prudential measures introduced by APRA in 2014 to slow the growth in lending to housing investors and preceded measures announced by APRA in late March to restrain the growth of interest-only lending. Funding costs had not changed significantly. At the point that these latest increases were to come into effect, the cumulative increase since November would be an average of around 25 basis points for loans to investors with scheduled repayments of principal and interest, and only a slight increase for loans of this type to owner-occupiers. In addition, by April the four major banks all would have introduced higher interest rates for interest-only lending, with an average premium relative to principal and interest lending of around 15 basis points. As a result, investors with interest-only loans on variable rates would be facing benchmark interest rates similar to those that applied to the same product about three years earlier. Members noted that the margin between lending rates on principal and interest loans and interest-only loans had increased by more for owner-occupiers than for investors.
Issuance of residential mortgage-backed securities by Australian financial entities had been strong in the preceding few months, although this represented a small share of total lending and remained well below pre-financial crisis levels.
Members noted that pricing in financial markets indicated no expectation of a change in the cash rate at the April meeting or over the remainder of the year.
Financial Stability
Members were briefed on the Bank's half-yearly assessment of the stability of the financial system.
Risks related to household debt and the housing market more generally had increased over the preceding six months. However, the nature of those risks differed across the country, according to the varying conditions and activity in local markets. Although credit to the household sector had been growing modestly relative to history, growth had been faster than income growth and the aggregate debt-to-income ratio for households had increased.
Nevertheless, indicators of financial stress in the household sector remained contained. Low interest rates and improved lending standards over recent years had been supporting households' ability to service debt, and households on average had continued to build repayment buffers. Members noted, however, that some households with home loans appeared to have little or no buffer of excess mortgage repayments and could be vulnerable if household income were lower than expected. This observation emphasised the importance of realistic assessments of household expenses and prudent lending standards for mitigating risks to both financial stability and macroeconomic outcomes.
Members discussed the recent actions taken by APRA and the Australian Securities and Investments Commission to support prudent lending practices. These actions had been focused particularly on interest-only lending, serviceability assessments and responsible lending practices. APRA's guidance had included limits on the share of interest-only loans in new housing loans and a requirement that banks impose strict limits on new interest-only lending at high loan-to-valuation ratios. Members recognised that the calibration of this guidance was not precise or straightforward. Developments needed to be kept under review and, depending on how the system responds to the various measures, members noted that the Council of Financial Regulators would consider further measures if needed.
Members observed that a number of factors make interest-only loans attractive in the Australian context. In particular, interest-only loans allow investors to take greatest advantage of particular features of the tax system, while the availability of offset accounts provides some owner-occupiers with opportunities to manage liquidity risks that might be associated with irregular income, for example.
Members noted that some banks had curtailed lending to some segments of the housing market, notably the Brisbane apartment market, where the supply of apartments was expected to increase significantly, raising the risks associated with oversupply. Reports of settlement failures had remained isolated. Members also noted the higher interest rates facing most investors, especially those with interest-only loans.
Developments in commercial property markets mirrored the geographic pattern seen in residential property markets. Conditions had been strengthening in Sydney and Melbourne but were weaker elsewhere. Valuations were generally high, however, and posed some risk to leveraged investors if prices were to decline sharply. Members were briefed on APRA's recent review of commercial property lending. This review revealed some instances of weak underwriting standards and poor monitoring of risk profiles among lenders; several Australian banks had since tightened their lending standards.
Members observed that, in contrast to the growing risks faced by the household sector, vulnerabilities in the non-financial business sector remained low. Outside Western Australia, business failure rates had declined. Profitability had been supported by higher earnings for resource-related firms, following the increase in commodity prices. Gearing ratios and other measures of the strength of businesses' balance sheets had generally been around their historical averages.
Members noted that the Australian banks continued to be well placed to manage the challenges they faced. The banks remained highly profitable in the second half of 2016 and the performance of their assets had been little changed. Their capital ratios and liquidity structures had strengthened over the prior year or so. Members noted that further increases in capital could be expected once APRA finalises its new standards to ensure that banks are 'unquestionably strong', and that banks were expected to be able to accumulate any required additional capital. The domestic banks had also taken steps to reduce the risk profile of their balance sheets, having divested some higher-risk and low-return assets in recent years. In addition, they had tended to slow the growth in their exposures to commercial property, particularly residential and land development lending. Some risks from their businesses in New Zealand had probably diminished, as global milk prices had risen, although risks related to housing markets in New Zealand remained.
Members observed that the nature of the risks to global financial stability had changed over the preceding six months as the economic outlook had improved and longer-term interest rates had risen. In particular, there was an increased risk that future portfolio adjustments could prove disruptive. Prices of some assets had reached high levels, which could reverse if interest rates rose particularly quickly or if the outlook for growth in some economies were reassessed. Risks related to some international political developments had also increased over the preceding six months, although markets had generally reacted in an orderly manner so far.
Members noted that longstanding vulnerabilities remained in some banking systems overseas. Performance of the European banking sector had remained weak, weighed down by high levels of non-performing loans, relatively high cost bases and other legacy issues. Low profitability impeded these banks' ability to improve their capital positions. Risks also remained elevated in China. Debt levels had continued to grow rapidly, particularly debt acquired through less regulated channels and possibly by higher-risk borrowers. Some measures of loan performance had deteriorated. Slowing growth in profits in some industries could impinge on some borrowers' capacity to service their debts.
Considerations for Monetary Policy
In considering the stance of monetary policy, members noted that recent data had provided more confidence that global growth was rising and that the pick-up was broadly based across both developed and emerging economies. Growth in both global trade and industrial production had increased and indicators of global consumer and business sentiment had been above average. Further reductions in spare capacity were expected in the major advanced economies. However, various policy, financial and geopolitical risks would still need to be closely watched.
Headline inflation had increased in most economies, mainly reflecting higher oil prices over the first part of 2016. Members noted that, while the effect of higher oil prices might dissipate, further reductions in spare capacity in the major advanced economies could be expected to see a lift in inflation.
The improvement in global economic conditions had contributed to higher commodity prices overall. This was expected to have provided a significant boost to Australia's national income in the March quarter. However, iron ore prices had fallen since late March, which suggested that the Australian terms of trade were still likely to decline in the period ahead from their recent highs.
Recent data suggested that the Australian economy had continued to grow moderately at the beginning of 2017, supported by the low level of interest rates. Indicators of household consumption had been a little weaker than expected, which was consistent with softer conditions in the labour market. Although forward-looking indicators of labour demand continued to suggest an increase in employment growth over the period ahead, this had been true for some time without leading to an improvement in labour market conditions. Most measures of business confidence were at, or above, average and non-mining business investment had risen over the prior year in parts of the country less affected by the transition following the end of the mining investment boom. The depreciation of the exchange rate since 2013 had assisted the economy during this transition; an appreciating exchange rate would complicate the adjustment process.
Conditions in housing markets continued to vary considerably across the country. The established markets in Sydney and Melbourne appeared to have strengthened further, but housing prices had continued to fall in Perth. The additional supply of apartments scheduled to come on stream over the subsequent couple of years in the eastern capital cities was expected to put some downward pressure on growth in apartment prices and rents, particularly in Brisbane.
Growth in housing credit continued to outpace growth in household incomes, suggesting that the risks associated with the housing market and household balance sheets had been rising. Recently announced supervisory measures were designed to help mitigate these risks by reinforcing prudent lending standards and ensuring that loan serviceability was appropriate for current conditions. Less reliance on interest-only housing loans was also expected to increase the resilience of household balance sheets. However, it would take some time to assess fully the effects of the recent pricing changes and the increased supervisory attention.
Headline inflation was expected to pick up over 2017 to be above 2 per cent. However, the rise in underlying inflation was expected to be more gradual; wage growth and broader measures of labour cost pressures remained subdued and competition in the retail sector continued to be strong.
Taking into account the available information, the Board judged that holding the stance of monetary policy unchanged would be consistent with sustainable growth in the economy and achieving the inflation target over time. The Board judged that developments in the labour and housing markets warranted careful monitoring over coming months.
The Decision
The Board decided to leave the cash rate unchanged at 1.5 per cent.
Ebb And Flow
Ebb and Flow
The USD traded with an offered bias during the last 24 hours weighed down by Geopolitical concerns and Friday's US CPI report. However, there was a small shift in fortunes as weak dollar shorts ( USDJPY) were pared after comments from US Treasury Secretary Mnuchin that indicated that US tax reform is still scheduled for 2017. And for the short term Fx Traders regarding President Trump's 'too strong dollar ' comments last week' and sounding very mainstream while taking down the President's verbal swipe at the dollar, Mnuchin stated, 'The president was making a factual comment about the strength of the dollar in the short term . . . There's a big difference between talk and action.'
Outside of Mnuchin dollar supportive comments, overnight currency price action indicates a greater overhang from Friday's US CPI as the dollar remained offered despite the geopolitical risk tapering.Before Mnuchin comments. USDJPY spent most of the session testing 108.50 and positioned above 109.00 in early APAC.
Given that FX positioning is running meek in the face of geopolitical concerns and the upcoming French elections, this week's first price action has been dictated by short term players and when coupled with liquidity being rather light whippy and scrappy currency moves should be the flavour of the week. We should expect liquidity in currency markets to contract further as we near the weekend's critical French election vote leading to piecemeal trading conditions at best.
Japanese Yen
It's hard to turn the page on the regional geopolitical risk at this juncture so that the overhang may keep the dollar bulls at bay, despite soothing comments overnight from US Treasury Secretary Mnuchin.
Short-term traders will be glued to headlines from today about the Aso-Pence interchange. It's very unlikely any hawkish US views on trade policy will be forthcoming, which could be mildly supportive for the USD. With Geopolitical risk temporarily abating, we may see some buying back of the Geo risk premium during today's session, which could also support the USD in the short term.
The French election risk is simmering as EURJPY flows are likely to also weigh on USDJPY. With UST haven appeal still in vogue, it too should encourage any near term USDJPY rallies to be capped.
Overall, there is a high level of reluctance to do anything as traders are shy to expand on the Geopolitical theme and in no mood to buy the dollar after the latest tepid US economic data. All in all, investors are content to sit idle, waiting for the storm clouds to break before re-engaging, even if it means being caught behind the initial market moves post-French election.
Australian Dollar
The Aussie caught the wind in its sails from Chinese economic data on Monday, and the soft US core CPI figures for February released on Friday but faltered when US Treasury Secretary Mnuchin talked down President Trump's verbal jab at the Greenback late last week. As with most of the G-10 space, positioning is running light as there's a reluctance from dealers to chase current price action with regional geopolitical risk weighing and French election uncertainty brewing.
Daily Technical Analysis: EURUSD, GBPUSD, USDJPY, USDCHF
EURUSD
The EURUSD attempted to push higher yesterday topped at 1.0670 but closed a little bit lower at 1.0642. The pair is still traded in narrow range. The bias remains neutral in nearest term probably with a little bullish bias testing 1.0700 region. Price is still in a bearish phase since the false break above 1.0873 but still respecting the trend line support as you can see on my H4 chart above. Immediate support is seen around 1.0615 followed by 1.0575 which needs to be clearly broken to the downside to continue the bearish phase testing 1.0500 area. On the upside, a clear break and daily close back above 1.0700 would expose 1.0873 key resistance once again. Overall I remain neutral.
GBPUSD
The GBPUSD attempted to push higher yesterday topped at 1.2596 but closed a little bit lower at 1.2561. The bias remains neutral in nearest term probably with a little bullish bias retesting 1.2615 resistance area. A clear break and daily close above that area would expose 1.2700 – 1.2750 region. Immediate support is seen around 1.2520 followed by 1.2480. Overall I remain neutral.
USDJPY
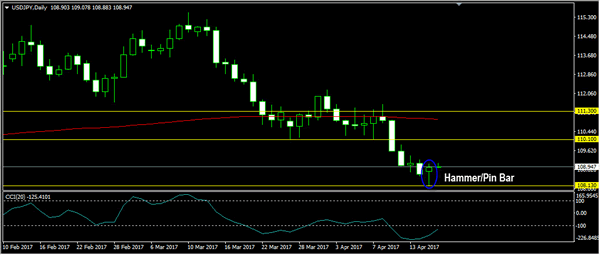
The USDJPY attempted to push lower yesterday bottomed at 108.13 but closed higher at 108.90. The bias is neutral in nearest term. As you can see on my daily chart above, we have a hammer/pin bar formation after a bearish trend suggests a potential bullish pullback/reversal scenario. Overall I remain bearish, but need a clear break below 108.13 to reactivate my bearish mode targeting 107.50 or lower. Immediate resistance is seen around 109.30. A clear break above that area could trigger further bullish pullback testing 109.85 – 110.10 resistance area.
USDCHF
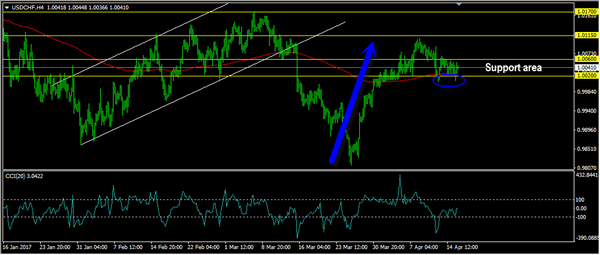
The USDCHF didn’t make significant movement yesterday. There are no changes in my technical outlook. The bias remains neutral in nearest term. As long as stay above 1.0020 price is still in a bullish phase targeting 1.0115 and 1.0170 resistance levels. On the downside, a clear break and daily close back below 1.0020 would end the bullish phase testing 0.9970 or lower. Overall I remain neutral.
Trading Psychology Thoughts And An AUD/NZD Retest
I take it that everyone who had the opportunity of a long weekend enjoyed the time away from their charts whether they celebrate Easter or not. The mental aspect of trading is so important and with many of us so passionately trading a market that is open 24 hours a day, it leaves us open to burnout if we don't take time off when it is presented to us.
Always remember that the markets aren't going anywhere. There is always another trade waiting for you just around the corner whenever you come back and open your charts again after taking a break. This is something that is so easy to lose sight of but so integrally important to your long term profitability.
Turning our focus away from trading psychology and back to the charts, I wanted to bring attention back to a blog that we posted at the very beginning of March where AUD/NZD was higher after Australian GDP.
This is an excerpt from the blog which includes an AUD/NZD daily chart at a key level:
Interestingly, price is still being capped by the top of the daily resistance zone higlighted in yesterday's original trade idea.
AUD/NZD Daily:
This level will continue to be the key as to which way we look to trade the pair.
If price stays under it, then we will look for shorts (or stay in shorts if your stop was still above this higher time frame level).
If price moves above it, then we will look for longs on any short term pullbacks.
Now we fast-forward back to the present and as you can see from the chart below, we're back at that key level but this time testing it from the top as support:
AUD/NZD Daily:
With the daily support zone looking to have held, from here we will look to zoom into an intraday chart and search for any short term pullbacks to previous resistance turned possible support to get long off. By zooming into a lower time frame chart and looking for trades in the direction of the higher time frame support level that just held, you are giving yourself that extra bit of confirmation that you're trading in the direction the market is headed. The path of least resistance if you will.
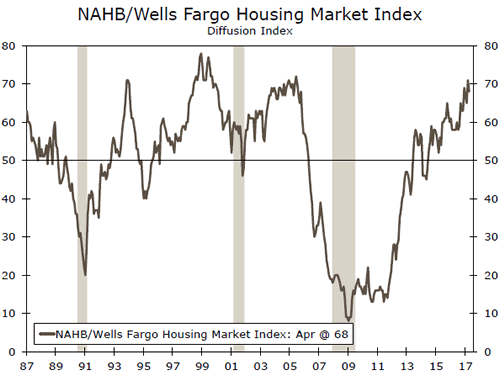
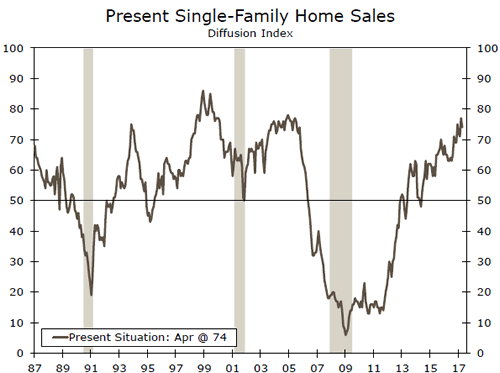
Homebuilder Confidence Falls in April
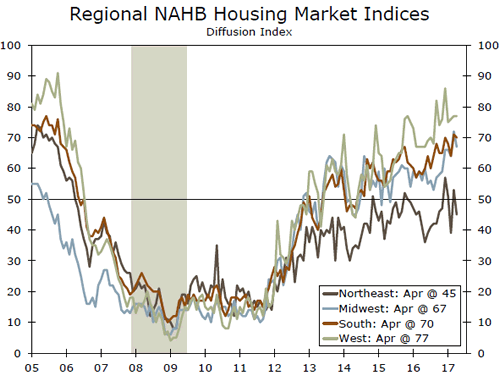
The NAHB/Wells Fargo Housing Market Index fell 3 points in April as all components declined on the month. Despite the dip, the index remains at a level consistent with continued gains in new home construction.
Despite Dip, Sentiment Remains Solid
After hitting a fresh cycle-high in March, the NAHB Housing Market Index (HMI) fell 3 points in April to 68. All three HMI components edged lower on the month. The current sales and expected sales measures each fell 3 points.
Despite the pull-back, confidence remains relatively high. The present sales index has trended above 70 for five consecutive months, signaling strong demand for new homes.
Continued Improvement in Residential Construction
All areas except the West saw sentiment fall in April. After a late season blast of winter weather, the Northeast reported an 8-point drop, partially reversing March's 14-point rise.
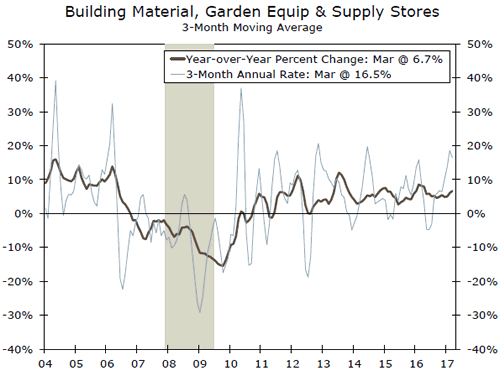
The solid readings for builder sentiment coincide with stronger reports for retail sales at home improvement stores, which are up solidly on a three-month annualized basis. Residential investment is one of the few bright spots for first quarter growth.
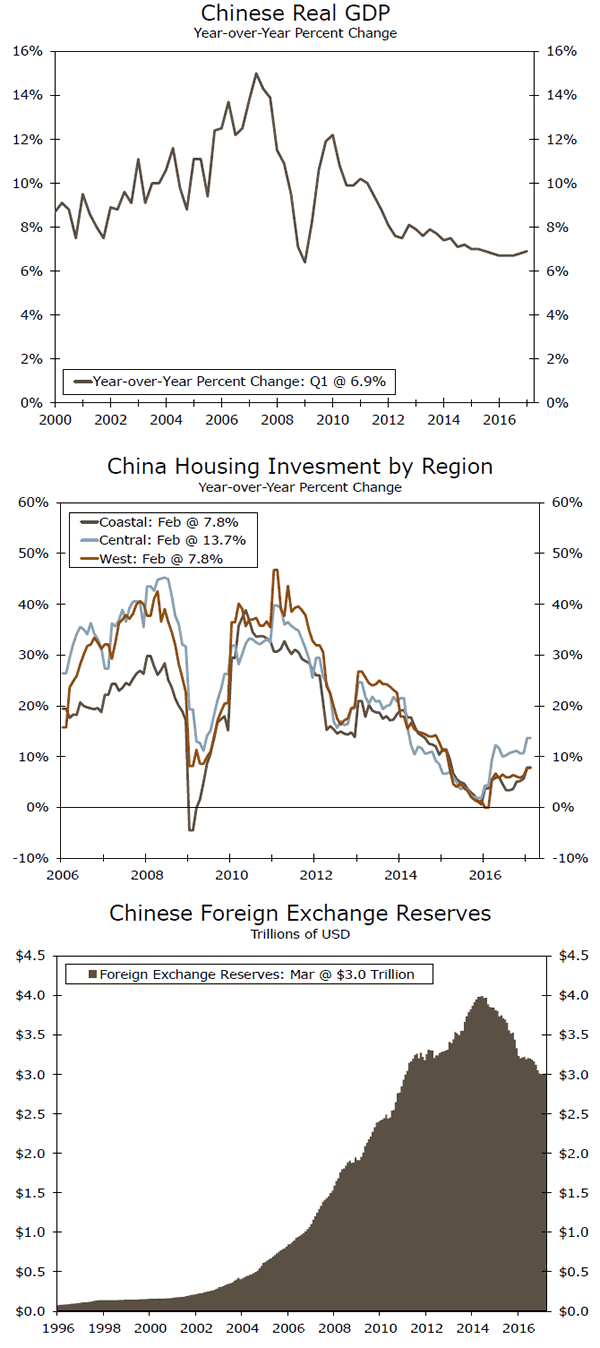
Chinese GDP Beats Expectations to Start 2017
Chinese GDP grew 6.9 percent in Q1, providing further evidence that economic growth is stabilizing following a gradual deceleration in GDP. Notable strength in the industrial sector boosted the headline number.
Chinese GDP Growth Stabilizing
Data released today reveal that Chinese GDP grew 6.9 percent in Q1-2017, slightly beating the consensus forecast which called for 6.8 percent. Over the last three quarters, Chinese GDP has grown 6.7 percent, 6.8 percent and 6.9 percent, representing an upward trend that has reversed the previous gradual slide in GDP growth rates (top chart).
While a breakdown of GDP into its demand components is not available at this time, examining the supply side factors can offer useful insights into the drivers of growth. Growth in the secondary industry, which includes mining/quarrying, manufacturing, construction and utilities production, rose to 6.4 percent year over year, following just 6.1 percent the previous quarter. The secondary industry accounts for roughly 40 percent of the value added in the Chinese economy. Growth in the primary industry, which includes agriculture, forestry and fishing slowed to 3.0 percent in Q1 from 3.3 percent in Q4. Likewise, growth in the tertiary industry, or the service sector, slowed to 7.7 percent in Q1 from 7.8 percent in Q4.
Strength in the secondary sector can partially be attributed to a rebound in overall investment spending, which increased 9.2 percent in March - its highest year-over-year rate of growth since May of last year. Investment in the Chinese housing market has shown a similar rebound, growing 8.9 percent in February of this year. Housing investment has been on a gradual upward trend since December 2015, reversing a slide in growth that began in mid-2010. The rebound in housing investment is not concentrated in a few select cities, but is rather a phenomenon across all three super-regions of China: Coastal, Central, and West regions (middle chart). The turnaround in housing investment has seemed to provide a boost to the construction sector, which is contained in the secondary industry. Although we do not expect housing investment growth rates to return to the 30 percent rates we witnessed during 2010-2011, continued government support for lending should buoy investment in the sector and for the foreseeable future.
No Longer Hemorrhaging FX Reserves
As we wrote in a previous report, the Chinese central bank was selling its foreign exchange (FX) reserves in an attempt to slow the depreciation of its currency. As a result, China's FX reserves receded from nearly $4 trillion in mid-2014 to about $3 trillion today (bottom chart). In January of this year, China's FX reserves dipped below $3 trillion for the first time since early 2011. However, concerns have started to dissipate after FX reserves reversed their outflows and increased in February and March, albeit at a very modest rate. Moreover, against the backdrop of a Fed that is in the midst of tightening rates, our currency strategy team expects the Chinese renminbi to depreciate, modestly, against the U.S. dollar.