Sample Category Title
GBP/USD Weekly Outlook
GBP/USD's strong rebound last week argues that rise from 1.2108 is still in progress. And more importantly, the consolidation pattern from 1.1946 could extend with another rise. Further rise will now be mildly is favor as long as 1.2365 support holds.
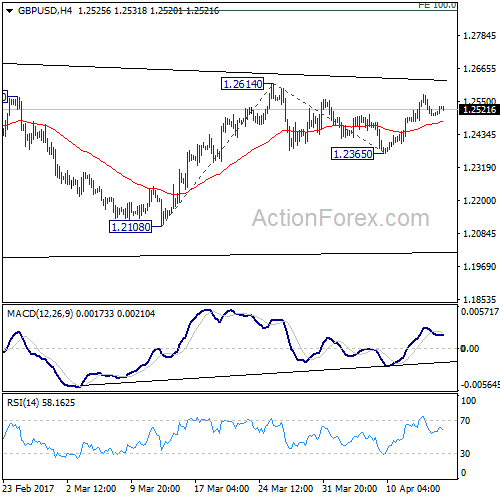
Further rise is expected in GBP/USD this week as long as 1.2365 support holds. Break of 1.2614 will resume rise from 1.2108 and target 100% projection of 1.2108 to 1.2614 from 1.2365 at 1.2871. But overall, price actions from 1.1946 low are viewed as a consolidation pattern. We'd expect strong resistance around 55 week EMA (now at 1.3034) to limit upside and bring down trend resumption. Meanwhile, break of 1.2365 will turn bias back to the downside for 1.2108 support.
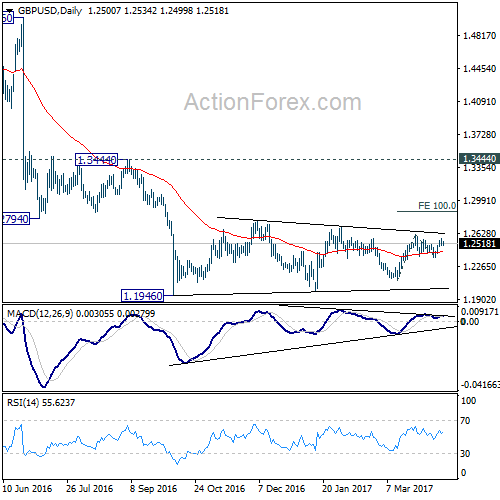
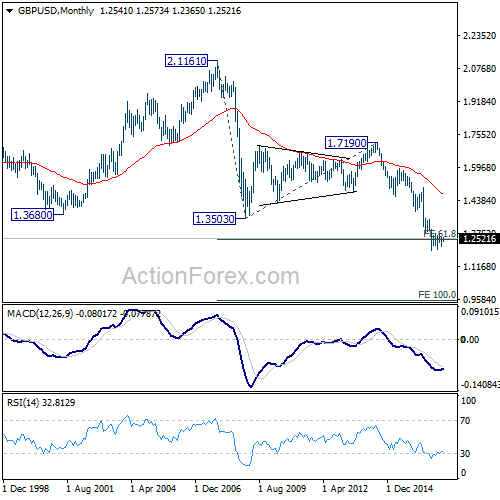
In the bigger picture, fall from 1.7190 is seen as part of the down trend from 2.1161. There is no sign of medium term reversal yet. Sustained trading below 61.8% projection of 2.1161 to 1.3503 from 1.7190 at 1.2457 will target 100% projection at 0.9532. Overall, break of 1.3444 resistance is needed to confirm medium term bottoming. Otherwise, outlook will remain bearish.
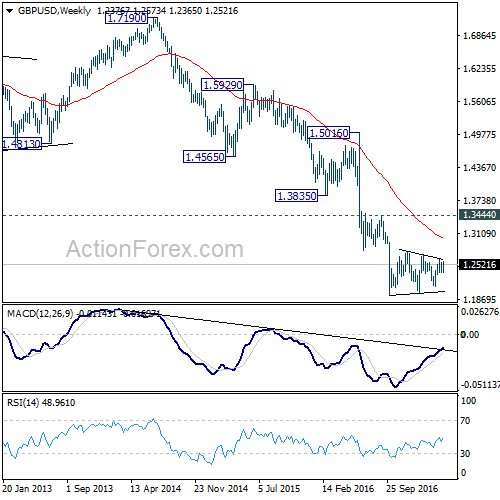
In the longer term picture, no change in the view that down trend from 2.1161 is still in progress. Current momentum suggests that the down trend will go deeper than originally expected to 100% projection of 2.1161 to 1.3503 from 1.7190 at 0.9532.
USD/CHF Weekly Outlook
USD/CHF edged higher to 1.0107 last week but retreated since then. The retreat from there is contained above 0.9980 support and thus, bullish outlook is maintained. That is corrective from 1.0342 has completed with three waves down to 0.9812. And, rise from 0.9548 is resuming.
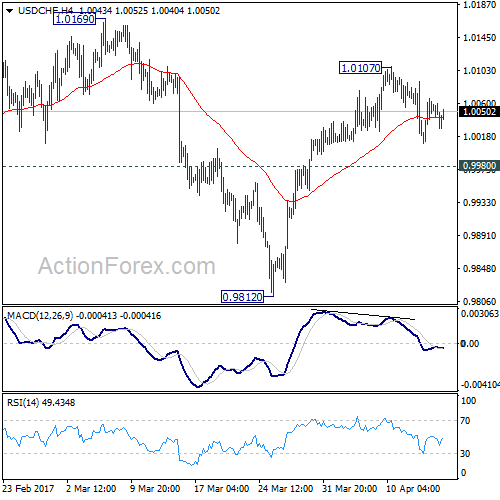
Initial bias in USD/CHF remains neutral this week first. Break of 1.0107 will turn bias to the upside for 1.0169 resistance. Break there should confirm our bullish view and should target a test on 1.0342 key resistance next. However, below 0.9980 will dampen this bullish case and turn bias back to the downside for 0.9812 low.
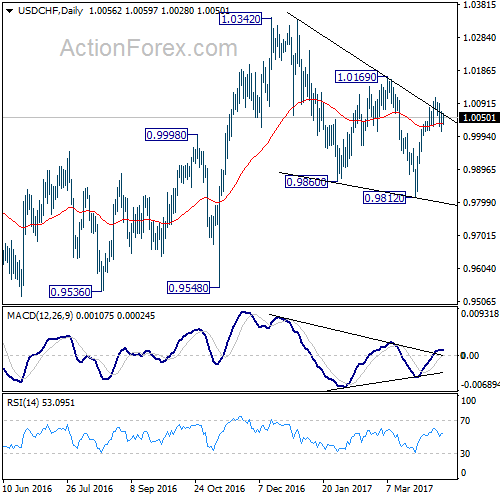
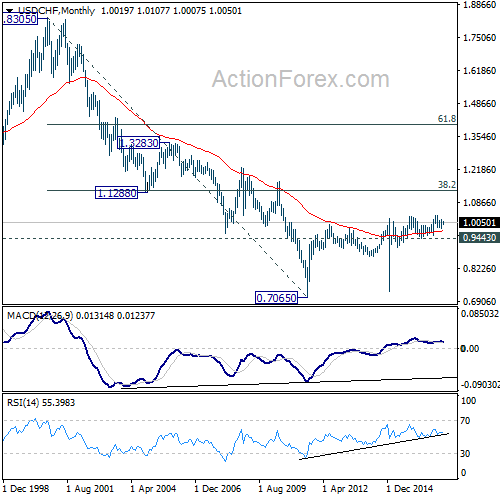
In the bigger picture, we're still maintaining that firm break of 1.0342 key resistance is needed to confirm underlying bullish momentum in the cross. However, the corrective nature of the fall from 1.0342 to 0.9812 is starting to give the medium term outlook a bullish favor. Hence, in stead of looking for topping signal around 1.0342, we'd now pay closer attention to upside acceleration as USD/CHF approaches this level again.
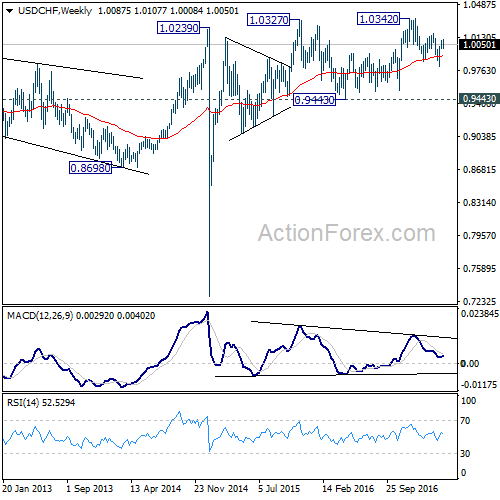
The long term outlook in USD/CHF stays a bit mixed for the moment. But in case of another medium term fall, we'd expect strong support from 0.9443/9548 support zone. Meanwhile, firm break of 1.0342 will target 38.2% retracement of 1.8305 to 0.7065 at 1.1359.
AUD/USD Weekly Outlook
AUD/USD dipped to 0.7472 last week but failed to sustain below 0.7490 support and rebounded. The development argues that rise from 0.7158 is possibly not completed yet. And another rally could be seen through 0.7748 resistance to test key long term fibonacci level at 0.7849.
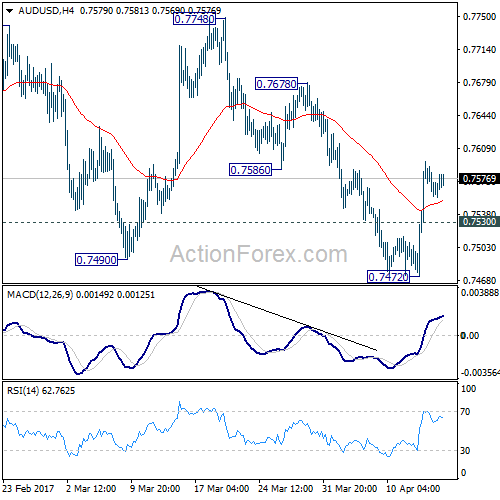
Initial bias in AUD/USD is mildly on the upside this week for 0.7678 resistance. Break there will confirm completion of the pull back from 0.7748. And rise from 0.7158 would be resuming. AUD/USD should target 0.7748 and above next. On the downside, below 0.7530 minor support will turn bias neutral again, with focus back on 0.7472 support.
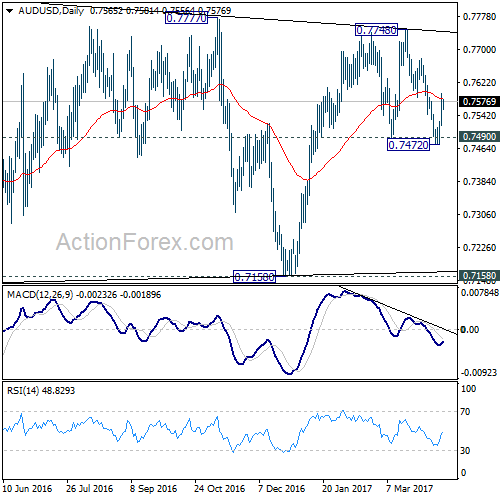
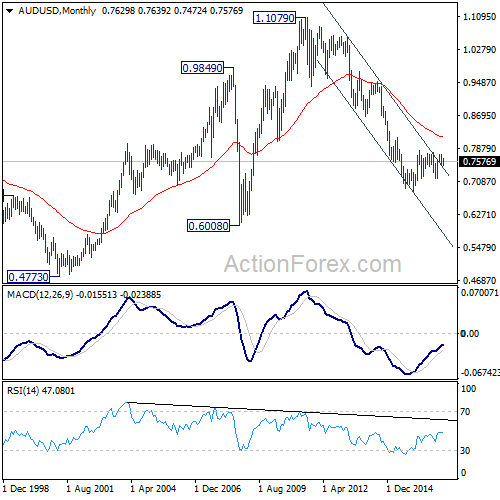
In the bigger picture, we're still treating price actions from 0.6826 low as a correction. And, as long as 38.2% retracement of 0.9504 to 0.6826 at 0.7849 holds, long term down trend from 1.1079 is expected to resume sooner or later. Break of 0.6826 low will target 0.6008 key support level. However, firm break of 0.7849 will indicate that rise from 0.6826 is developing into a medium term rebound, rather than a sideway pattern. In such case, stronger rise should be seen to 55 month EMA (now at 0.8144) and above.
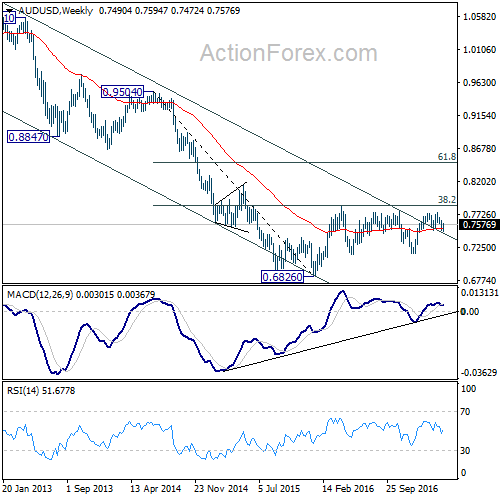
In the longer term picture, while the down trend from 1.1079 might extend lower, we're not anticipating a break of 0.6008 (2008 low) yet. We'll look for bottoming above there to reverse the medium term trend.
USD/CAD Weekly Outlook
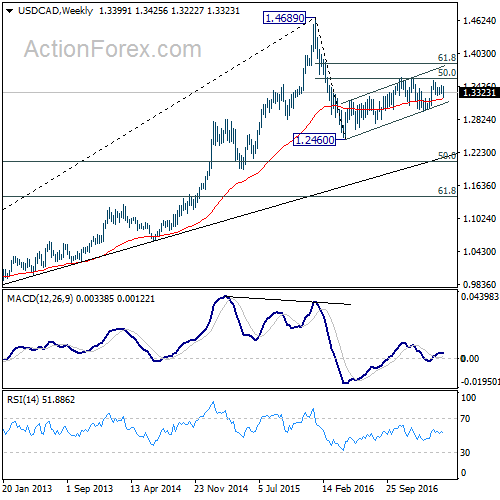
USD/CAD dipped to as low as 1.3222 last week but recovered strongly since then. The is no change in the view that price actions from 1.3534 are forming a consolidation pattern. Therefore, rise from 1.2968 and 1.2460 are not completed yet. Further rally would be seen through 1.3598 after consolidation from 1.3534 is confirmed to be finished.
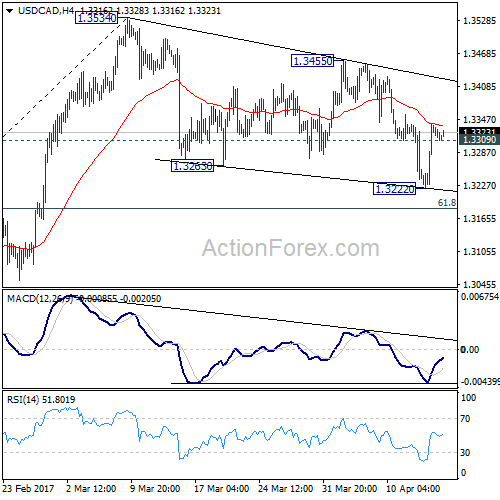
Strong rebound from 1.3222 and break of 1.3309 suggests that consolidation from 1.3534 is completed. Initial bias is back on the upside this week for 1.3455 resistance first. Break should confirm this case and resume the rise from 1.2968 to 1.3598 next. Break there will confirm resumption of whole rise from 1.2460 to next medium term fibonacci level at 1.3838. On the downside, in case of another fall, we'd expect strong support from 61.8% retracement of 1.2968 to 1.3534 at 1.3184 to contain downside and bring rebound.
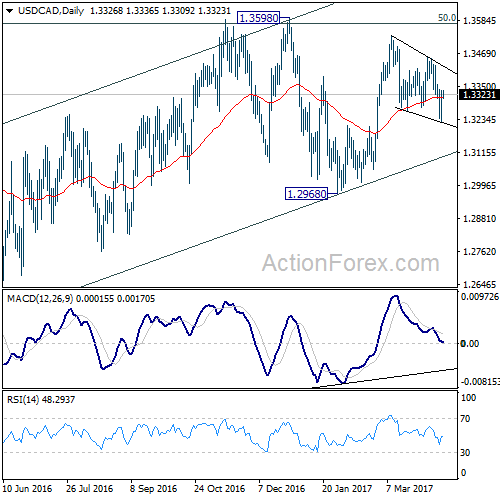
In the bigger picture, price actions from 1.4689 medium term top are seen as a correction pattern. The first leg has completed at 1.2460. The second leg from 1.2460 is likely still in progress and could target 61.8% retracement of 1.4689 to 1.2460 at 1.3838. We'd look for reversal signal there to start the third leg. However, break of 1.2968 will argue that the third leg has already started and should at least bring a retest of 1.2460 low. Meanwhile, sustained trading above 1.3838 would pave the way to retest 1.4689 high.
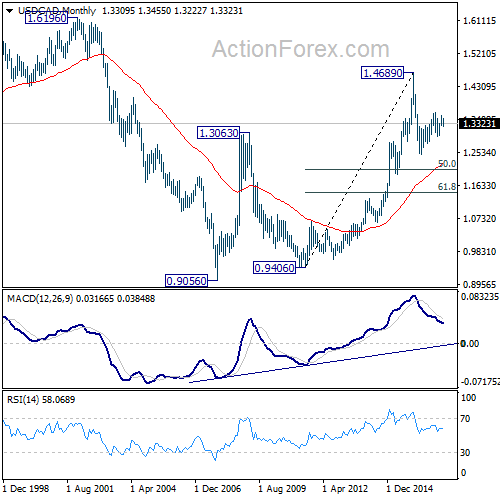
In the longer term picture, rise from 0.9056 (2007 low) is viewed as a long term up trend. It's taking a breath after hitting 1.4689. But such rise expected to resume later to test 1.6196 down the road.
GBP/JPY Weekly Outlook
GBP/JPY's choppy fall from 144.77 extended last week and reached as low as 135.99. Such decline is expected to continue to medium term fibonacci level at 135.29. At this point, since we're viewing price actions from 148.42 as a corrective pattern. We'll look for support from 135.29 to contain downside and bring rebound.
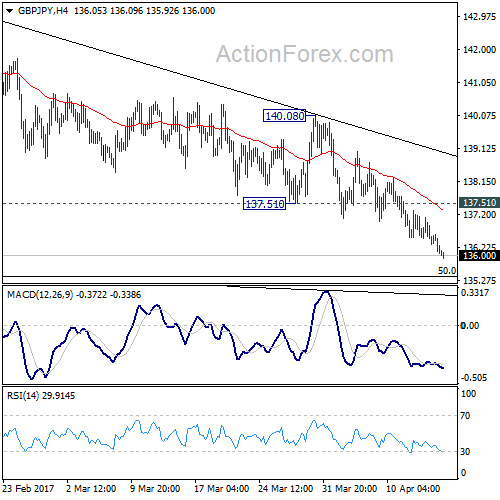
Initial bias in GBP/JPY remains on the downside tis week for medium term fibonacci level at 135.39. We'd anticipate strong support from there to bring rebound. On the upside, break of 137.51 support turned resistance will turn intraday bias back to the upside. Break of 140.08 resistance will confirm near term reversal. However, sustained break of 135.39 will dampen our view and target next fibonacci level at 132.31.
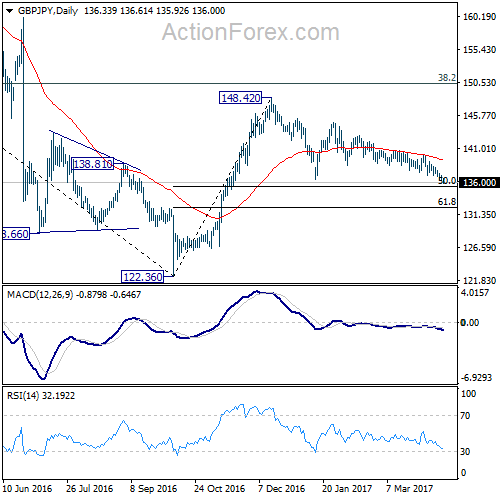
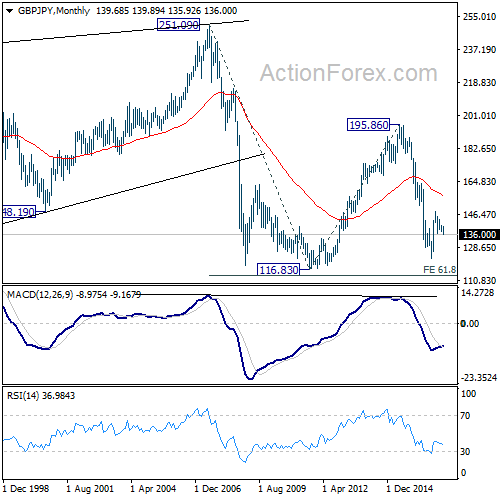
In the bigger picture, price actions from 122.36 medium term bottom are still seen as a corrective pattern. As long as 50% retracement of 122.36 to 148.42 at 135.39 holds, another rising leg would be seen to 38.2% retracement of 195.86 to 122.36 at 150.42 and possibly above. However, firm break of 135.39 will bring retest of 122.36, with prospect of resuming the larger down trend from 195.86.
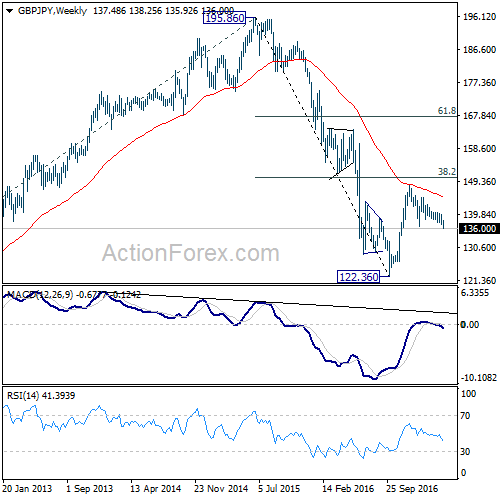
In the longer term picture, while price actions from 122.36 would develop into a medium term correction, fall from 195.86 is still seen as resuming the down trend from 251.09 (2007 high). Hence, after the correction from 122.36 completes we'd expect another fall through 116.83 low.
EUR/JPY Weekly Outlook
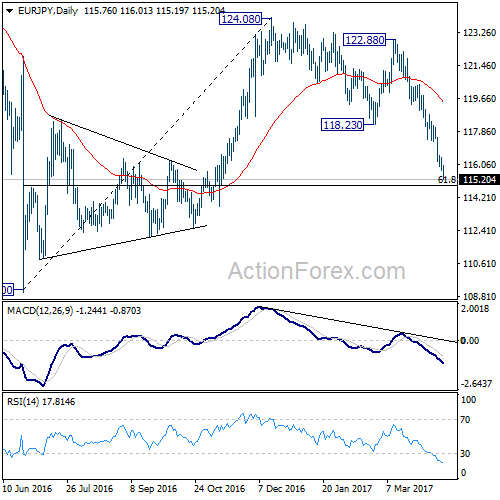
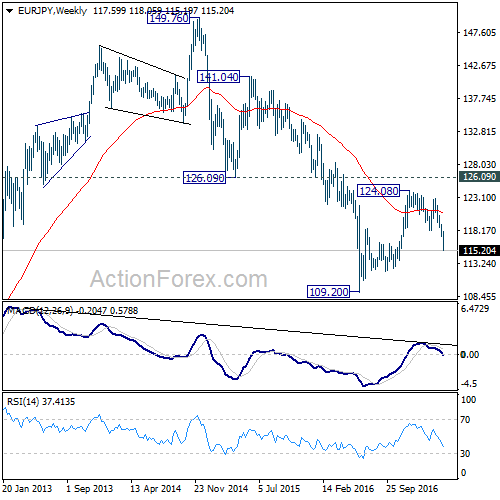
EUR/JPY's fall from 124.08 continued last week and reached as low as 115.19. The development is consistent with our view that corrective rise from 109.20 has completed at 124.08. And further fall is expected to retest 109.20.
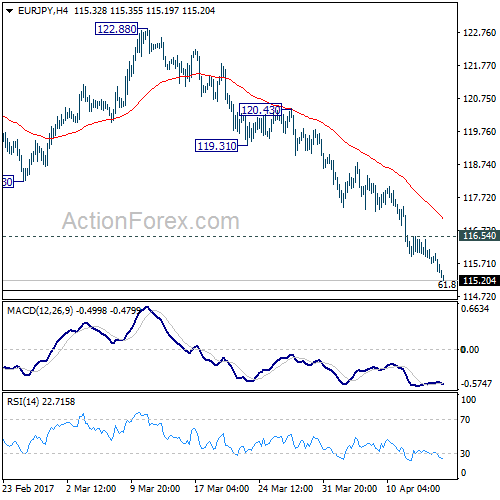
Initial bias in EUR/JPY remains on the downside this week for 61.8% retracement of 109.20 to 124.08 at 114.88. Sustained break of 114.88 will pave the way for retesting 109.20 low. On the upside, above 116.54 minor resistance will turn intraday bias neutral and bring recovery. But upside should be limited by 118.23 support turned resistance and bring fall resumption.
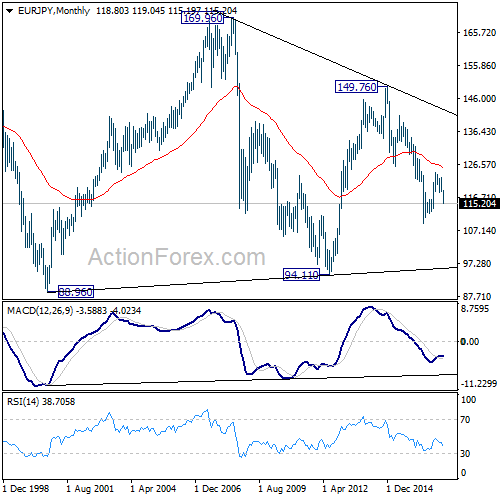
In the bigger picture, medium term corrective rise from 109.20 should have completed at 124.08, ahead of 126.09 support turned resistance. Medium term down trend from 149.76 is likely resuming. Break of 109.20 will target 94.11 low. In any case, break of 126.09 is needed needed to confirm medium term reversal. Otherwise, outlook will remain bearish in case of rebound.
In the long term picture, medium term decline from 149.76 is seen as part of a long term sideway pattern from 88.96. Such decline is still in progress and could target 94.11 low. At this point, we'd look for loss of downside momentum above 94.11 to signal bottoming and reversal. This bearish view will hold as long as 126.09 resistance holds.
EUR/GBP Weekly Outlook
EUR/GBP's fall from 0.8786 resumed last week by taking out 0.8483 and reaches as low as 0.8466. Near term bearish outlook is unchanged. Consolidation from 0.8303 could be completed at 0.8786. Fall from 0.8786 could be developing as the third leg of the correction from 0.9304. Deeper fall is anticipated through 0.8303 support.
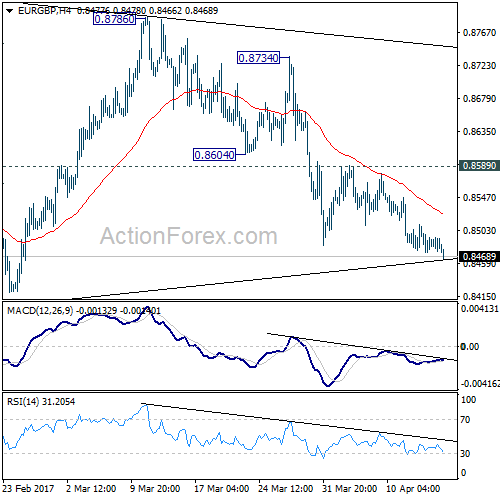
Initial bias in EUR/GBP is now on the downside this week for 0.8402 support. Firm break there should confirm our bearish view and target target 0.8303 and below. At this point, we'd expect front support from 0.8116/20 cluster support to contain downside and complete the correction from 0.9304. On the upside, break of 0.8589 resistance is needed to indicate short term bottoming. Otherwise, outlook will stay cautiously bearish in case of recovery.
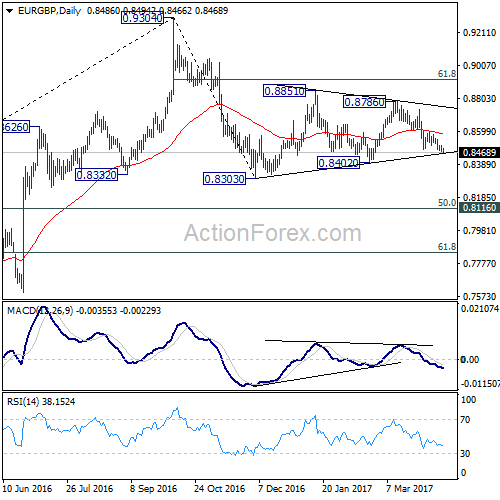
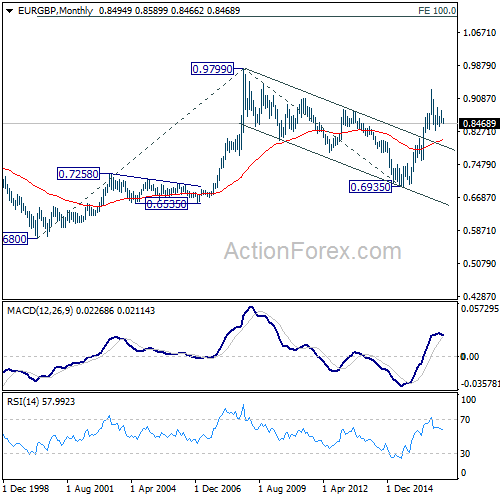
In the bigger picture, price actions from 0.9304 are viewed as a medium term corrective pattern. Such decline is likely ready to resume and should make a new low below 0.8303. At this point, we'd expect strong support from 0.8116 cluster support (50% retracement of 0.6935 to 0.9304 at 0.8120) to contain downside. Rise from 0.6935 (2015 low) will resume at a later stage to 0.9799 (2008 high). However, sustained break of 0.8116 could bring deeper decline to next key support level at 0.7564 before the correction completes.
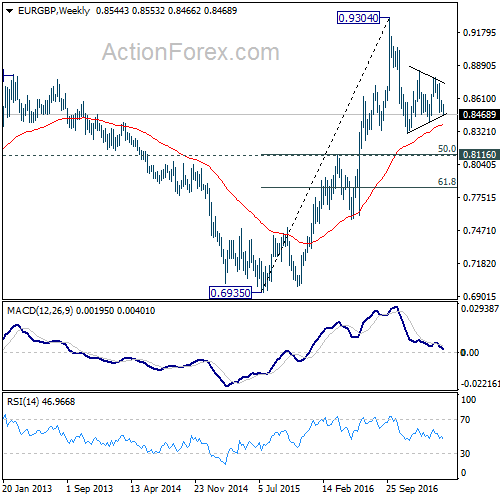
In the long term picture, firstly, price action from 0.9799 (2008 high) is seen as a long term corrective pattern and should have completed at 0.6935 (2015 low). Secondly, rise from 0.6935 is likely resuming up trend from 0.5680 (2000 low). Thirdly, this is supported by the impulsive structure of the rise from 0.6935 to 0.9304. Hence, after the correction from 0.9304 completes, we'd expect another medium term up trend to target 0.9799 high and above.
EUR/AUD Weekly Outlook
EUR/AUD stayed in range of 1.3872/4309 last week and outlook is unchanged. We continue to favor the case that larger fall from 1.6587 is completed at 1.3624, after defending 1.3671 key support. And the trend is reversing. Hence, another rise is anticipated after the consolidation from 1.4309 completes.
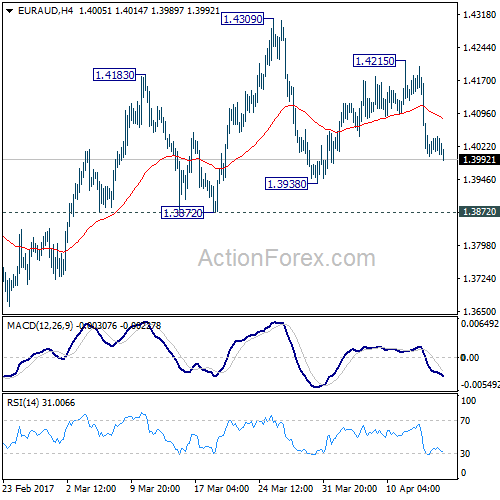
Initial bias in EUR/AUD stays neutral this week first. On the upside, break of 1.4215 minor resistance will turn bias to the upside for 1.4309. Break there will finally resume whole rise from 1.3624 and target 1.4721 key resistance next. On the downside, however, sustained break of 1.3872 will dampen our view of trend reversal. In that case, intraday bias will be turned back to the downside for retesting 1.3624 low, with prospect of extending the larger down trend.
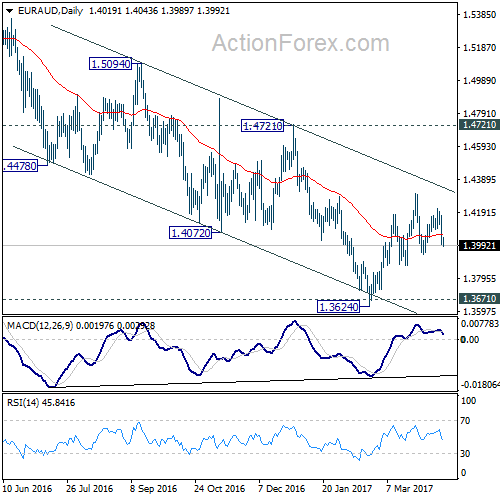
In the bigger picture, price actions from 1.6587 medium term top are viewed as a corrective pattern. Such correction could be completed after testing 1.3671 key support. Break of 1.4721 cluster resistance (38.2% retracement of 1.6587 to 1.3624 at 1.4756) should confirm this case and target 61.8% retracement at 1.5455 and above. Overall, we'd expect the up trend from 1.1602 to resume later. However, sustained break of 1.3671 will invalidate our bullish view and would turn extend the fall from 1.6587 towards 1.1602 long term bottom.
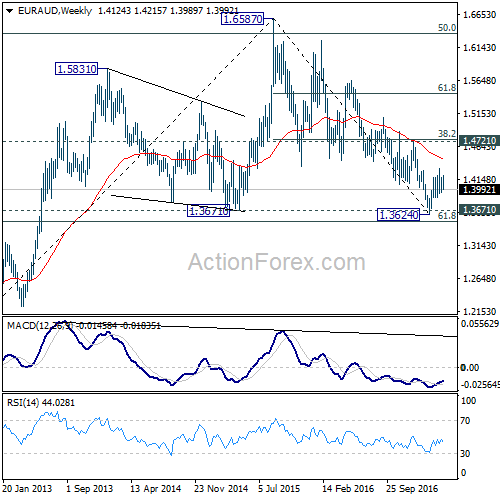
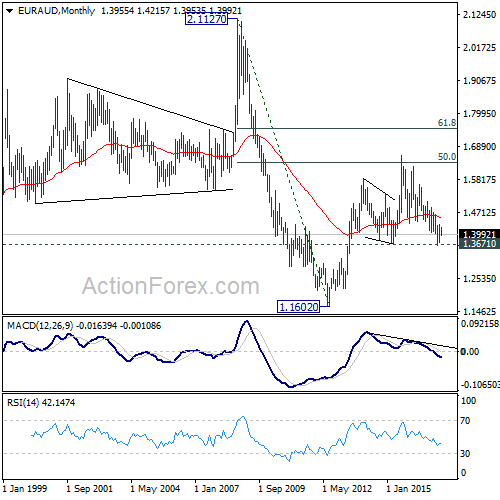
In the longer term picture, the rise from 1.1602 long term bottom isn't over yet. We'll keep monitoring the development but there is prospect of extending the rise to 61.8% retracement of 2.1127 to 1.1602 at 1.7488 and above. However, sustained trading below 1.3671 should confirm trend reversal and target 1.1602 long term bottom again.
EUR/CHF Weekly Outlook
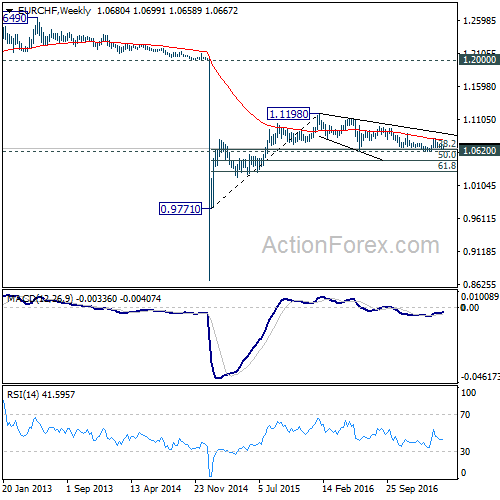
EUR/CHF's fall from 1.0823 extended last week by taking out 1.0668 support and reached as low as 1.0658. The near term bearish outlook remains unchanged. That is, rebound from 1.0629 has completed at 1.0823. And, the larger decline from 1.1198 is likely resuming.
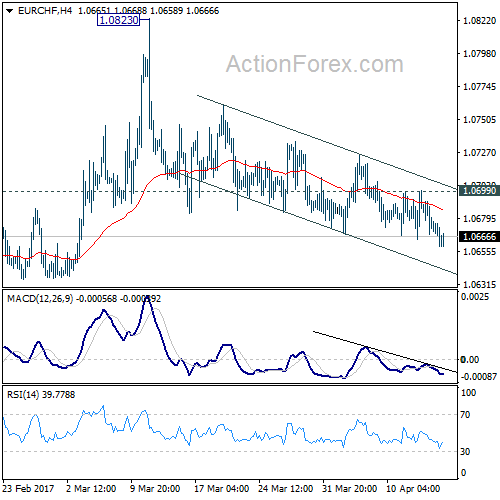
Initial bias in EUR/CHF remains on the downside this week for 1.0620/29 key support zone. Decisive break there will confirm resumption of whole fall from 1.1198. In that case, EUR/CHF should target next long term fibonacci level at 1.0485. On the upside, break of 1.0699 minor resistance will turn intraday bias neutral first. We'll assess the outlook later in that case.
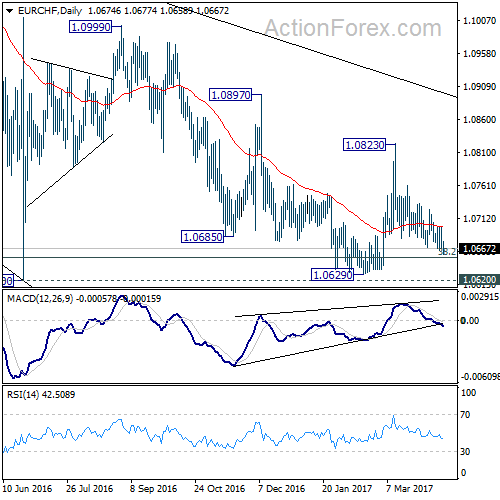
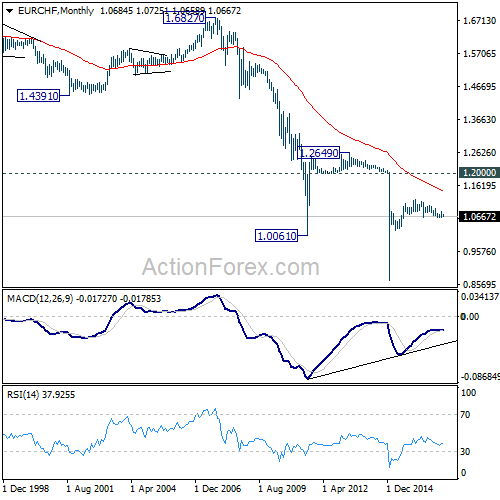
In the bigger picture, the decline from 1.1198 is seen as a corrective move. Current development suggests that it's not completed yet. Sustained trading below 38.2% retracement of 0.9771 to 1.1198 at 1.0653 will target 50% retracement at 1.0485. In any case, break of 1.0823 resistance is needed to be the first indication of reversal. Otherwise, deeper fall is still expected even in case of recovery.
Weekly Economic and Financial Commentary
U.S. Review
The Hard Data Looks a Bit Soft
- Headline retail sales fell in line with expectations in March, while February's already soft print was revised lower. Looking past the headline, however, control group sales are up 4.1 percent on a three-month annualized basis.
- Energy prices weighed on headline inflation data in March, with consumer prices declining for the first time in more than a year. The core index also slipped, with the year-over-year rate falling to 2.0 percent. Import prices and the PPI also edged lower on the month.
- Survey data released this week point to continued tightening in the labor market and suggest that the March slowdown in nonfarm payrolls is likely to be short-lived.
The Hard Data Looks a Bit Soft
Headline retail sales fell in line with expectations in March, declining 0.2 percent. February's already soft print was revised lower, however. Weakness in auto sales continued to weigh on the headline, with auto sales falling in four of the past five months. Control group retail sales, which filter directly into GDP, rose a better-than-expected 0.5 percent on the month. On a threemonth annualized basis, control group sales are up 4.1 percent (top chart). While solid, given the pickup in inflation and softer trend in auto sales, we look for real personal consumption to slow to a 1.1 percent annualized rate in the first quarter.
Survey data released this week point to continued tightening in the labor market and suggest that the March slowdown in nonfarm payrolls is likely to be short-lived. Job openings reportedly remained on course in February, rising to 5.74 million, which marks a seven-month high. Moreover, nearly one-third of small business owners indicated job openings were hard to fill in March (middle chart), according to data from the NFIB small business survey. As a result, more owners reported increasing compensation to attract and retain workers. A net 28 percent of owners stated raising workers' compensation, which marks the second-highest reading since mid-2007. These measures suggest that demand for labor remains solid and support our outlook for a continued decline in the unemployment rate and a gradual pickup in wage growth over the course of the year.
Energy Weighs on Headline Inflation Data
Import prices fell 0.2 percent in March, marking the first drop in four months as the recovery in oil prices took a pause. Expetroleum, however, prices rose 0.2 percent and are up 1.2 percent on a year-over-year basis. The upward momentum in nonfuel prices has largely been driven by strengthening in the business sector as nonfuel industrial supplies and capital goods prices are rebounding. Export prices edged higher in March and are up 3.6 percent over the past year.
The Producer Price Index (PPI) ticked down 0.1 percent in March, ending a six month string of gains. As expected, energy was a drag on the headline, down 2.9 percent. Ex-food, energy and trade services, the PPI rose 0.1 percent, marking the tenth consecutive increase.
Consumer prices fell in March for the first time in more than a year, declining 0.3 percent versus expectations that price levels would remain unchanged. A 6.2 percent decline in gasoline prices was the largest contributor to the headline's drop. Excluding energy, prices also slipped 0.1 percent despite a rebound in food prices. The core index also fell a modest 0.1 percent, the first decline in more than six years. Weakness was reported in both core goods and services. The core index slipped to 2.0 percent year-over-year; however, we do not see this weakness as start of a new trend. Despite this week's mixed readings on price pressures, we believe the Fed will continue to focus on their preferred inflation measure, the core PCE, which continues to drift higher.
U.S. Outlook
Housing Starts • Tuesday
Mild weather in January and February allowed the homebuilding season an earlier start in 2017. Housing starts were up 3.0 percent in February to a 1.29 million unit pace, with all of the increase in single-family starts. Momentum is increasingly shifting toward single-family homes in suburban markets as multifamily continues to cool in urban markets. Steady job and income growth, combined with tight inventory of homes available for sale in many markets, should continue to support homebuilding going forward.
The early start to the spring homebuilding season may bring some volatility to the seasonally adjusted data in coming months. Spring months are unlikely to see the large gains they normally do because they did not fall off as much as they normally do this winter. We expect housing starts to come in at a 1.21 million unit annual pace in March.
Previous: 1.29M Wells Fargo: 1.21M Consensus: 1.25M
Industrial Production • Tuesday
February's flat reading of industrial production was largely the result of warmer weather weighing utilities output for the second straight month. Manufacturing and mining output continued to climb. Factory output rose 0.5 percent in February, continuing its six-month winning streak as manufacturing activity ramps up after two years under the weight of slow global growth, decreased energy exploration and high inventories. Factory data continue to steadily improve as these headwinds fade into the rearview mirror.
Looking to March, we expect continued improvement in manufacturing output. The ISM slipped slightly in March but still pointed to a ramp up in production while factories added more workers in March. Utilities output should reverse course in March, as colder temperatures returned to most of the country. Taken together, we expect the headline to be up 0.9 percent on the month.
Previous: 0.0% Wells Fargo: 0.9% Consensus: 0.5%
Existing Home Sales • Friday
Home sales declined 3.7 percent in February following a 3.3 percent jump in January. February's slowdown was to be expected, given the January decline in pending home sales, which are measured when the contract is signed and tends to lead existing home sales, which are counted at closing. February's pullback in existing home sales did alleviate some pressure on exceptionally tight inventories of homes available for sale, though at a 3.8-month supply, the market remains competitive for homebuyers.
Pending home sales picked back up in February, which bodes well for a faster pace of existing home sales in March. We expect a healthy spring selling season, as stronger job and income growth encourages home purchases. However, the supply of homes available for sale remains exceptionally low, making this a sellers' market.
Previous: 5.48M Wells Fargo: 5.64M Consensus: 5.55M
Global Review
Global Growth Continues to Solidify
- Information on the global economy continues to show growth solidifying. This week's strong import and export numbers from China, up 20.3 percent and 16.4 percent, respectively, year over year, are a clear indication that trade has started to improve. Concerns on further economic weakness in Chinese and global economic growth are giving way to slowly improving and stabilizing economic conditions.
- We are now forecasting a 1.2 percent growth rate for the economy this year rather than the mild recession. Still, we believe that the Mexican economy will be negatively affected by the new policies from the Trump administration but that the effects will be spread over several years.
Global Growth Continues to Solidify
Information on the global economy continues to show growth solidifying. This week's strong import and export numbers from China, up 20.3 percent and 16.4 percent, respectively, year over year, are a clear indication that trade has started to improve and concerns on further economic weakness in Chinese and global economic growth are giving way to slowly improving and stabilizing economic conditions. Last week's third consecutive increase in monthly foreign reserves was a further sign that expectations on the future of the economy have improved somewhat after several years of dwindling reserves.
Meanwhile, in this Hemisphere, we have become a bit more optimistic on the future of the Mexican economy. There has been an important shift in the conversation from the new U.S. administration regarding all-things-Mexico lately. Thus, we are now forecasting a 1.2 percent growth rate for the economy this year rather than the mild recession. Still, we believe that the Mexican economy will be negatively affected by the new policies from the Trump administration but that the effects will be spread over several years. Furthermore, industrial production numbers for February were mixed, with the construction sector leading growth in the month but public utilities and mining output weakening further. Meanwhile, the manufacturing industry remained relatively stable but almost unchanged from the previous month. However, we saw a strong increase in automobile production and automobile exports in March so manufacturing output is probably going to improve in the short run. Also in North America, the Bank of Canada, as expected, decided to keep its benchmark overnight interest rate unchanged at 0.50 percent as the economy has continued to improve and inflation remains contained.
In South America, the Brazilian central bank cut interest rates by 100 bps as inflation continues to decline amid still very weak economic activity. Meanwhile, our expectation for this year's economic performance remained unchanged even as the central bank has become more dovish in terms of inflation and inflationary expectations. We still expect the economy to grow 0.7 percent in 2017. However, we are still concerned with the ongoing investigation into the Car Wash fraud scandal, which has continued to expand and now has even touched Fernando Henrique Cardozo, ex-president of Brazil during the Plan Real in the mid-1990s. But, accusations have also spilled across the border as Peruvian and Mexican officials have also been accused of taking bribe money from Brazilian construction conglomerate Odebrecht.
In Europe, even as the economy continues to improve, markets have started to concentrate on France's approaching elections (April 23), with analysts envisioning a second-round vote (if needed, on May 7) as no candidate is expected to win them during the first round. However, the presidential elections are probably the least of the problems as potential alliances between diverging political parties and movements make compromise even more difficult and policies more difficult to implement.
Global Outlook
China GDP Growth • Monday
The Chinese economy has been decelerating for the past few years. That said, real GDP growth in China has stabilized just below 7 percent in the past few quarters, and most analysts suspect a similar rate of growth was registered in the first quarter. The Chinese government has been able to engineer a "soft landing" via expansionary economic policies.
Chinese authorities do not release timely data on the demand-side components of real GDP, but monthly indicators provide some useful insights into the economy. Data released this week showed that export growth has picked up recently, which is helping to support real GDP growth in China. Next week's data releases on retail spending and industrial production in March will give analysts further insights into the current state of the economy. Looking forward, we expect that GDP growth will slowly downshift as investment spending decelerates further.
Previous: 6.8% (Year-over-Year) Wells Fargo: 6.7% Consensus: 6.8%
Brazil Economic Activity Index • Monday
Real GDP in Brazil has contracted 9 percent since peaking in Q1-2014. The monthly economic activity index, which will print next week, will offer some insights into the state of the Brazilian economy in the first quarter. Although the year-over-year rate of descent of the index is flattening out, there are few signs yet to suggest that economic growth in Latin America's largest economy is turning positive again.
Inflation data for April will also print next week. CPI inflation, which shot up as high as 11 percent in early 2016, has been dropping like a stone in recent months due to economic weakness and exchange rate appreciation. The nosedive in inflation has allowed the central bank to reduce its main policy rate by 300 bps since October (it cut the rate by 100 bps this week). Further disinflation would give the central bank scope to ease policy further in coming months.
Previous: -0.8% (Year-over-Year) Consensus: -2.4%
U.K. Retail Sales • Friday
Following the Brexit referendum last June, there was concern that the uncertainty associated with the negotiation process could cause the British economy to slip into a mild recession. However, economic growth in the United Kingdom has remained positive due, at least in part, to resiliency in consumer spending.
That said, growth in retail spending has slowed recently. If the volume of retail sales edges down 0.2 percent in March relative to February, as the consensus forecast anticipates, then real retail spending will have contracted more than 1 percent on a sequential basis in the first quarter. Although real spending on services likely remained positive in Q1, the modest downturn in real retail sales suggests that overall consumer spending has decelerated. Rising inflation, which reflects the effects of sterling depreciation in the wake of the Brexit referendum, has eroded growth in real disposable income.
Previous: 1.4% (Month-over-Month) Consensus: -0.2%
Point of View
Interest Rate Watch
Perfect Policy Storm?
Three policy initiatives are on a path to challenge investors and policy makers going forward. Each of these initiatives is on a path that has not been explored before and thereby adds to the risk of the implications of the confluence of economic storms.
FOMC: Uncertain Search for Neutral
For the FOMC, the direction of policy intentions, as illustrated by the top graph, is for a rise in the funds rate for the next two years. Yet, while the intended direction for rates is clear, the magnitude of the move remains uncertain, given both the pace of inflation and the debates surrounding the neutral interest rate target. Debate on the real neutral rate (zero, one or two percent) also faces the feedback effects between interest rates, growth and inflation. These feedback effects are highly uncertain, given that policymakers have not gone down this policy path before.
Rising Treasury Debt Issuance
For U.S Treasury and fixed income investors, the expected path of debt finance and the amount of debt held by the public projected by the CBO (middle graph) signal that Treasury finance is moving into unexplored territory.
Again, there is an interaction of a rising path for Treasury finance in an environment of tighter monetary policy (above) as well as changes in sentiment of foreign investors to Treasury debt. There is no linear path here for rates but rather the interaction of forces beyond the bounds of our experience in the amount of debt and the willingness of investors to buy debt in a rising inflation environment.
More Treasury Issuance in the Face of a Less Willing Buyer
Recent commentary by FOMC speakers has highlighted that the FOMC is considering starting the process of shrinking its balance sheet. Again, we are entering unexplored territory. As illustrated in the bottom graph, the maturity schedule of Treasury debt is very front loaded. A triumvirate of influences will take market rates and volatility into a world we have seen before.
Credit Market Insights
Consumers Remain Optimistic
Earlier this week, the New York Fed released its monthly Survey of Consumer Expectations, which provides an outlook of consumers' near- and medium-term expectations for inflation, the labor market and household finances. In March, the decline in inflation expectations over the short- and medium-term was broad-based across different demographics, while household finances and the labor market expectations improved.
Consumers' outlook on the labor market strengthened over the month. The jobfinding- expectations component increased to its highest level since the series' start in mid-2013. Even the disappointing March employment print was not enough to dampen job seekers' outlook on future employment, which is at nearly 60 percent. Moreover, those surveyed believe that wages are going to pick up in the near term.
In addition, more households believe they are moving in the right direction and will be better off next year. Consumers expect their household income to grow and are more confident in their ability to maintain their debt and are satisfied with the level of credit afforded to them. Also, expectations for higher interest rates on saving accounts as well as higher U.S. stock prices rose to series highs.
That said, we think the momentum of the economy and the strength of the consumer will be able to withstand two additional Fed rate hikes that we have forecasted for this year.
Topic of the Week
Balancing Act: Normalizing the Balance Sheet
As the Fed considers what to do with its $4.5 trillion balance sheet and the implications these decisions might have on financial markets, we are reminded of Donald Rumsfeld's observation that "it is easier to get into something than to get out of it."
Prior to the 2008 financial crisis, the Fed's asset holdings were about $900 billion, consisting primarily of Treasuries (top chart). Today, the balance sheet is roughly $4.5 trillion, comprised mostly of Treasuries and mortgage-backed securities (MBS).
Fed guidance on the timing and structure of balance sheet reductions has been fairly tight-lipped until recently. However, based off of the Fed's "Policy Normalization Principles and Plans," the Fed appears set to 1) allow maturing assets to roll off rather than outright sell securities and 2) gradually return its holdings to primarily Treasuries over the long run.
The front-loaded nature of the Fed's Treasury holdings is conducive to a policy that ends reinvestments. As illustrated in the bottom chart, more Treasury securities come due in 2018 than any other year. For MBS, however, there is a less clear path ahead: Prepayment on MBS, due to refinancing, downsizing/upsizing, mobility and other factors, all influence the pace at which these securities will mature.
In our view, the Fed most likely will propose starting the process by allowing maturing securities to roll off by year's end, through a combination of MBS and Treasury reductions. In order to prevent a taper tantrum repeat, the Fed will likely try to signal this well in advance and choose to reinvest a sizable percentage of the maturing assets, smoothing the transition. If all proceeds according to plan and the economy continue to improve, the Fed would then gradually reduce the share of its reinvestments to normalize further.