Sample Category Title
Technical Outlook: Spot Gold At Fresh 2017 Highs On Strong Safe Haven Buying
Spot Gold remains tall on Wednesday and consolidating above $1270 handle, following strong rally on Tuesday (the biggest one-day gains since 15 Mar), inspired by safe haven buying on rising geopolitical tensions.
Fresh extension higher in early Wednesday posted new 2017 high at $1279, which also marks the highest traded since 10 Nov 2016.
Tuesday’s rally also generated strong bullish signal on eventual close above $1255 (Fibo 61.8% of $1337/$1122 descend).
Bulls are now focusing targets at $1286 (Fibo 76.4% retracement) and $1292 (weekly cloud top), as global political uncertainty maintains strong bullish sentiment for gold.
Rally may be interrupted by mild corrections, with last Friday’s spike high at $1270 marking immediate support, followed by former top of 27 Feb at $1263 and rising daily
Tenkan-sen / broken 200SMA at $1259/57, expected to contain extended downticks.
Res: 1279, 1286, 1292, 1295
Sup: 1270, 1263, 1259, 1257
Technical Outlook: AUDUSD – Extended Consolidation Remains Capped By 100SMA And Maintain Bearish Bias
The pair is holding within narrow consolidation for the third day, after denting key short-term support at 0.7489 (09 Mar low), but was so far unable to close below and signal bearish continuation.
Tuesday's long-legged Doji signaled strong indecision, but so far lacking reversal signals, as 100SMA (0.7513) continues to cap.
Slow stochastic is attempting to reverse from oversold r=territory on the daily chart, which would generate initial bullish signal, however, confirmation of reversal would require lift above next pivot, 200SMA at 0.7550, which is reinforced by falling 10SMA that is approaching in attempt to form bear-cross and intensify downside pressure.
Daily studies are in firm bearish mode and suggest further extension of the wave C (on which the pair is currently riding) through its FE 138.2% (current low at 0.7472) towards the base of thick daily cloud at 0.7449 and FE 161.8% at 0.7436.
Extended consolidation ahead of fresh push lower is seen as likely near-term scenario.
Res: 0.7513, 0.7550, 0.7585, 0.7596
Sup: 0.7472, 0.7449, 0.7436, 0.7400
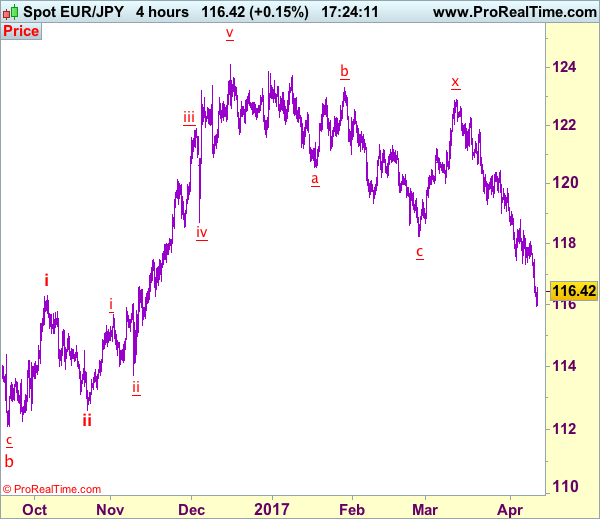
Trade Idea: EUR/JPY – Sell at 118.00
EUR/JPY - 116.41
Recent wave: wave v of (C) ended at 94.12 and major correction in wave A has ended at 149.79
Trend: Near term down
Original strategy:
Sell at 119.00, Target: 117.00, Stop: 119.60
Position: -
Target: -
Stop: -
New strategy :
Sell at 118.00, Target: 116.00, Stop: 118.60
Position: -
Target: -
Stop:-
Yesterday’s selloff adds credence to our bearish view that recent entire fall from 124.10 top is still in progress and downside bias remains for further weakness to 115.50-60, then towards 115.00, however, near term oversold condition should prevent sharp fall below latter level and reckon 114.40-50 would hold from here, risk from there is seen for a much-needed rebound to take place later.
In view of this, would not chase this fall here and would be prudent to sell euro on subsequent rebound as 117.90-00 should limit upside. Above 118.40-45 would defer and suggest low is possibly formed, risk test of resistance at 118.80 but break there is needed to add credence to this view, bring retracement of recent decline to 119.06 resistance first.
Our latest preferred count is that wave (ii) is ABC-X-ABC which ended at 123.33 and wave (iii) is unfolding with wave iii ended at 100.77, followed by wave iv at 111.57 and wave v as well as the wave (iii) has ended at 97.04, followed by wave (iv) at 111.43 and wave (v) has ended at 94.12 which is also the end of the larger degree v, this also implied the major wave (C) has also ended there, hence major correction has commenced from there with (A) leg unfolding in its lower degree wave c which has possibly ended at 145.69. Under this count, A-B-C wave (B) has commenced with A leg ended at 136.23, wave B at 143.79 and wave C has possibly ended at 149.79.
Our larger degree count is that the decline from 139.26 is wave (C) and is sub-divided into a diagonal triangle i-ii-iii-iv-v with wave i - 105.44, wave ii- 123.33, wave iii - 97.03, wave iv - 111.43, followed by the final wave v as well as the end of wave (C) at 94.12, this also mark the bottom of larger degree wave B. Under this count, major rise in wave C has commenced as an impulsive wave with minor wave III ended at 145.69, wave V is still in progress for further gain to 150.00. Having said that, this so-called wave V could well be the first leg of larger degree 5-waver wave C and this wave C should bring at least a retest of wave A top at 169.97 (July 2008).
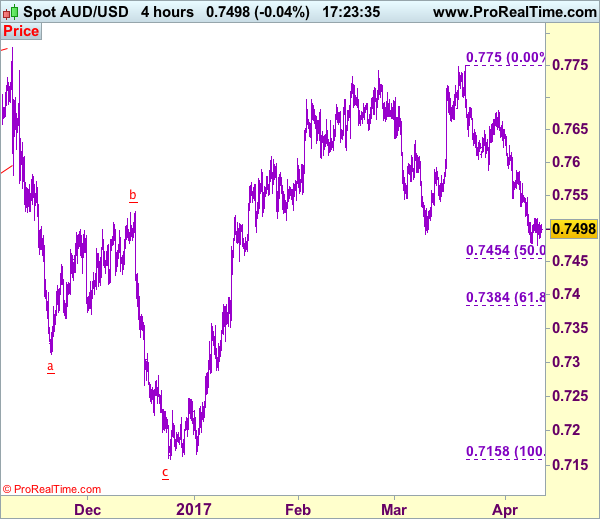
Trade Idea: AUD/USD – Hold long entered at 0.7525
AUD/USD – 0.7496
Recent wave: Wave 5 ended at 1.1081 and major correction has commenced for fall to 0.7000 and then towards 0.6500-10
Trend: Near term down
Original strategy :
Bought at 0.7525, Target: 0.7680, Stop: 0.7465
Position: - Long at 0.7525
Target: - 0.7680
Stop: - 0.7465
New strategy :
Hold long entered at 0.7525, Target: 0.7680, Stop: 0.7465
Position: - Long at 0.7525
Target: - 0.7680
Stop:- 0.7465
As aussie has remained under pressure after breaking previous support at 0.7491, marginal weakness from here cannot be ruled out, however, loss of near term downward momentum should prevent sharp fall and bring rebound later, above 0.7550 would bring test of indicated resistance at 0.7588, break there would suggest a temporary low is possibly formed, bring rebound to 0.7625-30 and later towards resistance at 0.7680-85.
In view of this, we are holding on to our long position entered at 0.7525. Below indicated support at 0.7465-70 would signal the fall from 0.7750 is still in progress for further weakness to 0.7450-55 (50% Fibonacci retracement of 0.7158-0.7750), however, oversold condition should limit downside to 0.7380-85 (61.8% Fibonacci retracement), risk from there is seen for a rebound later.
On the 4-hour chart, the move from 0.8066 is the wave 5 with i: 0.8860, ii: 0.8315, wave iii is an extended move ended at 1.0183, iv: 0.9706 and wave v has ended at 1.1081 (also the top of entire wave 5). The subsequent selloff is the major correction which is unfolding as ABC-X-ABC and 2nd A leg has ended at 0.8848, followed by a-b-c wave B which ended at 0.9758, hence, 2nd C wave is now in progress and indicated downside target at 0.7000 and 0.6950 had been met, so further fall to 0.6710-20 cannot be ruled out.
GBP/USD Bullish Cup With Handle Formation
.
The GBP/USD has formed a cup with handle pattern on H1 timeframe, suggesting further upside. W H4 camarilla is acting as support as the price broke above it, and it forms a clear handle at the brim of a cup. 1.2480 might spike the price to the upside, targeting D H3 H4 and H5 levels respectively, -1.2516, 1.2538, and 1.2580. If the price breaks below the handle, look for possible POC (D L3, double bottom, ATR pivot) 1.2425-45 rejection.
UK Retail Sales Fall On Rising Inflation And Slow Wage Growth
UK labour market data for March will be released at 09:30 BST including claimant count, ILO unemployment rate (from Dec to Feb) and average earnings (from Dec to Feb). The data will likely affect the strength of GBP and GBP crosses. GBP/USD hit a 1-week high of 1.2500 this morning, helped by the weakening of the dollar.
Bank of England Gorvernor Carney will make a speech at 09:30 BST this morning. We will likely get clues about the prospective measures that the BoE will likely take to cope with rising inflation, slowing wage growth and Brexit uncertainty.
The ILO unemployment rate has seen a downtrend since early 2012. UK average earnings, including and excluding bonus (from Dec to Feb), has seen a moderate uptrend in 2016. However, the increase of average earnings, excluding bonus, (from Dec to Feb) has slowed down since the beginning of this year.
UK inflation for February moved above the Bank of England’s 2% target for the first time since 2014. UK CPI (Mar), released yesterday, was 2.3% in line with expectations and the previous figure. Core CPI (Mar) fell to 1.8% in March from 2% in February. Although the latest inflation figures showed a slight slowdown the inflation uptrend is likely to continue. If the pace of wage growth is slower than the pace of inflations rise, resulting in consumers cutting down on their spending on clothing, non-food and non-necessities. It will lead to a slowdown of economic growth.
The British Retail Consortium (BRC) announced on Tuesday that UK retail sales fell by 1% in March (YoY). UK total sales edged up by only 0.1% in the January to March period marking the slowest pace of growth post the financial crisis. Non-food sales fell by 0.8% in the January to March period marking the biggest decline in nearly six years.
The dollar index plunged around 0.31% on Tuesday, falling from the psychological resistance level at 101.00 and hitting a 2-day low of 100.49. This morning the dollar index keeps on weakening thereby pushing gold prices up, spot gold hit a 5-month high of 1279.67. FOMC voting member, Neel Kashkari, was the only member to dissent the Fed’s rate hike decision in March. He stated his view on Tuesday that “there is still slack in the labour market and inflation needs to be higher”.
The Bank of Canada will announce its rate decision this afternoon at 15:00 BST. It will be followed by the BoC’s Gorvernor Poloz’s speech at 21:15 BST. Although Canadian economy is improving, however, the US economic outlook is still uncertain under Trump’s administration. The BoC is likely to keep rates on hold for the near future.
Thursday sees the release of Australian employment change and unemployment rate for March at 02:30 BST. German CPI for March will be released at 07:00 BST; it will likely affect the strength of the Euro and the trend of the DAX index.
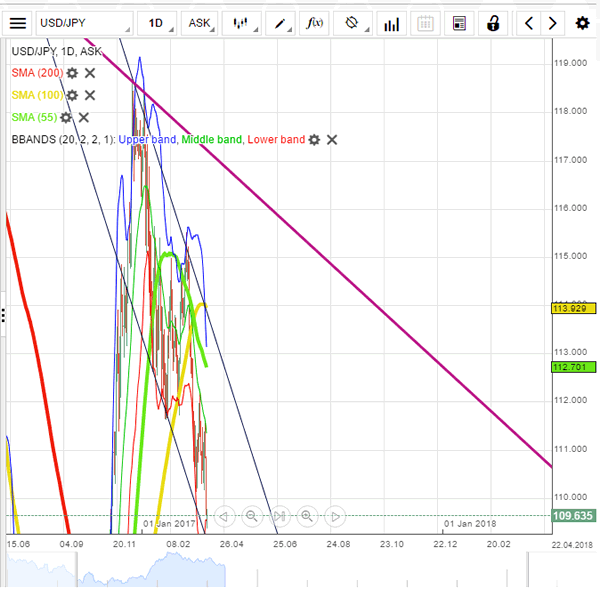
Technical Outlook: USDJPY – Yen Hits Five-Month High Vs Dollar On Safe Haven Buying
The pair remains firmly in red following Tuesday's sharp fall (the biggest one-day fall since 15 Mar) and consolidating above fresh five-month low at 109.33, hit on early Wednesday's extension lower.
Long red candle that was formed on Tuesday is expected to heavily weigh on the market, as strong risk-off sentiment on rising geopolitical tensions, keeps yen well supported.
Eventual break below strong 110.00 support has boosted bears to continue larger bear-leg from 115.49, which is also the third wave of five-wave cycle from 118.65, towards its FE100% at 108.23.
Broken 110.00 support zone now acts as initial resistance, ahead of falling daily Tenkan-sen at 110.75.
Res: 109.73, 110.00, 110.75, 110.90
Sup: 109.33, 109.00, 108.50, 108.23
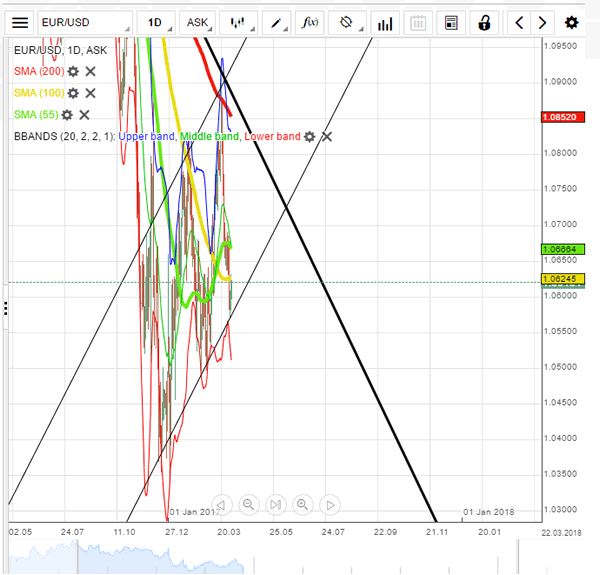
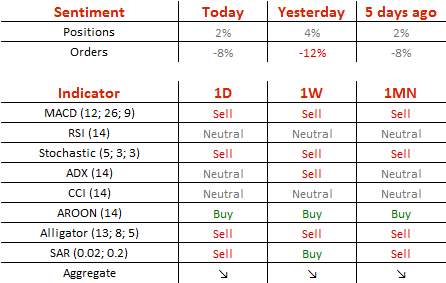
EUR/USD: Trades Near 1.06 Mark
'Melenchon's steady rise has turned France's already topsy-turvy election campaign into one of the most unpredictable contests in recent history.' – Gregory Viscusi, Bloomberg
Pair's Outlook
Due to US Dollar weakness caused by fundamental political events, the EUR/USD currency exchange rate has returned to fluctuate near the 1.06 mark on Wednesday morning. Previously, as the pair was set to decline to the support cluster near the 1.0550 mark, the rate suddenly regained ground and tested the resistance put up by the weekly PP and the 100-day SMA near the 1.0620 level. The pair remained between the mentioned levels of resistance on Wednesday morning, as markets continued to watch fundamental events occurring in the world. Meanwhile, from a technical perspective the decline to the 1.0550 level is still to be expected.
Traders' Sentiment
SWFX market sentiment remains almost neutral, as 51% of open positions are long. Meanwhile, 54% of set up orders are to sell.
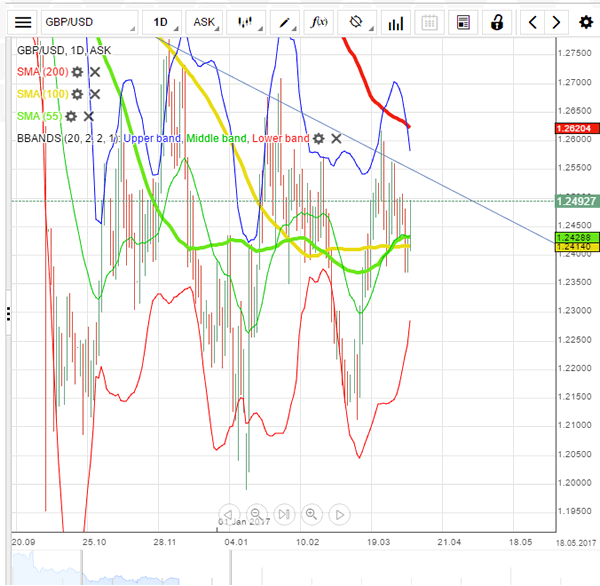
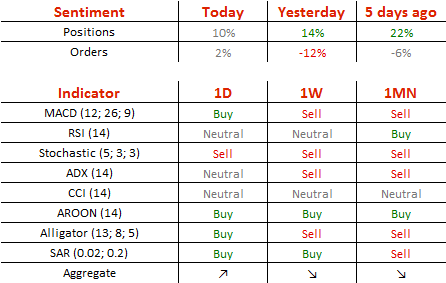
GBP/USD: Reluctant To Leave Bearish Trend
'In view rising geopolitical risk and Brexit uncertainties, we expect limited upside potential in GBPUSD this week.' – BMO Capital Markets (based on PoundSterlingLive)
Pair's Outlook
A set of upbeat inflation data on Tuesday provided the Sterling with a sufficient boost to once again stabilise above the cluster of important levels circa 1.2330. However, the rally was not strong enough for the Cable to climb over the 1.25 mark, suggesting that another U-turn today is possible, despite technical indicators giving different signals. A surge of more than 50 pips would cause the six-month down-trend to be breached, with focus then shifting to the second strong resistance, namely the cluster around 1.2630. However, should the GBP/USD pair continue to consolidate, the 1.24 major level would become open for exposure once again.
Traders' Sentiment
There are 55% of traders being long the Pound today (previously 57%), whereas 51% of all pending orders are to acquire the British currency.
USD/JPY: To Approach 109.00
'As recent data suggest, the United States is not in bad shape fundamentally and this should be dollar-supportive. But right now the tide favours the yen and participants do not want to miss the next wave of yen buying.' – BBH (based on Reuters)
Pair's Outlook
The US Dollar suffered a great deal on Tuesday, amid rising tensions over both Syria and North Korea. As a result, the Buck lost more than 130 pips against the Japanese Yen, crossing the 110.50 psychological support, now being one step away from retesting the descending channel's lower border at 109.09. The support line is unlikely to be pierced, as it is bolstered by a number of other levels of significance. From a broad technical perspective the USD/JPY pair should post a recovery today, despite technical indicators suggesting otherwise. We, however, still expect the channel's support line to be put to the test before a rebound occurs.
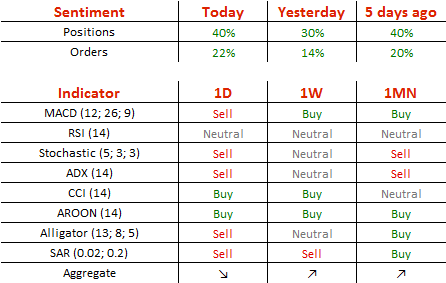
Traders' Sentiment
Once again 70% of all open positions are long (previously 65%). Meanwhile, the share of buy orders inched up from 57 to 61%.