Sample Category Title
Japan’s Machinery Orders Rebounded In February
For the 24 hours to 23:00 GMT, the USD declined 0.96% against the JPY and closed at 109.67.
On the data front, Japan's flash machine tool orders rose 22.6% on an annual basis in March. In the previous month, machine tool orders had advanced 9.1%.
In the Asian session, at GMT0300, the pair is trading at 109.47, with the USD trading 0.18% lower against the JPY from yesterday's close.
Overnight data indicated that the nation's machinery orders rebounded 1.5% MoM in February, less than market expectations for a rise of 3.6% and following a drop of 3.2% in the preceding month.
The pair is expected to find support at 108.94, and a fall through could take it to the next support level of 108.41. The pair is expected to find its first resistance at 110.39, and a rise through could take it to the next resistance level of 111.31.
The currency pair is trading below its 20 Hr and 50 Hr moving averages.

Swiss Franc Trading Marginally Lower In The Morning Session
For the 24 hours to 23:00 GMT, the USD declined 0.07% against the CHF and closed at 1.0074.
In the Asian session, at GMT0300, the pair is trading at 1.0077, with the USD trading a tad higher against the CHF from yesterday’s close.
The pair is expected to find support at 1.0057, and a fall through could take it to the next support level of 1.0037. The pair is expected to find its first resistance at 1.0095, and a rise through could take it to the next resistance level of 1.0113.
The currency pair is showing convergence with its 20 Hr moving average and trading below its 50 Hr moving average.

Loonie Trading A Tad Lower, Ahead Of BoC’s Interest Rate Decision
For the 24 hours to 23:00 GMT, the USD slightly rose against the CAD and closed at 1.3328.
In the Asian session, at GMT0300, the pair is trading at 1.3333, with the USD trading marginally higher against the CAD from yesterday's close.
The pair is expected to find support at 1.3308, and a fall through could take it to the next support level of 1.3282. The pair is expected to find its first resistance at 1.3358, and a rise through could take it to the next resistance level of 1.3382.
Ahead in the day, traders would focus on the Bank of Canada's (BoC) interest rate decision. Markets widely expect the central bank to hold rates steady at 0.50%.
The currency pair is showing convergence with its 20 Hr moving average and trading below its 50 Hr moving average.

Foreign Exchange Market Commentary: EUR/USD, USD/JPY, GBP/USD,AUDUSD, GBPCAD, GOLD, WTI CRUDE, DJIA, FTSE 100, DAX
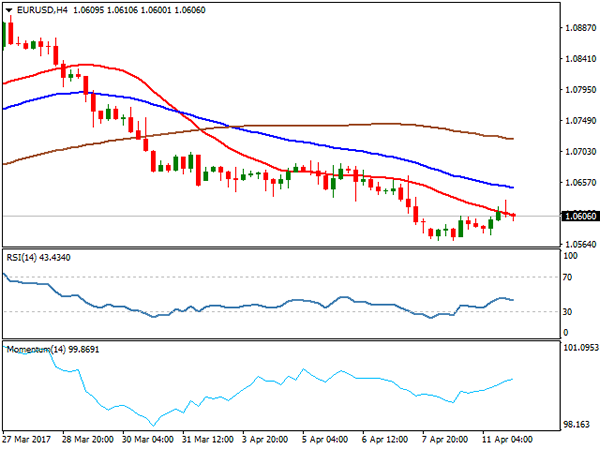
EUR/USD
The EURUSD pair held within narrow range in Asia and early Europe, with fresh lows at 1.0570, forming hourly double-bottom that underpinned near-term price action. Base of thin daily Ichimoku cloud, spanned between 1.0584 and 1.0614, kept the downside protected, despite several probes below.
Little change was seen on late Monday's comments from Fed Chair Janet Yellen, as she said nothing new and gave no firmer signals about the timing of next rate hike that traders were awaiting.
The pair received support from European data and spiked at 1.0620 in mid-European session. German ZEW data showed investor morale rose to its highest level since Aug 2015, surging to 19.5 in April from 12.8 in March and well above consensus at 14.0. Economic sentiment in the largest European economy brightened after strong first quarter, on concerns about protectionism from Trump's administration.
Eurozone industrial output fell by 0.3% in February on m/m but rose by 1.2% y/y. However both releases were below forecasts for increase by 0.1% m/m and by 2.0% y/y. Decline in Industrial Output was mainly due to a sharp drop in energy production.
Despite weaker than expected Eurozone data the single currency held bullish near-term sentiment and remained above 1.0600 handle.
Beginning of the US session brought more activities in the markets. The US dollar fell across the board on increasing geopolitical risk and declining US Treasury yields that prompted traders to heavily exit dollar positions.
The EURUSD spiked to 1.0630, the highest of the US session but was unable to hold gains and returned back to 1.0600 zone.
The action signalled that the Euro is lacking momentum for stronger upside action and firm break above strong barriers, formed by daily Ichimoku cloud top at 1.0614 and 100SMA at 1.0622. Despite initial signals of recovery, the pair is still holding in the dangerous zone below 1.0614/22 barriers that keeps the downside at risk.
Sustained break above the latter barriers is needed to generate stronger bullish signal. Otherwise, likely near-term scenario would be extended directionless trading within the cloud, with prevailing bearish bias on negative daily technical studies.
Support: 1.0584, 1.0570, 1.0525, 1.0494
Resistance: 1.0614, 1.0630, 1.0669, 1.0690
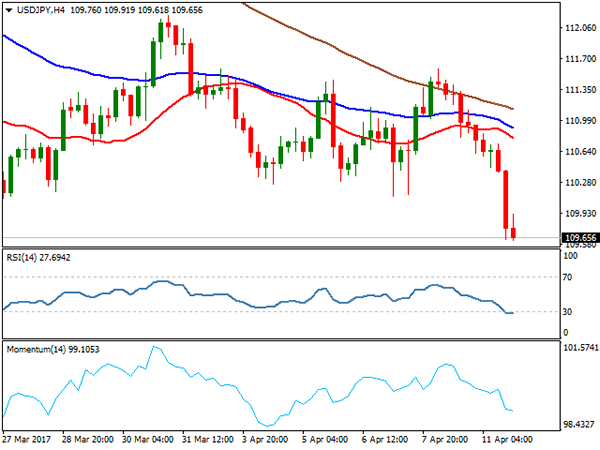
USD/JPY
Japanese yen was among the top gainers on Tuesday and rose above 110.00 barrier against the US dollar. Yen received strong boost by rising geopolitical tensions over North Korea and Syria, as investors rushed into safe haven assets on fears that current tensions might escalate on rising possibilities of US military action in these two countries. Tensions over Syria brought relations between America and Russia to the lowest levels since the cold war era, with serious threats that current verbal conflict may escalate.
Strong safe haven yen-buying pushed the USDJPY eventually below key 110.00 support, after the pair traded for more than two weeks above 110.00, where near-term base was formed. Break below 110.00 could accelerate on triggering stops below and could extend the wave C (on which the pair is currently riding) of five-wave cycle from 118.60, towards its Fibonacci 100% expansion at 108.48.
Lomg bearish daily candle that was formed on Tuesday is expected to weigh on near-term action.
Broken 110.00 support is now acting as initial resistance which guards falling daily Tenkan-sen (currently at 110.90), where also Tuesday's high lies.
Daily studies in firm bearish setup are supportive for further weakness.
Support: 109.60, 109.00, 108.48, 107.80
Resistance: 110.00, 110.30, 110.53, 110.90
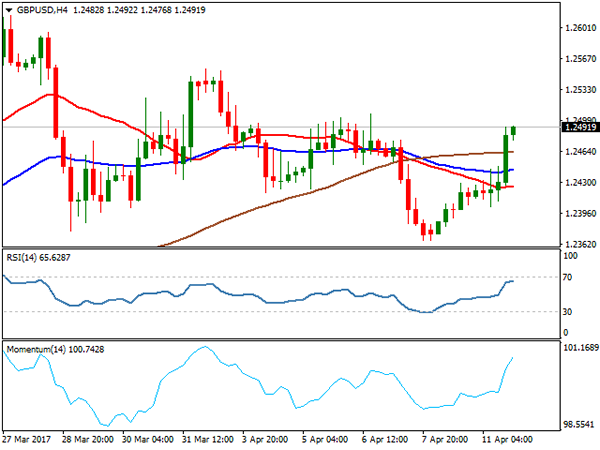
GBP/USD
Cable ended the second day positively and nearly fully retraced last Thu/Fri 1.2505/1.2365 descend. After Monday's trading was limited within narrowing daily Ichimoku cloud, sterling received support from solid UK inflation numbers that stayed steady in March, coming unchanged at 2.3%. Release at/above forecasted level was broadly seen as supportive, as pound initially spiked to 1.2445, after data, but spent some time in consolidation until markets digested the data. Fresh action higher then accelerated on strong dollar's weakness, breaking above next pivot at 1.2460 (daily Tenkan-sen) and extending near round-figure 1.2500 barrier.
Overall bullish structure of daily studies was confirmed by surge above daily cloud / Tenkan-sen, also emerging above cluster of daily Moving Averages (100 / 55 / 20SMA) which also formed multiple bull-crosses, underpinning for further upside.
Firm break above last Thursday's high at 1.2505 will generate another bullish signal.
The pair will be also focusing release of UK jobs data and speech of BOE's Governor Carney, for further signals.
UK jobless claims are expected to fall in March, according to -3.0K forecast vs Feb's fall to -11.3K. Unemployment rate is expected to stay unchanged at 4.7% in Feb, as well as Average Earnings at 2.2% in Feb.
Support: 1.2460, 1.2426, 1.2403, 1.2365
Resistance: 1.2491, 1.2505, 1.2555, 1.2596
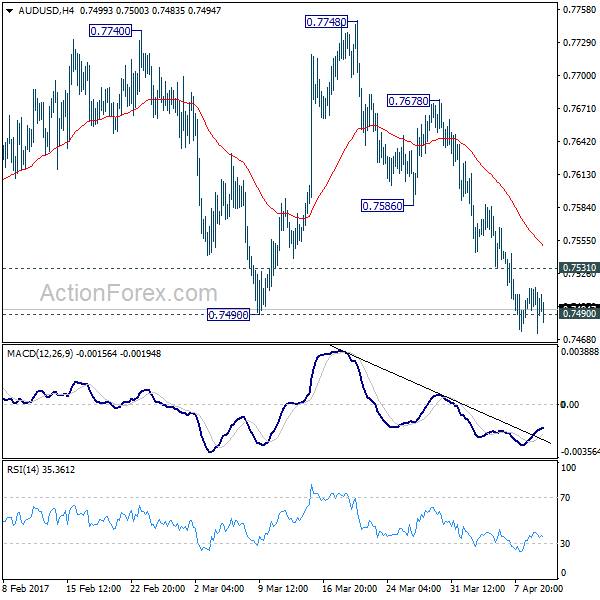
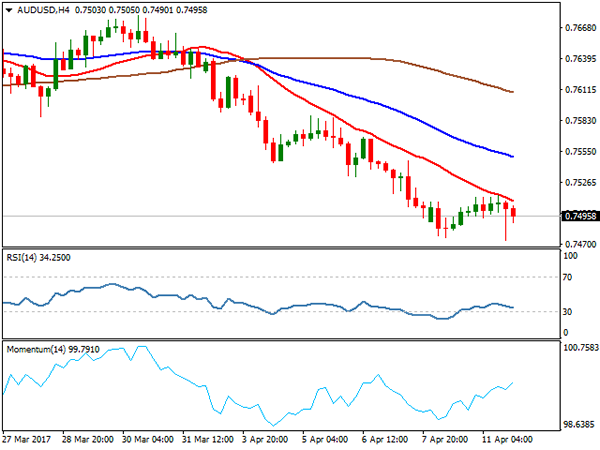
AUDUSD
The Aussie dollar has left the second consecutive Doji candle after broader descend from 0.7747 high showed signs of stall. The pair found footstep 0.7473, above which is holding for the second day, but within limited consolidation that is so far capped by 100SMA at 0.7513. Extended daily studies warn of corrective bounce, as slow stochastic is reversing in deep oversold territory, but without firmer bullish signal for now.
The pair is holding deeply in thick daily Ichimoku cloud, with bearish studies signalling further weakness towards key support at 0.7449 )daily cloud base.
However, break out of current congestion is required for fresh direction signals. Strong barriers at 0.7513/50 (100/200SMA's) would likely limit extended upticks, while only sustained break above 200SMA pivot would generate stronger correction signal.
Data from Australia, released on Tuesday, showed Australian business conditions jumped in March to highs not seen since before global financial crisis. Australia's NAB monthly survey of more than 400 firms showed its index climbed to+14 in March, well above long run average at +5. Upbeat data, however, did not show stronger impact on pair's performance on Tuesday.
Support: 0.7473, 0.7449, 0.7400, 0.7384
Resistance: 0.7514, 0.7550, 0.7576, 0.7611
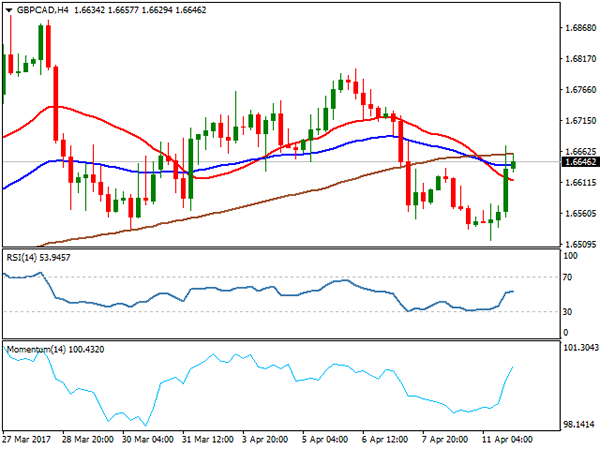
GBPCAD
The GBPCAD pair rallied strongly on Tuesday, on fresh strength of sterling and neutralized strong downside risk that mounted of steep fall in past three days. Descend was contained by pivotal support at 1.6532 (Fibonacci 61.8% retracement of 1.6311/1.6888 ascend) and subsequent bounce retraced 50% of the latest 1.6800/1.6515 downleg.
Daily technicals are returning into firmer bullish setup, as converged 55/100 SMA's remained intact and rally broke above 20 SMA's. Fresh rally also improved momentum studies, showing scope for fresh attack at 1.6693 pivot (200SMA).
Rally is looking for final break above thick hourly Ichimoku cloud at 1.6658, to confirm bullish resumption.
Corrective dips are expected to hold above round-figure 1.6600 support, reinforced by daily Kijun-sen line.
Support: 1.6624, 1.6600, 1.6535, 1.6515
Resistance: 1.6658, 1.6693, 1.6736, 1.6760
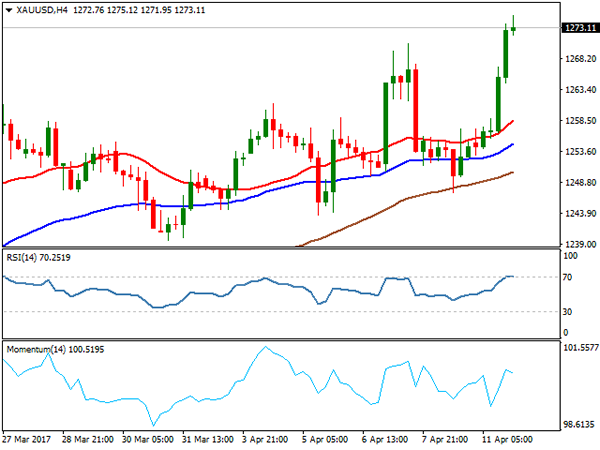
GOLD
Spot Gold was another top winner of Tuesday's strong safe haven buying, triggered by rising geopolitical uncertainty that triggered traders' migration from dollar into traditional safe haven asset Gold. The yellow metal was up 1.6% on Tuesday, running from $1253 low to the American session high at $1275, the highest since Nov 9. Tuesday's strong rally has eventually taken out strong barriers at 1257 (200SMA) which resisted several attacks during past two weeks and former top of 27 Feb at $1263, also probing above Monday's spike high at $1270. Fresh bulls also closed above important $1255 barrier (Fibo 61.8% of larger $1337/$1122 descend, generating another bullish signal.
Rising tensions over North Korea and Middle East, along with upcoming French elections, keep investors nervous and these are supportive factors for further rise in gold's price. Firm close above $1260 zone will be seen as strong bullish signal for gold.
Support: 1263, 1257, 1255, 1250
Resistance, 1275, 1279, 1283, 1291
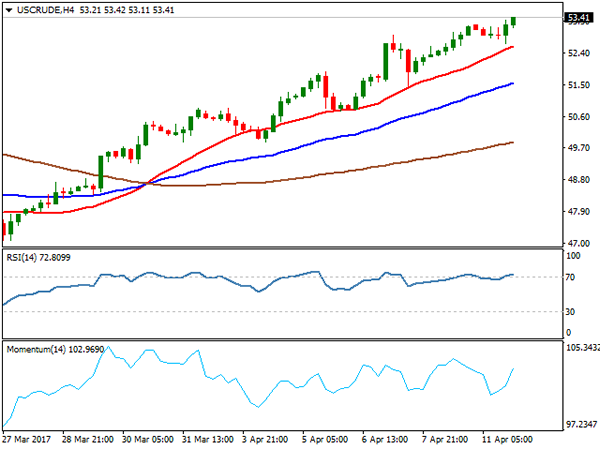
WTI CRUDE OIL
WTI oil posted marginally higher five-week high at $53.41 on Tuesday, after correcting lower to $52.68, following strong ascend in past three days. Doji candle that was formed on Tuesday could be seen as initial signal of rally's stall on strongly overbought daily slow stochastic and from the fundamental side, rising US shale oil production that for now offsets strong support to the oil prices on rising geopolitical tensions.
Oil price, however, remains well supported in the near-term and could rally strongly on escalation of current political crisis, but consolidation and possible corrective easing are in near-term agenda.
No firmer signals from technical studies, will keep oil price in bullish mode for now.
Solid supports on converged 55/10SMA's at $51.56/65 are expected to contain potential dips and keep strong bullish structure intact.
Support: 53.00, 52.68, 52.29, 51.97
Resistance: 53.41, 53.78, 54.50, 55.00
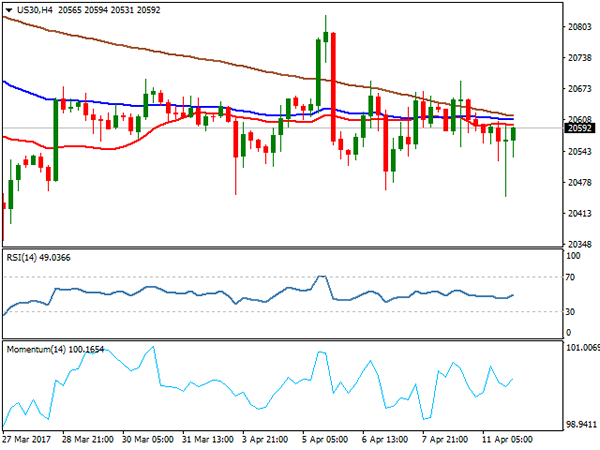
DJIA
Dow Jones remains motionless for the third consecutive day and left another Doji candle that signals strong indecision. US stocks moved lower on Tuesday, on rising concerns about Syria and North Korea, but losses were limited, as investors preferred to play safe amid rising geopolitical tensions. Dow Jones moved within 20447/20623 range on Tuesday, but mainly stayed between converging 20/55 SMA's that mark initial pivots at 20657/20547 respectively and sustained break of either would generate fresh near-term signal. In addition, studies on daily chart are in neutral mode and show no clear direction signal for now.
Support: 20547,20500, 20447, 20400
Resistance: 20623, 20657, 20692, 20750
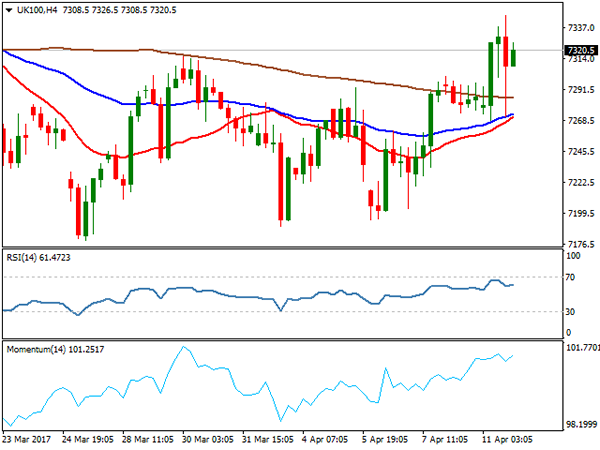
FTSE 100
FTSE index ended Tuesday's trading positively, gaining 0.58% for the day and signalling resumption of recovery leg from 7195, after full retracing 7315/7195 downleg. Daily studies are gaining bullish momentum and signalling further upside, as index closed above daily Kijun-sen pivot at 7311 and fresh bullish extension cracked next barrier at 7343 (Fibonacci 61.8% of 7444/7179 pullback. Rising daily Tenkan-sen that contained Tuesday's action offers strong support at 7268, as rising daily Ichimoku cloud continues to underpin recovery.
Extension and close above 7343 pivot is expected to generate another strong bullish signal.
Support: 7311, 7280, 7268, 7241
Resistance: 7343, 7381, 7400, 7444
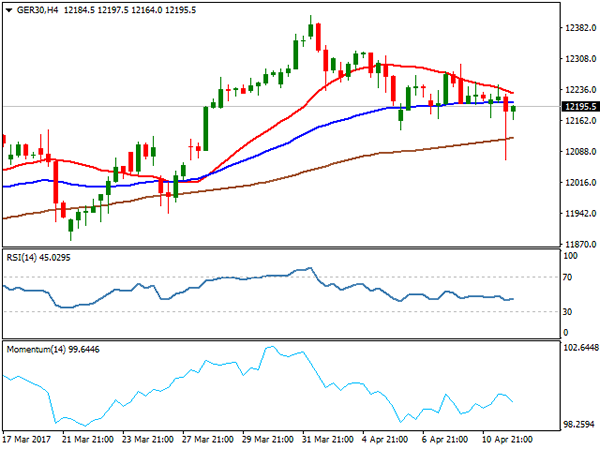
DAX
DAX extended weak tone on Tuesday and spiked lower to hit fresh nearly two-week low at 12069, on surge through key support at 12141 (Apr 06 low / daily Kijun-sen line). However, losses proved to be short-lived, as index swiftly recovered fall on return back to 12200 zone, where Tuesday's trading ended. The action left long-tailed Doji candle that signalled strong indecision but also signals support for potential further recovery after strong downside rejection. Firm break above daily Tenkan-sen that capped Tuesday's action at 12440 would generate initial bullish signal, trigger stronger recovery, with regain of Monday's high at 12296 to trigger further recovery. On the downside, daily Kijun-sen line should contain extended downticks.
Support: 12200, 12167, 12141, 12069
Resistance: 12240, 12296, 12307, 12346
EUR/JPY Daily Outlook
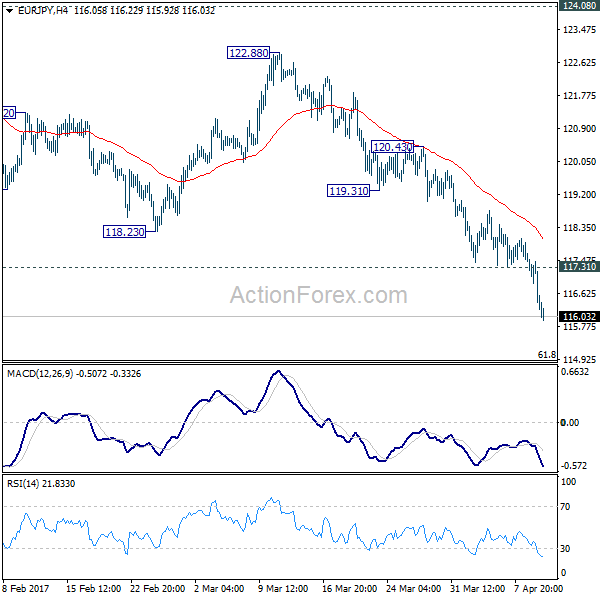
Daily Pivots: (S1) 115.78; (P) 116.66; (R1) 117.09; More...
EUR/JPY's decline accelerates to as low as 115.92 so far and intraday bias remains on the downside. Current fall from 124.08 should target 61.8% retracement of 109.20 to 124.08 at 114.88 next. And, sustained break there will pave the way to retest 109.20 low. On the upside, above 117.31 minor resistance will turn bias neutral and bring consolidations. But upside should be limited below 119.31 support turned resistance and bring another fall.
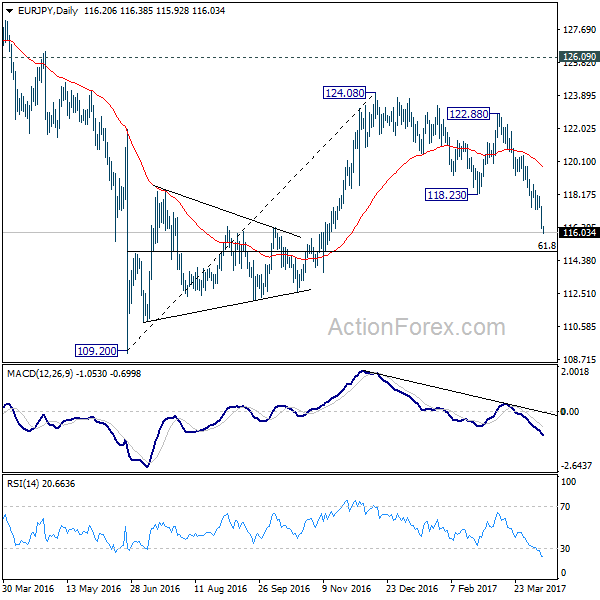
In the bigger picture, the firm break of 38.2% retracement of 109.20 to 124.08 at 118.39 indicates that medium term rise from 109.20 is completed at 124.08. That's well below 126.09 key support turned resistance. Also, EUR/JPY failed to sustain above 55 week EMA. Deeper decline would now be seen back to 109.20 low. Overall, the down trend from 149.76 (2014 high) is not completed yet. Break of 109.20 will resume such down trend towards 94.11 low. In any case, break of 126.09 is needed needed to confirm medium term reversal.
GBP/JPY Daily Outlook
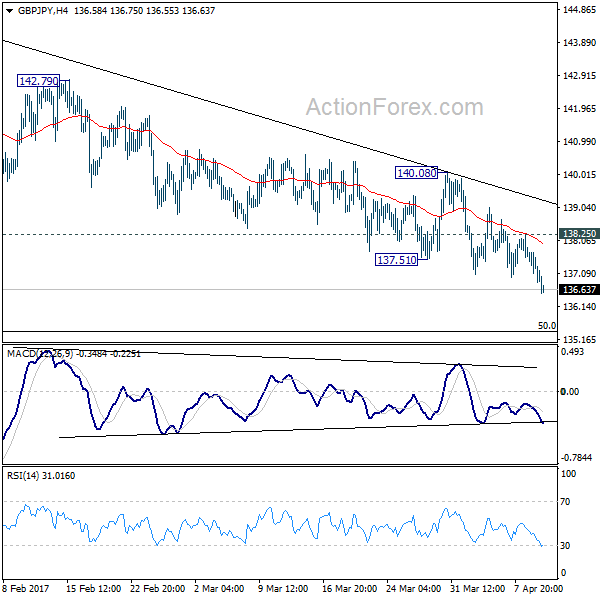
Daily Pivots: (S1) 136.58; (P) 137.15; (R1) 137.48; More...
Intraday bias in GBP/JPY remains on the downside as choppy fall from 144.77 continues. The cross should target medium term fibonacci level at 135.39. At this point, price actions from 148.42 are viewed as a correction. Hence, we'd anticipate strong support from 135.39 to bring rebound. On the upside, break of 138.25 minor resistance will turn bias to the upside for 140.08 resistance. Break will indicate near term reversal. However, sustained break of 135.39 will target 61.8% retracement at 132.31.
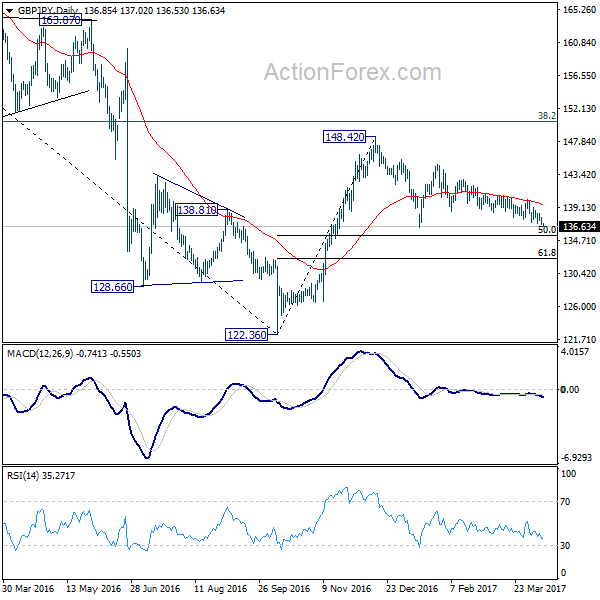
In the bigger picture, price actions from 122.36 medium term bottom are still seen as a corrective pattern. Main focus is on 38.2% retracement of 195.86 to 122.36 at 150.42. Rejection from there will turn the cross into medium term sideway pattern. Or, sustained break of 50% retracement of 122.36 to 148.42 at 135.39 will turn outlook bearish for a test on 122.36 low. Though, sustained break of 150.42 will extend the rebound towards 61.8% retracement of 195.86 to 122.36 at 167.78.
EUR/AUD Daily Outlook
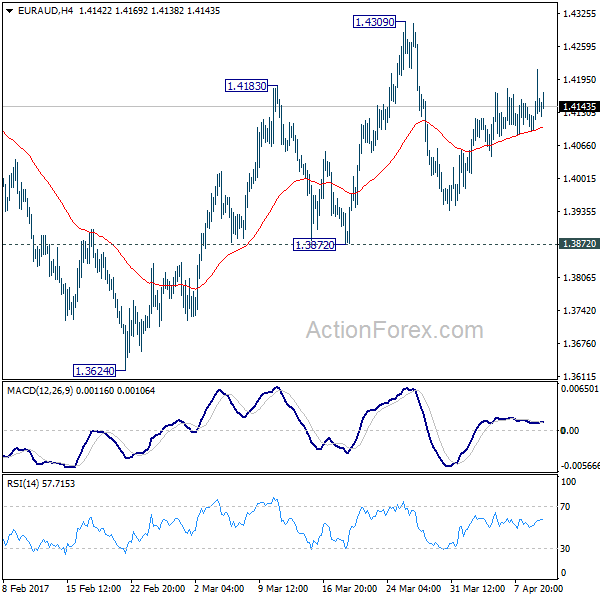
Daily Pivots: (S1) 1.4085; (P) 1.4150; (R1) 1.4206; More...
Intraday bias in EUR/AUD remains neural as it's staying in range of 1.3872/4309. With 1.3872 support intact, further rise is in favor. And, we're mildly favoring the case of trend reversal after defending key support level at 1.3671. On the upside, break of 1.4309 will extend the rebound from 1.3624 to 1.4721 key resistance level next. Decisive break of 1.4721 should confirm larger trend reversal. However, firm break of 1.3872 support will dampen our bullish view. In such case, intraday bias will be turned back to the downside for 1.3624 low instead.
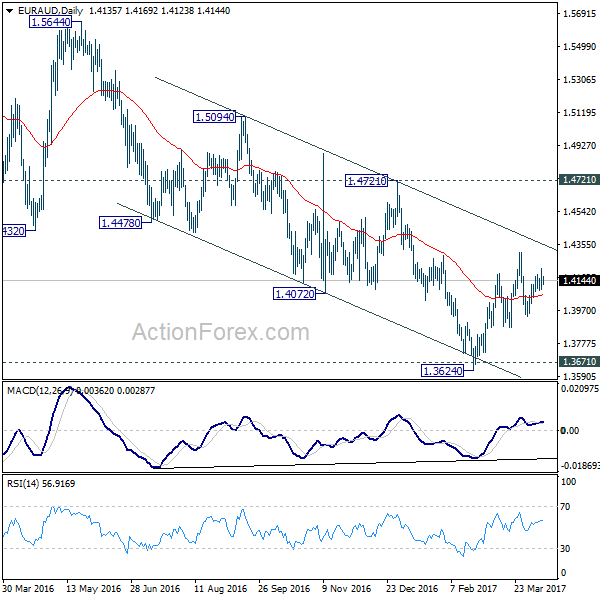
In the bigger picture, price actions from 1.6587 medium term top are viewed as a corrective pattern. Such correction could be completed after testing 1.3671 key support. Break of 1.4721 cluster resistance (38.2% retracement of 1.6587 to 1.3624 at 1.4756) should confirm this case and target 61.8% retracement at 1.5455 and above. Overall, we'd expect the up trend from 1.1602 to resume later. However, sustained break of 1.3671 will invalidate our bullish view and would turn extend the fall from 1.6587 towards 1.1602 long term bottom.
EUR/GBP Daily Outlook
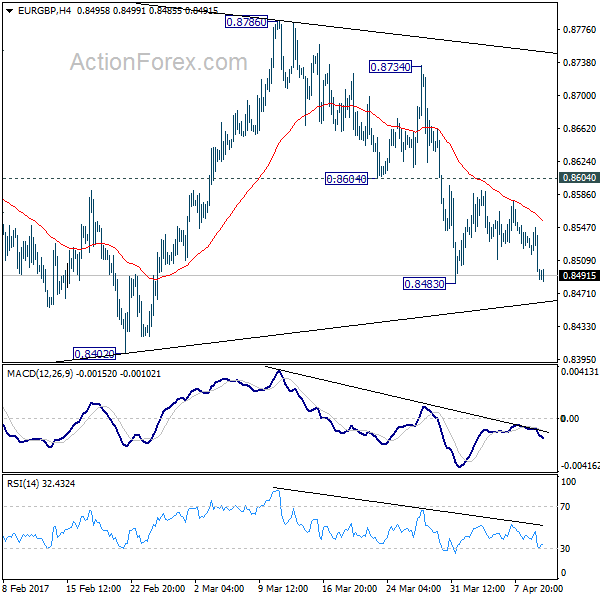
Daily Pivots: (S1) 0.8468; (P) 0.8508; (R1) 0.8529; More...
EUR/GBP is holding above 0.8483 temporary low and intraday bias remains neutral. As noted before, decline from 0.8786 could be developing into the third leg of the whole corrective pattern from 0.9304. And hence, deeper fall is expected ahead. On the downside, break of 0.8483 will turn bias to the downside for 0.8402 support first. Decisive break there should confirm our bearish view and target 0.8303 and below. As fall from 0.9304 is viewed as a corrective move, we'd expect strong support at 0.8116/20 cluster support to contain downside and bring rebound. On the upside, above 0.8604 minor resistance will delay the bearish case. That is, one more recovery will be seen to complete a five wave triangle pattern fro 0.8303 before completion.
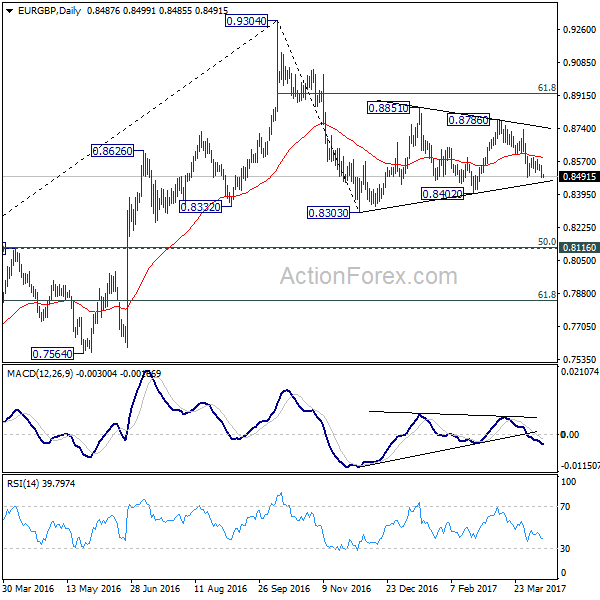
In the bigger picture, price actions from 0.9304 are viewed as a medium term corrective pattern. Such decline is likely ready to resume and should make a new low below 0.8303. At this point, we'd expect strong support from 0.8116 cluster support (50% retracement of 0.6935 to 0.9304 at 0.8120) to contain downside. Rise from 0.6935 (2015 low) will resume at a later stage to 0.9799 (2008 high). However, sustained break of 0.8116 could bring deeper decline to next key support level at 0.7564 before the correction completes.
EUR/CHF Daily Outlook
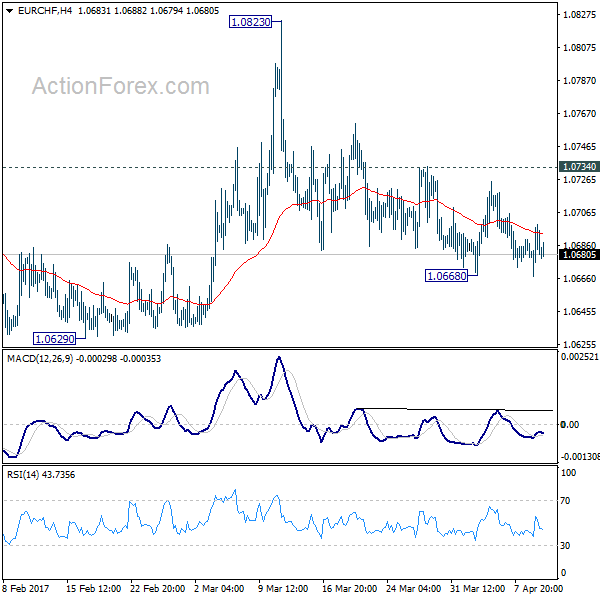
Daily Pivots: (S1) 1.0667; (P) 1.0683; (R1) 1.0698; More...
EUR/CHF is still bounded in range above 1.0668 and intraday bias stays neutral. But the bearish outlook is unchanged with 1.0734 resistance intact. That is, rebound from 1.0629 has completed at 1.0823. And the larger decline from 1.1198 is likely still in progress. On the downside, below 1.0668 will target 1.0620/29 key support zone. Decisive break there will resume whole fall from 1.1198 and target next long term fibonacci level at 1.0485. Nonetheless, break of 1.0734 will suggest that pull back from 1.0823 is completed and turn bias back to the upside for this resistance.
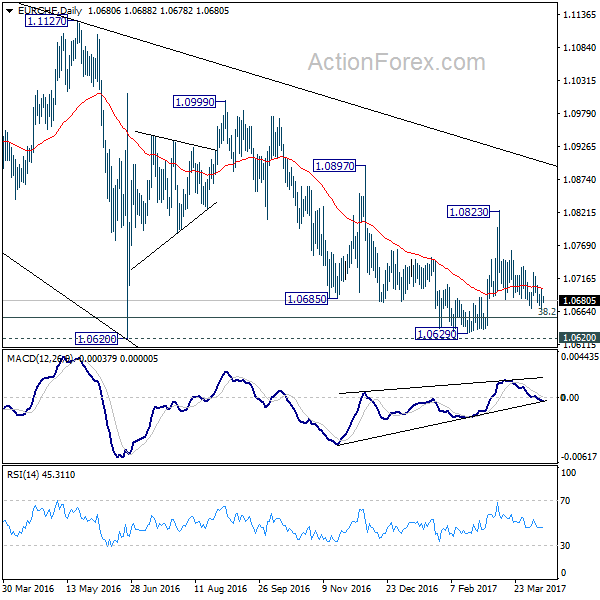
In the bigger picture, the decline from 1.1198 is seen as a corrective move. Current development suggests that it's not completed yet. Sustained trading below 38.2% retracement of 0.9771 to 1.1198 at 1.0653 will target 50% retracement at 1.0485. In any case, break of 1.0823 resistance is needed to be the first indication of reversal. Otherwise, deeper fall is still expected even in case of recovery.
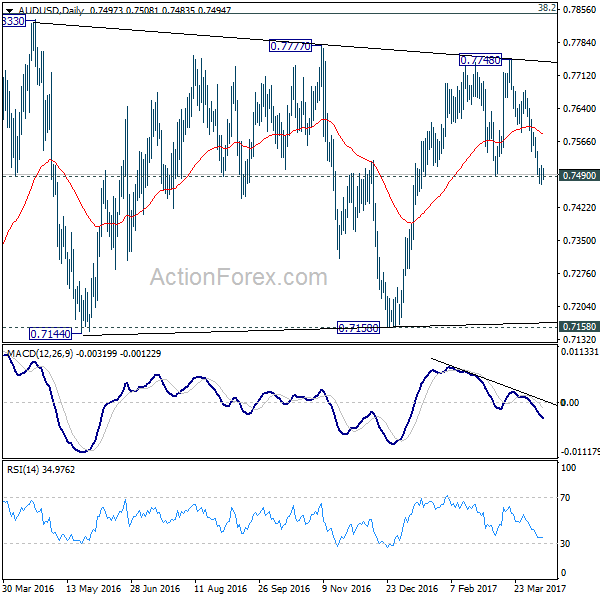
AUD/USD Daily Outlook
Daily Pivots: (S1) 0.7477; (P) 0.7495; (R1) 0.7517; More...
Intraday bias in AUD/USD is turned neutral for the moment. Rise from 0.7158 is likely completed at 0.7748. And, near term trend has reversed. Sustained break of 0.7490 support should confirm this bearish case. And, deeper fall should be seen back to 0.7158 support zone next. On the upside, above 0.7351 minor resistance with dampen this view and turn bias back to the upside for 0.7586/7678 resistance zone instead.
In the bigger picture, we're still treating price actions from 0.6826 low as a correction. And, as long as 38.2% retracement of 0.9504 to 0.6826 at 0.7849 holds, long term down trend from 1.1079 is expected to resume sooner or later. Break of 0.6826 low will target 0.6008 key support level. However, firm break of 0.7849 will indicate that rise from 0.6826 is developing into a medium term rebound, rather than a sideway pattern. In such case, stronger rise should be seen to 55 month EMA (now at 0.8142) and above.