Sample Category Title
Oil Resistance Zone
While trying to keep these blogs topical, with an escalating war in the Middle East, I can't go past another feature on Oil.
We had been looking for an opportunity to short oil off daily resistance, but the buyers haven't given up just yet. Oil's strength was of course exacerbated by the recent US missile attack on Syria, helping push the commodity back into our daily resistance zone.
Here is the daily resistance level that has been on our radar:
The daily could also be seen to have broken out of a bearish trend line, retested it this time as support, and now be looking to push higher. Zoom out on your own charts and take a look at the trend line I'm referring to.
It's also just simply a higher low and with further pressure on a resistance level that is becoming weaker with every touch, I don't want to keep shorting.
Zooming into the 15 minute chart and you can see how price has reacted to the first level of resistance:
A clean breakout and then retest of the level that has been tested in both directions multiple times before and after.
Just keep in mind that there's still plenty of resistance up here and that it should be viewed as a zone more than a hard level.
Safe trading!
10-Year Yields Tell the Story as Yen Breaks
US 10-year yields broke out of the 4-month range as risk aversion gripped markets Tuesday. It was a classic flight to safety in FX as the yen was the top performer while the commodity currencies lagged. Japanese PPI is due next. A new Premium trades in the Aussie has been issued after it had last been opened on March 8 and closed at a gain.
US 10-year yields closed at the lowest level since November 29 in a break below a clear and critical support line. The range between 2.30% and 2.62% has been pivotal since December with tests (and holds) on both sides. The next level of major support is 2.00% to the 200-dma at 2.03% in a slide that would highlight trouble elsewhere.
Some of the nerves in markets were calmed when the S&P 500 recovered to finish 3 points lower from down 20 points but it was the exception. Gold broke out higher and the yen was heavily bid.
But it's the bond market that has led major moves lately. In March, the failure of the 10-year to break 2.63% was the earliest sign of trouble that later spread elsewhere.
The USD/JPY chart also flashed trouble ahead as it finally broke (and closed) below 110.00 after four failed attempts over the past two weeks.
No single headline was responsible for the change in sentiment, which didn't take hold until a few hours into US trading. One concern was geopolitics as Trump warned China that it would get a better trade deal if it dealt with North Korea. He followed that by saying if China didn't cooperate, the US could deal with North Korea itself. A later report said US and Japanese leaders had discussed notification if/when the US planned to attack. That's a sign that the talk was more than bluster.
In addition, there was more talk about some of the problems we outlined earlier including high debt and tight lending.
We will be watching closely on whether these moves reverse or continue in the day ahead. The Asia-Pacific calendar features Japanese PPI and machine orders at 2350 GMT. PPI is forecast to rise 1.4% y/y and machine orders +2.5% y/y.
Loonie Lower as Geopolitics Trump Oil Gains
The Canadian dollar gave back the gains form the previous session as risk aversion made investors seek safety. There is little economic data to drive markets this week leaving all the spotlight to diplomatic and less than diplomatic exchanges between foreign powers. Comments from Donald Trump urging China to help or get out of the way on North Korea has ruffled some feathers. As the G7 meeting concludes with no new sanctions towards Russia, Putin has said that US-Russia relations are at Cold War lows. The appetite for gold has risen as the yellow metal is being used as a safe haven during turbulent times.
The Bank of Canada (BoC) will publish its monetary policy report and rate statement tomorrow at 10:00 am EDT. Governor Poloz will find it hard to maintain a dovish tone and talk to the loonie down after strong gains in employment and inflation could be signs that the central bank needs to get out of the sidelines sooner rather than later. In January cutting rates was still an option for Poloz, but now the March rate hike by the U.S. Federal Reserve and improving economic fundamentals in Canada could bring about a rate hike. Rising household debt and the housing bubble born out of low rates will be a concern for the central bank. The market consensus calls for no changes to the rate this time, but the pressure will rise if the economy is able to maintain its momentum and imports drive inflation higher urging the BoC to act sooner rather than later.
USD/CAD has lost 0.101 percent in the Tuesday trading session. The pair is trading at 1.3343 as the USD is losing traction after comments from US President Donald Trump have put China on the spot regarding North Korea. The G7 meeting in Germany has yielded no new sanctions for Russia after the Syrian attacks were condemned internationally.
The Canadian dollar remains stable as oil prices are still up 0.325 percent today. West Texas is trading at $52.61 ahead of tomorrow's US crude inventories. Oil prices have risen of late on the back of supply disruptions and the anticipation of an extension to the original Organization of the Petroleum Exporting Countries (OPEC) production cut agreement.
Gold has risen 1.257 percent in the last 24 hours. The price of the yellow metal is trading at $1,266 where it trades near daily highs after geopolitical anxiety has sent investors looking for safety. Gold has hit a five month high as this week's geopolitical factors are taken into consideration on a already full risk agenda with the French elections the next major event on April 23. The Trump administration has boosted the metal as a safe haven after it appeared to have been reprioritized by investors in the last couple of years.
Comments from Fed Chair Janet Yellen yesterday at the University of Michigan were positive for the commodity as once again the "patient" Fed was on display.
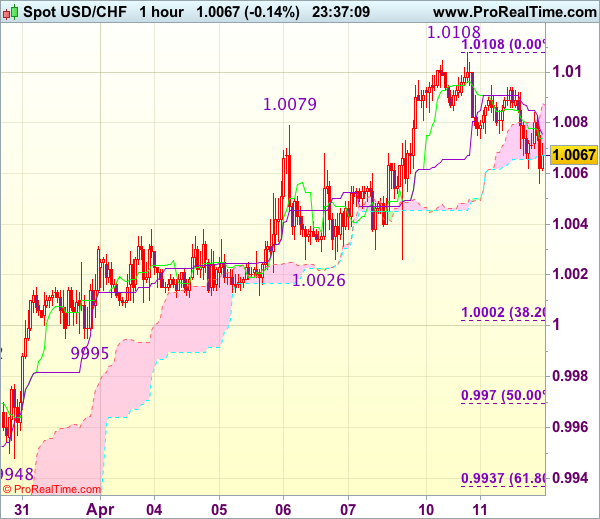
Trade Idea Wrap-up: USD/CHF – Buy at 1.0000
USD/CHF - 1.0070
Most recent candlesticks pattern : N/A
Trend : Near term up
Tenkan-Sen level : 1.0074
Kijun-Sen level : 1.0076
Ichimoku cloud top : 1.0088
Ichimoku cloud bottom : 1.0067
Original strategy :
Buy at 1.0000, Target: 1.0100, Stop: 0.9965
Position : -
Target : -
Stop : -
New strategy :
Buy at 1.0000, Target: 1.0100, Stop: 0.9965
Position : -
Target : -
Stop : -
As the greenback has retreated after rising to 1.0108 yesterday, suggesting consolidation below this level would be seen and initial downside risk is for pullback to 1.0050, then towards support at 1.0026, however, reckon 0.9995 support would contain weakness and bring another rise later, above indicated resistance at 1.0108-09 would extend recent upmove from 0.9813 towards 1.0140-45 but loss of upward momentum should prevent sharp move beyond another previous resistance at 1.0171, risk from there has increased for a retreat to take place later.
In view of this, would not chase this rise here and would be prudent to buy dollar on subsequent pullback as support at 0.9995 should limit downside. Below 0.9970 (50% Fibonacci retracement of 0.9831-1.0108) would abort and signal top is formed instead, bring correction to support at 0.9948.
Trade Idea Wrap-up: GBP/USD – Exit short entered at 1.2475
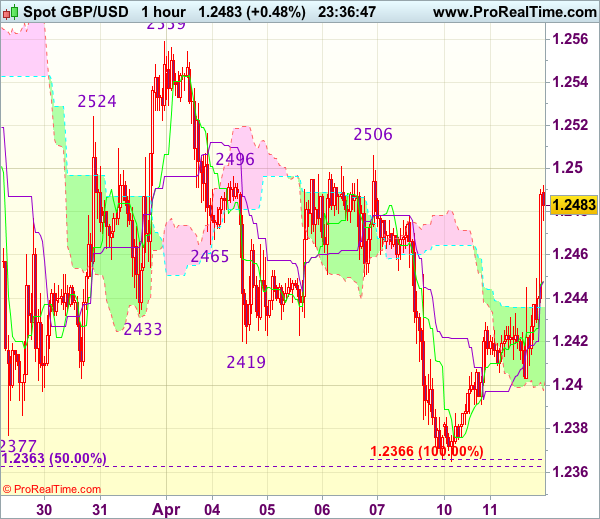
GBP/USD - 1.2480
Most recent candlesticks pattern : N/A
Trend : Near term down
Tenkan-Sen level : 1.2448
Kijun-Sen level : 1.2448
Ichimoku cloud top : 1.2436
Ichimoku cloud bottom : 1.2398
Original strategy :
Sold at 1.2475, Target: 1.2375, Stop: 1.2510
Position : - Short at 1.2475
Target : - 1.2375
Stop : - 1.2510
New strategy :
Exit short entered at 1.2475,
Position : - Short at 1.2475
Target : -
Stop : -
Current rally in NY morning in part due to cross trading in sterling suggests low has been formed at 1.2365, hence near term upside risk remains for the rebound from there to extend gain towards resistance at 1.2506, however, break there is needed to add credence to this view and bring further gain to 1.2525-30, however, near term overbought condition should prevent sharp move beyond 1.2550-60, bring retreat later.
In view of this, would be prudent to exit short entered at 1.2475 and stand aside for now. Below 1.2445-50 would suggest an intra-day top is possibly formed, bring weakness to 1.2420, break there would confirm and bring further fall to 1.12400-05 which is likely to hold on first testing.
Trade Idea Wrap-up: EUR/USD – Sell at 1.0665
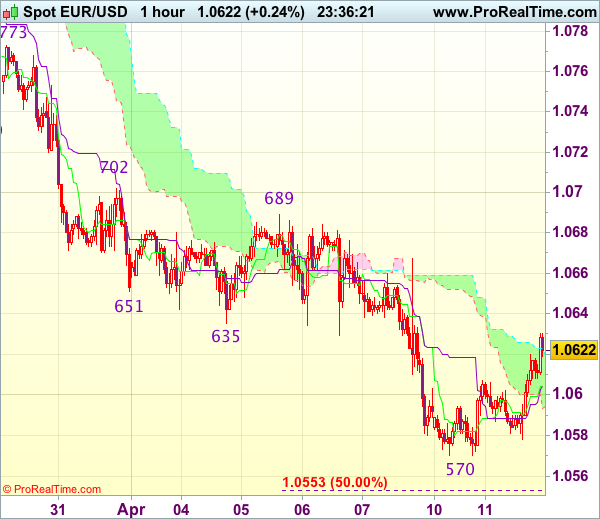
EUR/USD - 1.0618
Most recent candlesticks pattern : N/A
Trend : Near term down
Tenkan-Sen level : 1.0604
Kijun-Sen level : 1.0604
Ichimoku cloud top : 1.0623
Ichimoku cloud bottom : 1.0593
Original strategy :
Sell at 1.0665, Target: 1.0565, Stop: 1.0700
Position : -
Target : -
Stop : -
New strategy :
Sell at 1.0665, Target: 1.0565, Stop: 1.0700
Position : -
Target : -
Stop : -
As the single currency has continued trading defensively after recent selloff, suggesting recent decline may resume after consolidation, although corrective bounce to 1.0630-35 cannot be ruled out, however, reckon upside would be limited to 1.0667 resistance (Friday’s high) and bring another decline later, below support at 1.0570 would extend the decline from 1.0906 to 1.0550-55 (50% projection of 1.0906-1.0635 measuring from 1.0689), then 1.0525-30 but near term oversold condition should prevent sharp fall below 1.0500, risk from there is seen for a rebound later.
In view of this, would not chase this fall here and would be prudent to sell dollar on further recovery as 1.0667 resistance should limit upside. Only a firm break above said resistance at 1.0667 would abort and suggest low is formed instead, risk a stronger rebound to 1.0689, then 1.0702.
Trade Idea Wrap-up: USD/JPY – Stand aside
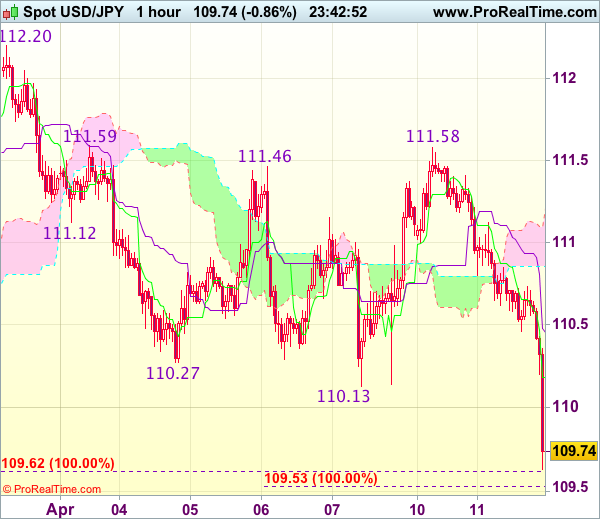
USD/JPY - 109.77
Most recent candlesticks pattern : N/A
Trend : Near term down
Tenkan-Sen level : 110.18
Kijun-Sen level : 110.46
Ichimoku cloud top : 111.21
Ichimoku cloud bottom : 110.86
Original strategy :
Bought at 110.60, stopped at 110.25
Position : - Long at 110.60
Target : -
Stop : - 110.25
New strategy :
Stand aside
Position : -
Target : -
Stop : -
The greenback has dropped in NY morning on active cross-buying in yen in part due to risk aversion, suggesting recent decline is still in progress, hence downside risk remains for recent decline to extend weakness to 109.50-55 (100% projection of 112.20-110.27 measuring from 111.46), however, near term oversold condition should prevent sharp fall below 109.20-25 and reckon 109.00 would hold from here, bring rebound later.
In view of this, would not chase this fall here and would be prudent to stand aside in the meantime. Above the Tenkan-Sen (now at 110.18) would bring recovery towards the Kijun-Sen (now at 110.46) but price should falter below 110.73 and bring another decline later.
Sterling: No Firm Direction after Inflation Data
Headlines
European stock markets managed to recover most of the opening losses as risk aversion from Asian trading didn't persist. US stock markets open with small losses as US investors seem to be more afraid about the US' tougher stance against Syria and North-Korea.
British inflation held steady in March due to the later timing of this year's Easter holidays which pushed down airfares, and a dip in global oil prices, but the squeeze on households looks set to resume soon. Consumer prices increased in March by 2.3% Y/Y while core CPI declined from 2% Y/Y to 1.8% Y/Y.
EMU industrial output declined in February (-0.3% M/M), against market expectations of a slight increase (0.1% M/M), largely due a sharp drop of energy production. German ZEW-investor confidence rose more than anticipated in April, as Europe's largest economy continues to gather momentum. The forward looking expectations component also increased further, beating consensus.
US NFIB small business optimism eased off multi-year highs in March, marginally declining in line with expectations from 105.3 to 104.7.
North Korea is "looking for trouble" and the US is prepared to act unilaterally on the issue, with or without China's support, US President Trump said, as the new administration solidifies its much tougher stance on the Asian country.
US Secretary of State Tillerson said it is clear the regime of President Bashar al-Assad in Syria "is coming to an end" and issued a stern warning to Russia as he headed to Moscow for high-level talks on the crisis. The secretary of state also said that "Russia has failed in its commitment to guarantee a Syria free of chemical weapons."
Rates
Technical losses for Bund, but US investors cautious
German Bunds underperformed US Treasuries today. Risk aversion pushed US Treasuries higher during Asian dealings. The Bund opened stronger as well with an immediate test of key support in the German 10-yr yield (0.2%; lower bound 0.2%-0.5% trading range). The test failed, sending German yields higher and Bunds lower. The move's technical importance could be similar to Friday's failed test of key US yields (5y: 1.8% and 10y: 2.3%) if confirmed. European equities managed to recover most of the opening losses and weighed on Bunds as well. Eco data were mixed with disappointing (outdated) industrial production, but a positive surprise from the more important German ZEW investor sentiment. The headline reading hit its highest level in April since the euro crisis, while the forward looking component suggests that strong Q1 growth momentum expands into Q2. The only item on the US eco calendar was NFIB small business optimism, which declined as forecast from 105.3 to 104.7 in March. US Treasuries managed to hold on to most of the overnight gains despite the Bund's downward bias in European trading. Rising geopolitical tensions (Syria, North Korea) still linger in the background of investors' minds (see headlines). As the US trading session gets going, core bonds gain momentum as risk sentiment hits a snag. US stocks deepen losses after the opening and USD/JPY is heading to 110.10 support.
At the time of writing, the German yield curve shifts 0.4 bps lower (2-yr) to 0.7 bps (10-yr) higher. Changes on the US yield curve vary between -3.5 bps (10-yr) and -2.4 bps (2-yr). On intra EMU-bond markets, 10-yr yield spread changes versus Germany widen up to 3 bps (Italy; supply-related) with Greece marginally outperforming (-3 bps).
The Austrian Treasury launched a new 10-yr benchmark via syndication (Apr2027). The bond was priced to yield MS -18 bps, compared to MS -17 bps area guidance. Final books closed in excess of €7.5B, allowing the Treasury to print €4.5B. The Dutch debt agency tapped the on the run DSL (€0.95B 2.5% Jan2033). The amount sold was in the lower half of the €0.75-1.25B on offer, but that's not unusual for Dutch auctions. Tonight, the US Treasury continues its refinancing with a $20B 10-yr Note auction. Currently, the WI trades around 2.34%.
Currencies
Dollar loses ground
The dollar lost ground across the board today. During European trading, EUR/USD recorded the biggest move as the US/EU spread differential narrowed. EUR/USD increased from 1.0580 to an intraday high of 1.0620. The German 10-yr yield bounced off key support (0.2%), pulling the German curve higher. A strong German ZEW investor sentiment might have played a role as well. EMU industrial production (disappointing) and US NFIB small business optimism (spot on consensus) didn't affect trading. Yesterday's French bond/stock underperformance (on rising support for extreme-left candidate Mélenchon) didn't persist and thus didn't weigh on the single currency.
In the US trading session, USD/JPY took over command. Comments by US secretary of state Tillerson (on Russia/Syria) and by US president Trump (on North Korea) confirmed the US' recent tougher stance, stressing geopolitical tensions and creating some new risk aversion. USD/JPY slid from levels around 110.70 to 110.20 currently and is gearing up for a new test of key 110.10 support.
The trade-weighted dollar dropped from 101.10 to 100.80 today, erasing the final post-payrolls gains.

Sterling: No firm direction after inflation data
Overnight, the BRC like for like sales disappointed as they dropped 1% Y/Y while a 0.3% M/M decline was expected. It's a further sign that consumer spending is losing momentum. However, it didn't impact sterling as investors clearly waited for the important inflation data. At their previous policy meeting, the BoE (MPC) showed they saw little room to let inflation move much higher without tightening policy. However, their concerns proved premature as inflation behaved well in March. The headline CPI was stable and in line with expectations at 2.3% Y/Y, while core CPI eased even slightly more than expected to 1.8% Y/Y from 2% Y/Y previously. Input and output PPI eased in March compared to February, even if they surpassed expectations and remain at a fairly high levels. Only core output PPI was a tad higher. There was a knee-jerk reaction pushing sterling stronger versus euro and dollar. However, the absence of follow through sterling buying caught the eye of sterling bulls and bears. Gains were in no time erased. EUR/GBP currently trades around 0.8540, versus the 0.8535 opening. Cable is marginally higher at 1.2434 versus 1.2415 at the open, the modest rise of EUR/USD being the trigger. EMU data were mixed (see dollar section) and the NFIB small business confidence was in line with expectations. Concluding, a session to rapidly forget
GBP/JPY Bullish Wolfe Wave at ATR Pivot
The GBP/JPY has been dropping as suggested in my previous article but at this point it has formed a bullish Wolfe Wave structure straight at ATR pivot point. Boosted by better than expected CPI, the GBP has made a slight recovery but for further upside it needs to break 138.50 with a steady upside momentum. The final target is 138.30 as 1-4 Wolfe Wave target will hardly be reached today (139,80). However, since this Wolfe Wave is not strict as point 3 is below point 1 it might be invalidated. Invalidation will come at the break of double bottom at 137.10. If this happens next target is 136.82 followed by 136.53.
Elliott Wave Analysis: USDCAD Eyeing 1.3180 Region
USDCAD has turned nicely down from 1.3533, clearly with five waves which is a structure of a bearish turn based on the Elliott Wave principle. As such, we now expect even more weakness after recently unfolded three wave bounce from 1.3262 that is pointing lower into wave three. We think that 1.3262 is going to be broken this week from where market may see a drop to 1.3180 short-term objective.
USDCAD, 4H