Sample Category Title
Gold Testing Uptrend Support, Silver Still Weak, Crude Oil Continued Bullish Move.
Gold Testing uptrend support.
Gold challenge to near term resistance has paused yet, momentum seems back to bullish despite some consolidation on trendline support. Resistance is located at 1263 (27/02/2017 high). Hourly support can be found at 1224.10 (16/03/2017 low).
In the long-term, the technical structure suggests that there is a growing upside momentum. A break of 1392 (17/03/2014) is necessary ton confirm it, A major support can be found at 1045 (05/02/2010 low).
Silver Still weak.
Silver is trying to find a new equilibrium after its massive sell-off, however, demand has not materialized. Strong resistance is given at a distance at 18.49 (27/02/2017 high). Key support is given at 16.82 (15/03/2017 low).
In the long-term, the death cross indicates that further downsides are very likely. Resistance is located at 25.11 (28/08/2013 high). Strong support can be found at 11.75 (20/04/2009).
Crude oil Continued bullish move.
Crude oil keeps on increasing. The commodity had been located in a bearish trend since the commodity had been unable to mount a serious challenge to resistance at 55.24 (03/01/2017 high) but now the pair is heading higher. Resistance is given at 51.88 (05/041/2017 high). Hourly support is given at 47.09 (22/03/2017 low).
In the long-term, crude oil has recovered after its sharp decline last year. However, we consider that further weakness are very likely. Strong support lies at 24.82 (13/11/2002) while resistance can now be found at 55.24 (03/01/2017 high).
EUR/CHF Weak Technical Signals, EUR/JPY Fade Buying, EUR/GBP Marginal Selling Pressure On Trendline.
EUR/CHF Weak technical signals.
EUR/CHF has paused near the key support at 1.0684 (see also the falling channel). However, the persistent succession of lower highs favours a bearish bias. Hourly resistances can be found at 1.0691 (07/04/2017 high). The medium-term pattern suggests us to see continued bearish pressures towards key support that can be found at 1.0623 (24/06/2016 low). Expected to see further decline.
In the longer term, the technical structure is mixed. Resistance can be found at 1.1200 (04/02/2015 high). Yet,the ECB's QE programme is likely to cause persistent selling pressures on the euro, which should weigh on EUR/CHF. Supports can be found at 1.0184 (28/01/2015 low) and 1.0082 (27/01/2015 low).
EUR/JPY Fade buying.
EUR/JPY recovery bounce off support was short lived. Resistance stands at 122.88 (13/03/0217 high). Support at 117.43 has held up so far however, break would trigger further weakness towards strong support given at 113.73 (09/11/2016 low)
In the longer term, the technical structure validates a medium-term succession of lower highs and lower lows. As a result, the resistance at 149.78 (08/12/2014 high) has likely marked the end of the rise that started in July 2012. Strong support at 94.12 (24/07/2012 low) looks nonetheless far away.
EUR/GBP Marginal selling pressure on trendline.
EUR/GBP is consolidating following sharp fall, yet further upside is likely. Hourly resistance is given at 0.8591 (05/04/2017 high). Strong resistance is given at 0.8787 (13/03/2017 high). Hourly support can be found at 0.8484 (31/03/2017 low). Expected to show continued weakness.
In the long-term, the pair has largely recovered from recent lows in 2015. The technical structure suggests a growing upside momentum. The pair is trading above from its 200 DMA. Strong resistance can be found at 0.9500 psychological level.
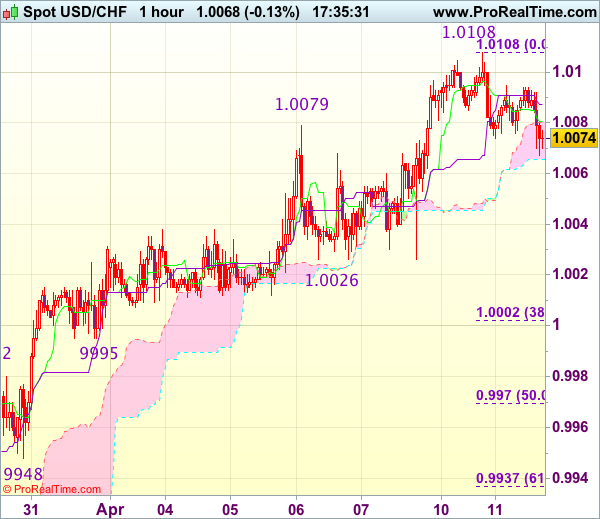
Trade Idea Update: USD/CHF – Buy at 1.0000
USD/CHF - 1.0069
Original strategy :
Buy at 1.0000, Target: 1.0100, Stop: 0.9965
Position : -
Target : -
Stop : -
New strategy :
Buy at 1.0000, Target: 1.0100, Stop: 0.9965
Position : -
Target : -
Stop : -
As the greenback has retreated after rising to 1.0108 yesterday, suggesting consolidation below this level would be seen and initial downside risk is for pullback to 1.0050, then towards support at 1.0026, however, reckon 0.9995 support would contain weakness and bring another rise later, above indicated resistance at 1.0108-09 would extend recent upmove from 0.9813 towards 1.0140-45 but loss of upward momentum should prevent sharp move beyond another previous resistance at 1.0171, risk from there has increased for a retreat to take place later.
In view of this, would not chase this rise here and would be prudent to buy dollar on subsequent pullback as support at 0.9995 should limit downside. Below 0.9970 (50% Fibonacci retracement of 0.9831-1.0108) would abort and signal top is formed instead, bring correction to support at 0.9948.
Fed’s Chairman Janet Yellen Delivers Speech At University Of Michigan
'Now the focus is different and we want to make sure that we sustain the progress that we have achieved, and that the appropriate stance of policy now is something closer to neutral.' - Janet Yellen, Federal Reserve
On Monday, Janet Yellen, the Chairman of the US Federal Reserve, delivered a speech on monetary policy at the University of Michigan. She noted that country went through a long and severe recession, as the Fed failed to identify growth of systemic risks, which made the country's financial system very vulnerable. Nevertheless, she believed that the Central bank's course of recovery was chosen correctly, with unemployment standing now at 4.5% and inflation fluctuating just above the targeted 2%. These figures showed that the economy was growing at a moderate pace. She noted that consumer spending remained the main driver of economic growth but added that there were significant improvements in housing and investment. The similar picture was observed in terms of the global economy, which also became more robust and healthier. Altogether, the Federal Reserve Chair suggested that the economy would continue developing at a modest pace. Thus, the Fed's main objective should be to sustain the achieved result, i.e. full employment, and stabilize inflation around 1.75%-2%. She noted that if the economy continues to perform in line with the Fed's objectives, it would gradually raise short-term interest rates in the upcoming months.
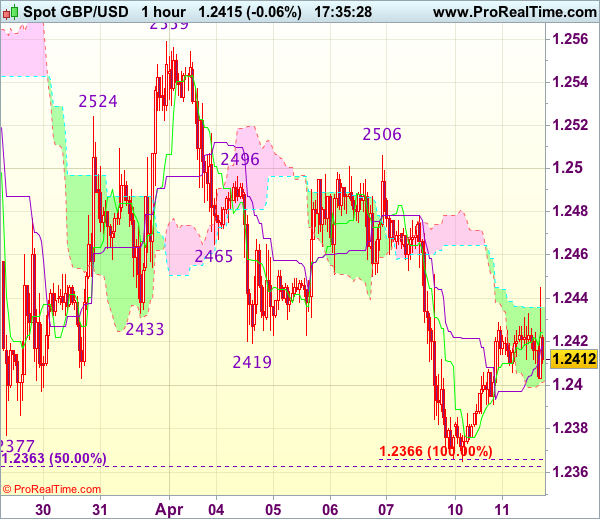
Trade Idea Update: GBP/USD – Sell at 1.2475
GBP/USD - 1.2417
Original strategy :
Sell at 1.2475, Target: 1.2375, Stop: 1.2510
Position : -
Target : -
Stop : -
New strategy :
Sell at 1.2475, Target: 1.2375, Stop: 1.2510
Position : -
Target : -
Stop : -
Cable’s rebound after finding good support around 1.2365-66 has retained our view that further consolidation above this level would be seen and gain to 1.2445-50 cannot be ruled out, however, reckon 1.2475-80 would limit upside and bring another decline later, below said support at 1.2365-66 would extend recent decline from 1.2616 to 1.2350, then towards 1.2325-30 but oversold condition should limit downside and reckon 1.2300 would hold from here.
In view of this, would not chase this fall here and would be prudent to sell cable on further subsequent recovery as 1.2475-80 should limit upside. Only break of resistance at 1.2506 would abort and signal low is formed, bring a stronger rebound to 1.2525-30 first.
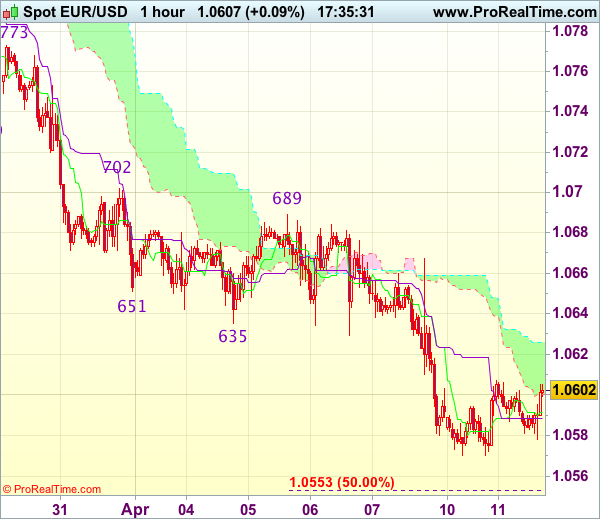
Trade Idea Update: EUR/USD – Sell at 1.0665
EUR/USD - 1.0606
Original strategy :
Sell at 1.0665, Target: 1.0565, Stop: 1.0700
Position : -
Target : -
Stop : -
New strategy :
Sell at 1.0665, Target: 1.0565, Stop: 1.0700
Position : -
Target : -
Stop : -
As the single currency has continued trading defensively after recent selloff, suggesting recent decline may resume after consolidation, although corrective bounce to 1.0625-35 cannot be ruled out, however, reckon upside would be limited to 1.0667 resistance (Friday’s high) and bring another decline later, below support at 1.0570 would extend the decline from 1.0906 to 1.0550-55 (50% projection of 1.0906-1.0635 measuring from 1.0689), then 1.0525-30 but near term oversold condition should prevent sharp fall below 1.0500, risk from there is seen for a rebound later.
In view of this, would not chase this fall here and would be prudent to sell dollar on further recovery as 1.0667 resistance should limit upside. Only a firm break above said resistance at 1.0667 would abort and suggest low is formed instead, risk a stronger rebound to 1.0689, then 1.0702.
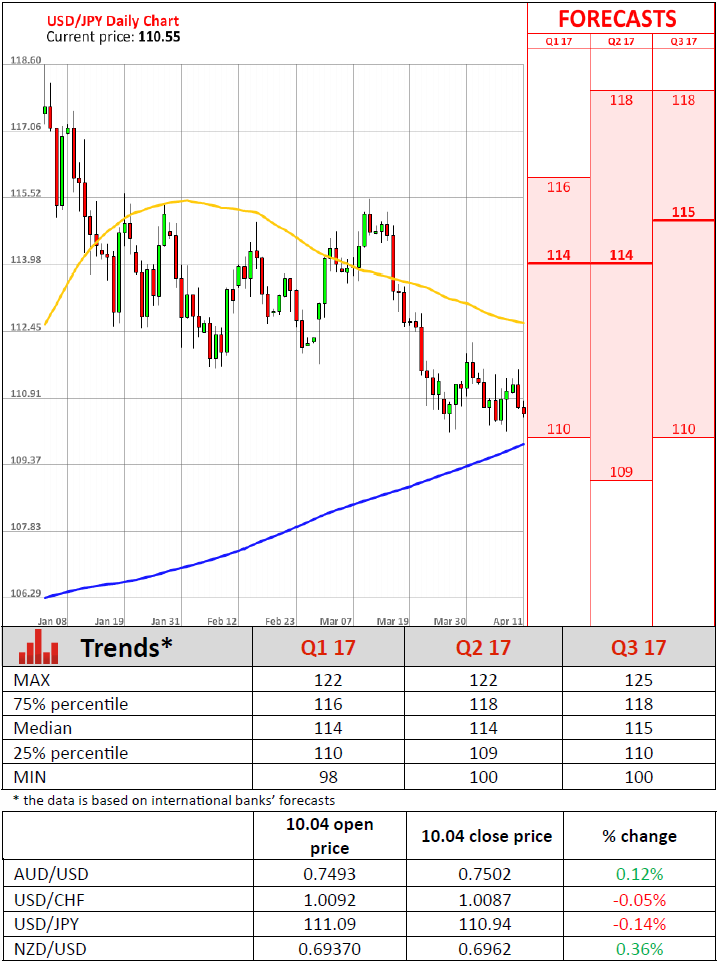
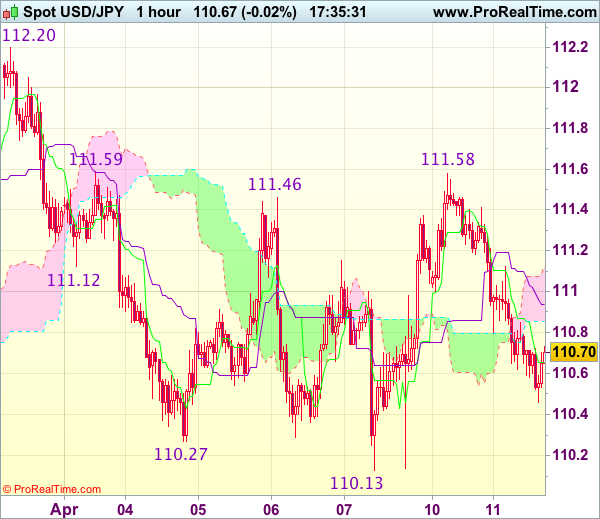
Trade Idea Update: USD/JPY – Hold long entered at 110.60
USD/JPY - 110.65
Original strategy :
Bought at 110.60, Target: 111.60, Stop: 110.25
Position : - Long at 110.60
Target : - 111.60
Stop : - 110.25
New strategy :
Hold long entered at 110.60, Target: 111.60, Stop: 110.25
Position : - Long at 110.60
Target : - 111.60
Stop : - 110.25
Although dollar has remained under pressure after retreating sharp from yesterday’s high of 111.58 and marginal weakness from here cannot be ruled out, reckon 110.25-30 would contain downside and bring another rebound later, above 111.10-15 would suggest the retreat from 111.58 has ended, bring test of 111.58-59 resistance, break there would add credence to our view that further consolidation above recent low at 110.11 would be seen and signal the fall from 112.20 has ended, then a stronger rebound to 111.90-00 would follow but said resistance at 112.20 should hold and choppy trading within 110.11-112.20 would continue.
In view of this, we are holding on to our long position entered at 110.60 but one should exit on such rebound. Below 110.25-30 would risk test of said support at 110.11-13 but only break there would confirm medium term decline has resumed for further subsequent fall to 109.80-85 (1.618 times projection of 112.20-111.12 measuring from 111.59), however, price should hold above 109.50-55 (100% projection of 112.20-110.27 measuring from 111.46).
USD/CHF Finding Demand, USD/CAD Sharp Rejection, AUD/USD Pause In Bearish Pressure.
USD/CHF Finding demand.
USD/CHF is consolidating below new high at 1.0107. Hourly support is given at 1.0039 (07/04/2017 base low) then 0.9814 (27/03/2017 low). Key resistance can be found at a distance at 1.0171 (07/03/2017) then 1.0344 (15/12/2016 high). Expected to show another leg higher.
In the long-term, the pair is still trading in range since 2011 despite some turmoil when the SNB unpegged the CHF. Key support can be found 0.8986 (30/01/2015 low). The technical structure favours nonetheless a long term bullish bias since the unpeg in January 2015.
USD/CAD Sharp rejection.
USD/CAD short-term bullish technical pattern has quickly reversed, indicating further downside pressure. Key support is given at 1.3265 (21/03/2016 low) is in focus then 1.2969 (31/01/2017 low). Resistance can be located at 1.3427 (10/04/2017 high) then 1.3456 (04/04/2017 range high).
In the longer term, there is a golden cross with the 50 dma crossing the 200 dma indicating further upside pressures. Strong resistance is given at 1.4690 (22/01/2016 high). Long-term support can be found at 1.2461 (16/03/2015 low).
AUD/USD Pause in bearish pressure.
AUD/USD bounce near the support has thus far unimpressive failed to find momentum, confirming persistent selling pressures. Next meaningful support is located at 0.7449 (13/01/2017 low). Resistance can be located at 0.7515 (intraday high and downtrend channel top).
In the long-term, we are waiting for further signs that the current downtrend is ending. Key supports stand at 0.6009 (31/10/2008 low) . A break of the key resistance at 0.8295 (15/01/2015 high) is needed to invalidate our long-term bearish view.
EUR/USD Bearish Pause, GBP/USD Marginal Bounce, USD/JPY Turning Downwards Within Range.
EUR/USD Bearish pause.
EUR/USD is boucing after breaking support implied by short term base. Hourly support can be found at 1.0570 (intraday low). Stronger support can be found at 1.0494 (22/02/2017 low). Resistance can be located at a distant 1.0658 (07/07/2017 reaction high). Expected to see further short-term weakness.
In the longer term, the death cross late October indicated a further bearish bias. The pair has broken key support given at 1.0458 (16/03/2015 low). Key resistance holds at 1.1714 (24/08/2015 high). Expected to head towards parity.
GBP/USD Marginal bounce.
GBP/USD remains weak despite bounce near the support at 1.2334, indicating persistent selling pressures. Hourly resistance is located at 1.2469 (07/04/2017 high).
The long-term technical pattern is even more negative since the Brexit vote has paved the way for further decline. Long-term support given at 1.0520 (01/03/85) represents a decent target. Long-term resistance is given at 1.5018 (24/06/2015) and would indicate a long-term reversal in the negative trend. Yet, it is very unlikely at the moment.
USD/JPY Turning downwards within range.
USD/JPY is trading sideways below resistance at 112.20 (31/03/2017 high) and 110.11 support. Stronger resistance can be located at 113.57 (16/03/2017 high) while support is given at 110.11 (27/03/2017 low).
We favor a long-term bearish bias. Support is now given at 96.57 (10/08/2013 low). A gradual rise towards the major resistance at 135.15 (01/02/2002 high) seems absolutely unlikely. Expected to decline further support at 93.79 (13/06/2013 low).
GBP/USD Elliott Wave Analysis
GBP/USD – 1.2418
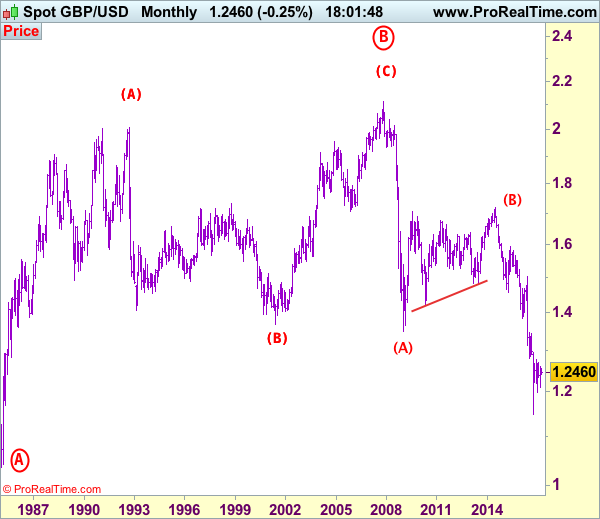
GBP/USD – Wave 4 is unfolding as an (A)-(B)-(C) and could have ended at 1.7192
Although cable slipped again last week and near term downside risk remains for the erratic fall from last month’s high of 1.2616 to bring retracement of the rise from 1.2109, reckon downside would be limited to support at 1.2335 and bring another rebound later, above 1.2505-10 would bring test of resistance at 1.2559, break there would signal the retreat from 1.2616 has ended, bring retest of this level, break there would extend the rebound from 1.2109 to previous resistance at 1.2706 but break there is needed to signal another leg of corrective upmove from 1.1986 low is underway for further gain to 1.2800 and then 1.2900, having said that, psychological resistance at 1.3000 would remain intact.
Our preferred count on the daily chart is that cable's rebound from 1.3500 (wave (A) trough) is unfolding as a wave (B) with A ended at 1.7043, followed by triangle wave B and wave C as well as wave (B) has possibly ended at 1.7192, below support at 1.4232 would add credence to this count, then further fall to 1.4000 level would follow but reckon downside would be limited to 1.3655 support and price should stay above previous support at 1.3500.
On the downside, whilst initial pullback to 1.2360-65 cannot be ruled out, reckon downside would be limited to 1.2335 support and bring another rise later. A daily close below support at 1.2335 would dampen this bullish view and bring weakness to 1.2290-00 but reckon 1.2240-50 would hold, bring another rebound. A drop below 1.2240-50 would suggest the rebound from 1.2109 has ended instead, bring further fall to 1.2200 and then 1.2150-60 but said support at 1.2109 should remain intact.
Recommendation: Buy at 1.2335 for 1.2550 with stop above 1.2235.
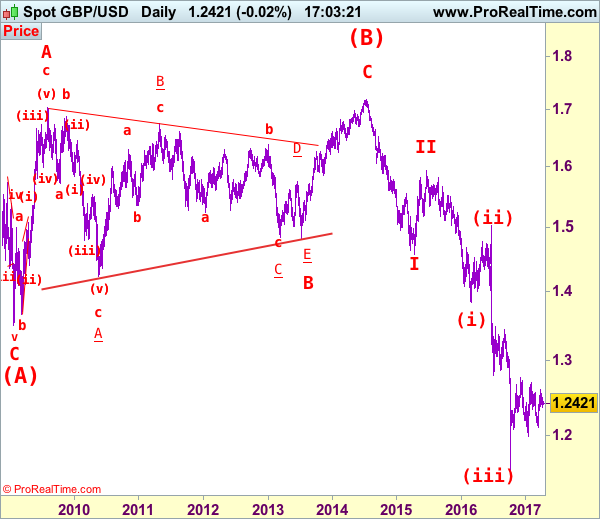
Longer term - Cable's rise from 1.0520 (Feb 1985) to 2.0100 (September 1992) is seen as [A], the decline to 1.3682 is labeled as (B) and (C) wave rally has ended at 2.1162 (9 Nov, 2007) which is also the top of larger degree wave B with circle. The selloff from there is a 5-waver with wave (A) ended at 1.3500 (23 Jan 2009), wave (B) itself is labeled as A: 1.6733, triangle wave B: 1.4813 and wave C as well as top of wave (B) ended at 1.7192 (2014), hence the selloff from there is an impulsive wave (C) with wave I : 1.4566, wave II 1.5930, an extended wave III is unfolding and already exceeded our downside target at 1.3500 and 1.3000, hence weakness to 1.2500 and possibly 1.2000 cannot be ruled out, however, price should stay well above psychological level at 1.0000.