Sample Category Title
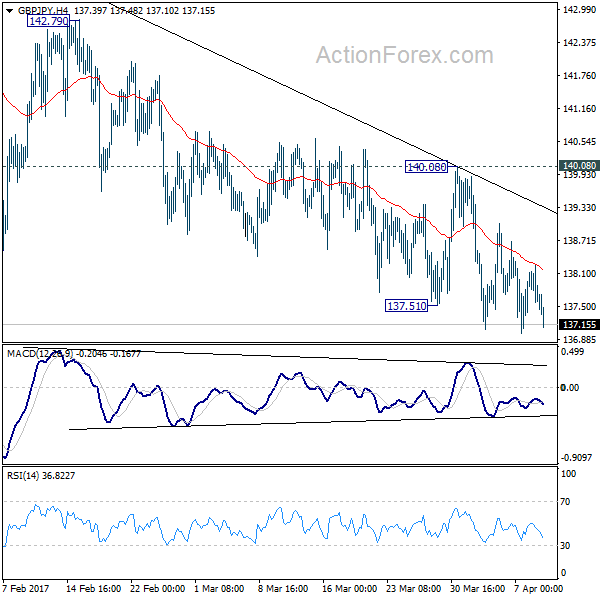
GBP/JPY Daily Outlook
Daily Pivots: (S1) 137.23; (P) 137.75; (R1) 138.21; More...
No change in GBP/JPY's outlook. Near term outlook stays mildly bearish and further decline is expected with 140.08 resistance intact. But still, choppy price actions from 148.42 are viewed as a corrective pattern. Hence, we'd anticipate strong support from medium term fibonacci level at 135.39 to bring rebound. On the upside, firm break of 140.08 resistance will now indicate near term reversal and turn bias back to the upside for 142.79 resistance first.
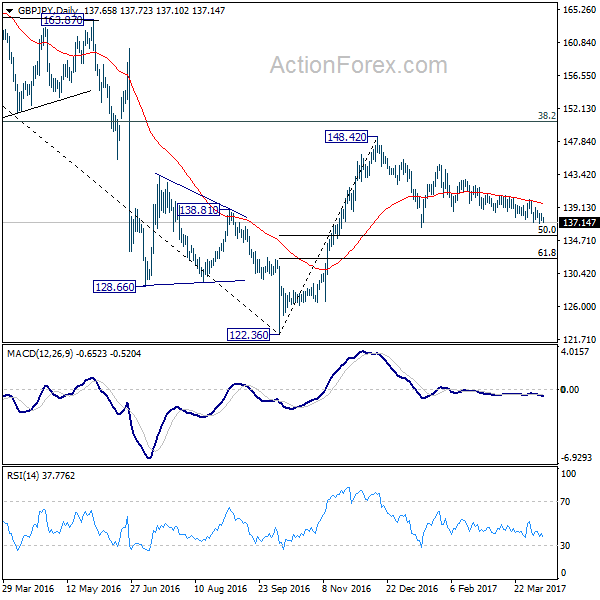
In the bigger picture, price actions from 122.36 medium term bottom are still seen as a corrective pattern. Main focus is on 38.2% retracement of 195.86 to 122.36 at 150.42. Rejection from there will turn the cross into medium term sideway pattern. Or, sustained break of 50% retracement of 122.36 to 148.42 at 135.39 will turn outlook bearish for a test on 122.36 low. Though, sustained break of 150.42 will extend the rebound towards 61.8% retracement of 195.86 to 122.36 at 167.78.
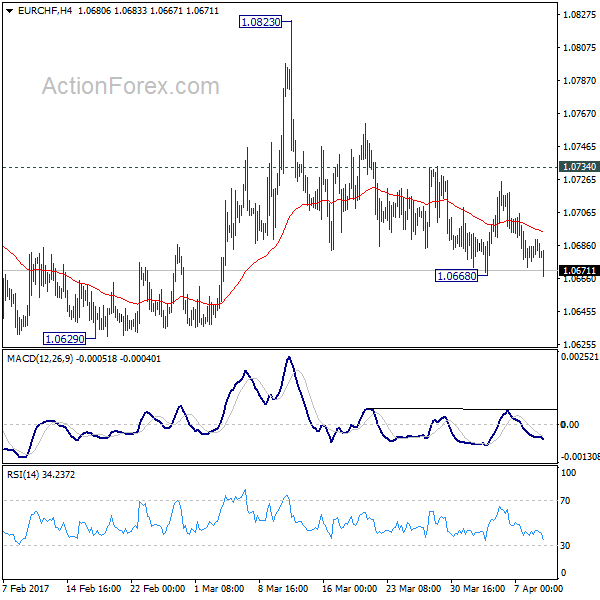
EUR/CHF Daily Outlook
Daily Pivots: (S1) 1.0678; (P) 1.0684; (R1) 1.0692; More...
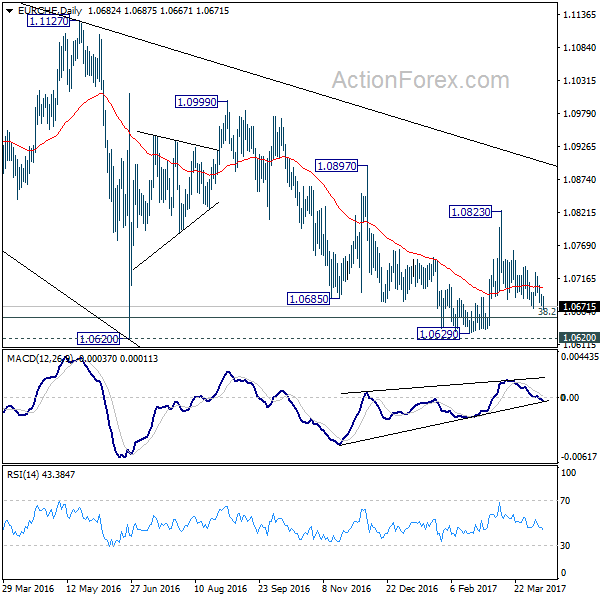
Intraday bias in EUR/CHF remains neutral first. But the bearish outlook is unchanged with 1.0734 resistance intact. That is, rebound from 1.0629 has completed at 1.0823. And the larger decline from 1.1198 is likely still in progress. On the downside, below 1.0668 will target 1.0620/29 key support zone. Decisive break there will resume whole fall from 1.1198 and target next long term fibonacci level at 1.0485. Nonetheless, break of 1.0734 will suggest that pull back from 1.0823 is completed and turn bias back to the upside for this resistance.
In the bigger picture, the decline from 1.1198 is seen as a corrective move. Current development suggests that it's not completed yet. Sustained trading below 38.2% retracement of 0.9771 to 1.1198 at 1.0653 will target 50% retracement at 1.0485. In any case, break of 1.0823 resistance is needed to be the first indication of reversal. Otherwise, deeper fall is still expected even in case of recovery.
Trade Idea : USD/CHF – Buy at 1.0030
USD/CHF - 1.0074
Most recent candlesticks pattern : N/A
Trend : Near term up
Tenkan-Sen level : 1.0082
Kijun-Sen level : 1.0089
Ichimoku cloud top : 1.0080
Ichimoku cloud bottom : 1.0066
Original strategy :
Buy at 1.0000, Target: 1.0100, Stop: 0.9965
Position : -
Target : -
Stop : -
New strategy :
Buy at 1.0000, Target: 1.0100, Stop: 0.9965
Position : -
Target : -
Stop : -
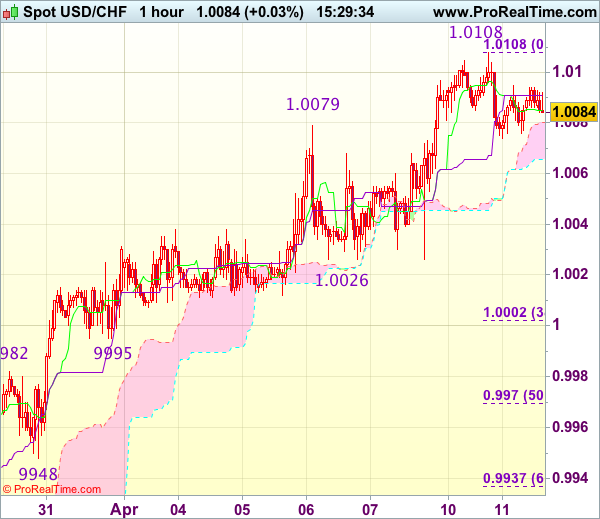
As the greenback has retreated after rising to 1.0108 yesterday, suggesting consolidation below this level would be seen and initial downside risk is for pullback to 1.0050, then towards support at 1.0026, however, reckon 0.9995 support would contain weakness and bring another rise later, above indicated resistance at 1.0108-09 would extend recent upmove from 0.9813 towards 1.0140-45 but loss of upward momentum should prevent sharp move beyond another previous resistance at 1.0171, risk from there has increased for a retreat to take place later.
In view of this, would not chase this rise here and would be prudent to buy dollar on subsequent pullback as support at 0.9995 should limit downside. Below 0.9970 (50% Fibonacci retracement of 0.9831-1.0108) would abort and signal top is formed instead, bring correction to support at 0.9948.
EUR/AUD Daily Outlook
Daily Pivots: (S1) 1.4079; (P) 1.4128; (R1) 1.4160; More...
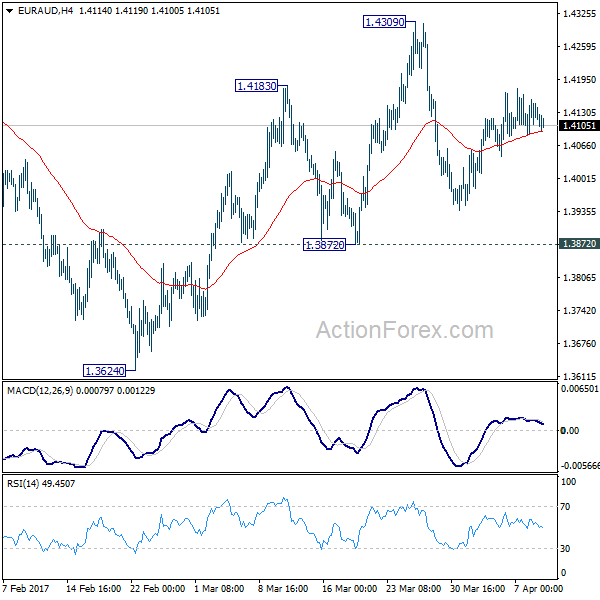
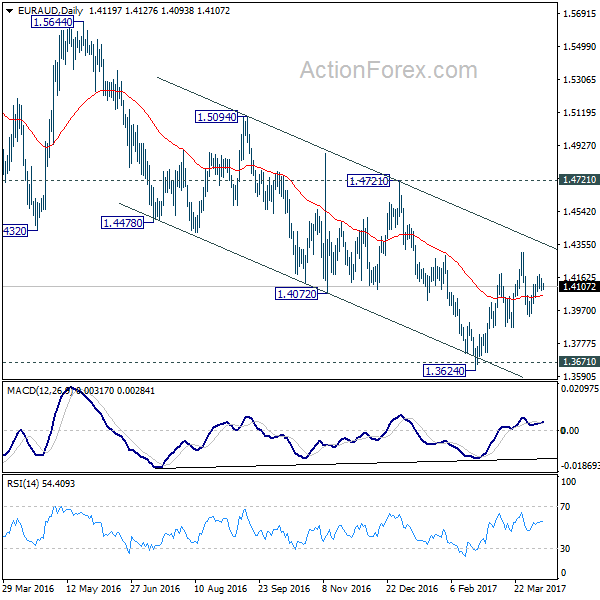
EUR/AUD is still bounded in range of 1.3872/4309 and intraday bias remains neutral for the moment. With 1.3872 support intact, further rise is in favor. And, we're mildly favoring the case of trend reversal after defending key support level at 1.3671. On the upside, break of 1.4309 will extend the rebound from 1.3624 to 1.4721 key resistance level next. Decisive break of 1.4721 should confirm larger trend reversal. However, firm break of 1.3872 support will dampen our bullish view. In such case, intraday bias will be turned back to the downside for 1.3624 low instead.
In the bigger picture, price actions from 1.6587 medium term top are viewed as a corrective pattern. Such correction could be completed after testing 1.3671 key support. Break of 1.4721 cluster resistance (38.2% retracement of 1.6587 to 1.3624 at 1.4756) should confirm this case and target 61.8% retracement at 1.5455 and above. Overall, we'd expect the up trend from 1.1602 to resume later. However, sustained break of 1.3671 will invalidate our bullish view and would turn extend the fall from 1.6587 towards 1.1602 long term bottom.
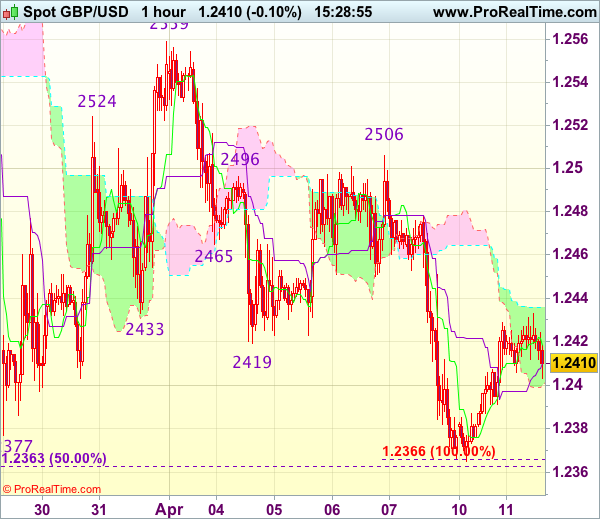
Trade Idea : GBP/USD – Sell at 1.2475
GBP/USD - 1.2413
Most recent candlesticks pattern : N/A
Trend : Near term down
Tenkan-Sen level : 1.2418
Kijun-Sen level : 1.2418
Ichimoku cloud top : 1.2410
Ichimoku cloud bottom : 1.2400
Original strategy :
Sell at 1.2475, Target: 1.2375, Stop: 1.2510
Position : -
Target : -
Stop : -
New strategy :
Sell at 1.2475, Target: 1.2375, Stop: 1.2510
Position : -
Target : -
Stop : -
Cable’s rebound after finding good support around 1.2365-66 has retained our view that further consolidation above this level would be seen and gain to 1.2445-50 cannot be ruled out, however, reckon 1.2475-80 would limit upside and bring another decline later, below said support at 1.2365-66 would extend recent decline from 1.2616 to 1.2350, then towards 1.2325-30 but oversold condition should limit downside and reckon 1.2300 would hold from here.
In view of this, would not chase this fall here and would be prudent to sell cable on further subsequent recovery as 1.2475-80 should limit upside. Only break of resistance at 1.2506 would abort and signal low is formed, bring a stronger rebound to 1.2525-30 first.
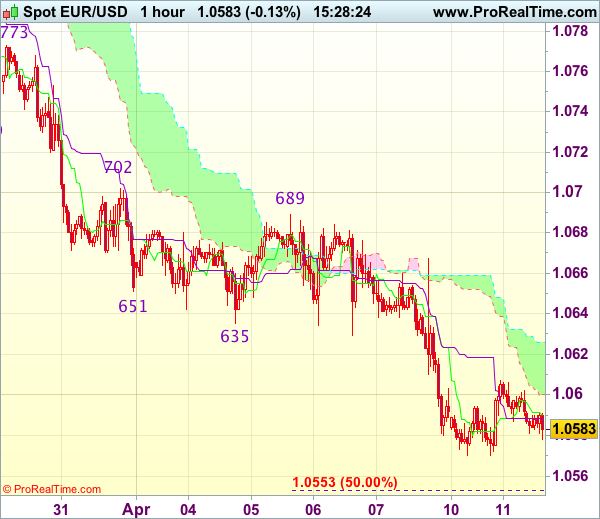
Technical Outlook: EURUSD – Bearish Technicals Favor Further Downside, Daily Cloud Base Is key
The Euro was in red in Asia but still holding above daily cloud base at 1.0583 that so far marks significant support, as Monday's probe below failed to sustain break.
Multiple daily MA's bear crosses continue to weigh, as bearish momentum is building up and favoring further easing.
Near-term action is also pressured by thick falling hourly cloud (spanned between 1.0598 and 1.0624) with bearish bias expected to remain while the price stays below the cloud.
On the other side, prolonged consolidation above fresh lows at 1.0570 could be expected while daily cloud top (1.0612) caps, as oversold slow stochastic on daily chart is struggling to break above oversold territory and generate bullish signal. However, talks of delay of US tax reform would support the Euro.
Good offers lay at 1.0600/25, with extended uptick not to exceed broken Fibo 61.8% barrier at 1.0650.
Resumption of downtrend from 1.0905 needs clear break below daily cloud base to expose interim support at 1.0524 and key short-term support at 1.0493 (02 Mar low).
The Euro is eyeing release of German/EU ZEW economic sentiment data for firmer signals
Res: 1.0598, 1.0612, 1.0625, 1.0650
Sup: 1.0578, 1.0568, 1.0524, 1.0493
Trade Idea : EUR/USD – Sell at 1.0665
EUR/USD - 1.0588
Most recent candlesticks pattern : N/A
Trend : Near term down
Tenkan-Sen level : 1.0590
Kijun-Sen level : 1.0589
Ichimoku cloud top : 1.0626
Ichimoku cloud bottom : 1.0600
Original strategy :
Sell at 1.0665, Target: 1.0565, Stop: 1.0700
Position : -
Target : -
Stop : -
New strategy :
Sell at 1.0665, Target: 1.0565, Stop: 1.0700
Position : -
Target : -
Stop : -
As the single currency has continued trading defensively after recent selloff, suggesting recent decline may resume after consolidation, although corrective bounce to 1.0625-35 cannot be ruled out, however, reckon upside would be limited to 1.0667 resistance (Friday’s high) and bring another decline later, below support at 1.0570 would extend the decline from 1.0906 to 1.0550-55 (50% projection of 1.0906-1.0635 measuring from 1.0689), then 1.0525-30 but near term oversold condition should prevent sharp fall below 1.0500, risk from there is seen for a rebound later.
In view of this, would not chase this fall here and would be prudent to sell dollar on further recovery as 1.0667 resistance should limit upside. Only a firm break above said resistance at 1.0667 would abort and suggest low is formed instead, risk a stronger rebound to 1.0689, then 1.0702.
Geopolitical Concerns Boost Save Havens
Investors are dumping risk assets early Tuesday as geopolitical tensions remained the key catalyst shaking the markets. The move by China to send 150,000 troops to North Korea border over fears that Trump may strike Pyongyang and comments from White House Press Secretary Sean Spicer that additional U.S. intervention could be triggered are putting investors on the defensive side.
The U.S. administration suggested earlier that there's no intention to remove Assad, but if going forward they respond to every barrel bomb attack, this will indicate a full-scale war against the regime. This will of course be considered as crossing the redline with Russia and will be seen asa severe blow to U.S.-Russian relations, which arealready not in their greatest state.
Today, the U.S. Secretary of State Rex Tillerson's visit to Moscow will provide an early indication on how the situation will evolve. If Putin decidesto withdraw the “Order of Friendship Award” once given to Tillerson, markets could become more jittery.
The U.S. dollar edged down slightly, as U.S. Treasury yields fell for the second day. Fed Chair Janet Yellen didn't provide any new catalyst to traders about the prospects for a June hike or how the Fed will proceed with shrinking the balance sheet. She expressed her confidence that the economy will continue to grow at a moderate pace and that rates will increase gradually; however, this was nothing new to investors.
The EURUSD is trading within 20 pips range early Tuesday, after rebounding from a one-month low yesterday. There are less than two weeks until the French votefor President kicks off and so far, opinion polls indicate that Marine Le Pen and Emmanuel Macron will come out ahead in the first round. They also show that Le Pen will lose badly in the 7 May runoff election against either Macron or FrancoisFillon. I will continue to price in some risk premium on "what if things went wrong" and Marine Le Pen became President.However, this risk remains below 10% and this is what's reflected in French government bonds.
Gold and Yen are as usual the primary beneficiaries of the heightened geopolitical tensions. Both are up 0.2% against the dollar today, but I'm more interested in the gold move as it's making a new attempt to close above the 200-day moving average. This marks the sixth attempt in a month gold has triedto break the long-term moving average, but all were unsuccessful in closing above it. If the precious metal was successful in closing above the 200-day moving average for the day and the week, we are likely to see additional upside momentum.
The Most Important Data Release Is The CPI Inflation Data For March Due Out Today
Market movers today
In the US, the NFIB small business opt imism for March is due out . Business opt imism soared after the elect ion of Donald Trump to President . However, given the increased uncertainty about how many of his policies Trump will actually be able to carry through with in pract ice, business opt imism may start to fade – for more informat ion see Strategy: Trumponomics postponed further, 24 March. Tonight , the Fed's Kashkari (voter, dovish) is due to speak.
Today, the euro area indust rial product ion figures for February are due out . January's product ion increased by 0.9% m/m and we est imate a 1.0% monthly increase in February after the very st rong increase in German indust rial product ion.
The German ZEW expectat ions are also due for release today. Like the Sent ix, the ZEW expectat ions should remain on an upward t rend given the st rength of economic data and st rong survey indicators. We believe ZEW expectat ions will rise to 13.7, thus showing lit t le react ion to Art icle 50 being t riggered by the UK and the imminent French elect ion.
In the UK, the most important data release is the CPI inflat ion data for March due out today. We est imate total CPI rose 0.4% m/m in March, implying an unchanged inflat ion rate at 2.3% (CPI core 0.5% m/m and 1.9% y/y).
Selected market news
Fed chief Yellen late evening sent the message that Feds monetary policy task has changed, it is now more a mat ter of get t ing to a neut ral stance. It is no longer necessary to push down the accelerator, but st ill giving some gas. Yellen said she expect s " t he economy t o grow at moderate speed and t hat gradual rat e hikes will t ake us where want t o be".
White House spokesman Sean Spicer's comment s t hat the US might act if the Syrian Government cont inues to use oil barrel bombs against civilians, possibly signalling an increased risk for US intervent ion.
On the Korean peninsula, North Korea crit icised US naval movements calling it a step closer to invasion. The left -oriented South Korean opposit ion leader Moon-Jae, who is leading polls ahead of president ial elect ion on May 9th, also said the US cannot take military act ion without South Korea agreeing.
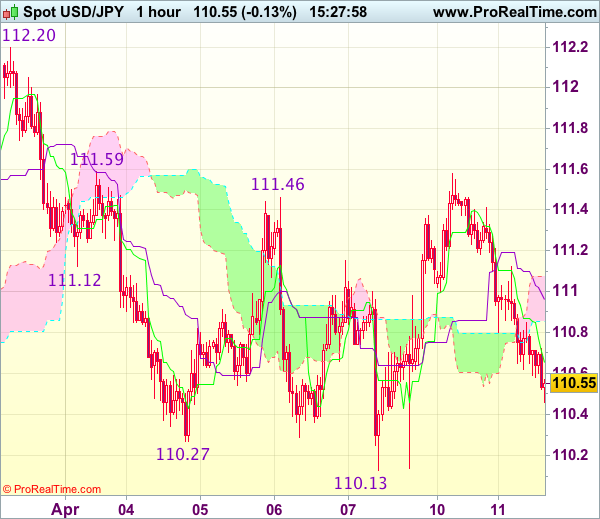
Trade Idea : USD/JPY – Hold long entered at 110.60
USD/JPY - 110.55
Most recent candlesticks pattern : N/A
Trend : Near term down
Tenkan-Sen level : 110.66
Kijun-Sen level : 110.96
Ichimoku cloud top : 111.08
Ichimoku cloud bottom : 110.86
Original strategy :
Bought at 110.60, Target: 111.60, Stop: 110.25
Position : - Long at 110.60
Target : - 111.60
Stop : - 110.25
New strategy :
Hold long entered at 110.60, Target: 111.60, Stop: 110.25
Position : - Long at 110.60
Target : - 111.60
Stop : - 110.25
Although dollar has remained under pressure after retreating sharp from yesterday’s high of 111.58 and marginal weakness from here cannot be ruled out, reckon 110.25-30 would contain downside and bring another rebound later, above 111.10-15 would suggest the retreat from 111.58 has ended, bring test of 111.58-59 resistance, break there would add credence to our view that further consolidation above recent low at 110.11 would be seen and signal the fall from 112.20 has ended, then a stronger rebound to 111.90-00 would follow but said resistance at 112.20 should hold and choppy trading within 110.11-112.20 would continue.
In view of this, we are holding on to our long position entered at 110.60 but one should exit on such rebound. Below 110.25-30 would risk test of said support at 110.11-13 but only break there would confirm medium term decline has resumed for further subsequent fall to 109.80-85 (1.618 times projection of 112.20-111.12 measuring from 111.59), however, price should hold above 109.50-55 (100% projection of 112.20-110.27 measuring from 111.46).