
Sample Category Title
Daily Technical Outlook And Review: EUR/USD, GBP/USD, AUD/USD, USD/JPY, USD/CAD, USD/CHF, DOW 30, GOLD
A note on lower timeframe confirming price action...
Waiting for lower timeframe confirmation is our main tool to confirm strength within higher timeframe zones, and has really been the key to our trading success. It takes a little time to understand the subtle nuances, however, as each trade is never the same, but once you master the rhythm so to speak, you will be saved from countless unnecessary losing trades. The following is a list of what we look for:
- A break/retest of supply or demand dependent on which way you're trading.
- A trendline break/retest.
- Buying/selling tails ... essentially we look for a cluster of very obvious spikes off of lower timeframe support and resistance levels within the higher timeframe zone.
- Candlestick patterns. We tend to only stick with pin bars and engulfing bars as these have proven to be the most effective.
EUR/USD
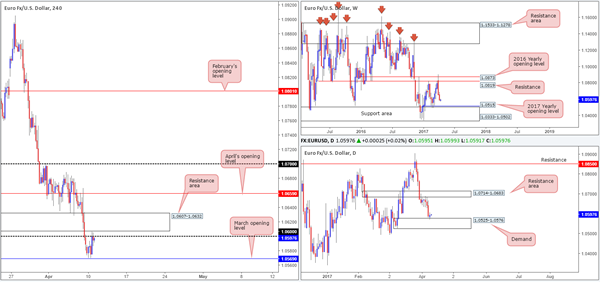
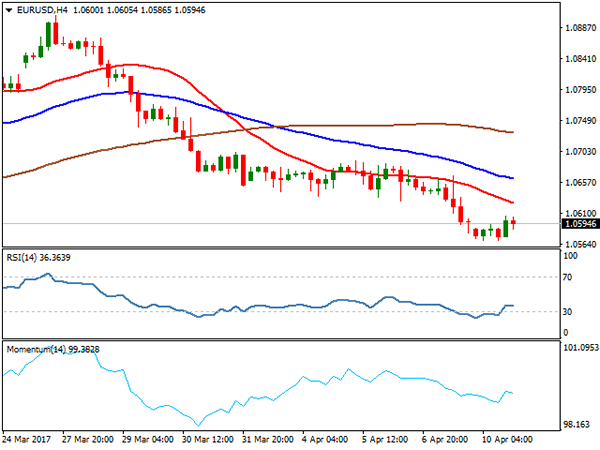
Going into the early hours of yesterday's US segment, the shared currency managed to advance after coming within an inch of connecting with March's opening level at 1.0569. However, despite an earnest attempt, the bulls struggled to surpass the nearby 1.06 handle (bolstered by a H4 resistance area at 1.0607-1.0632).
As highlighted in Monday's report, weekly action shows price extended its pullback from the 2016 yearly opening level at 1.0873. According to this scale, there's little support seen in this market until we reach the 2017 yearly opening level at 1.0515/support area at 1.0333-1.0502. The flipside, of course, is that daily movement recently checked in with demand coming in at 1.0525-1.0576, and indicates that the bulls have space to rally up to a resistance area pegged at 1.0714-1.0683.
Our suggestions: Since we know H4 price is trading beneath 1.06/resistance area at 1.0607-1.0632, and the weekly candles point to further selling, taking a long from the daily demand base at 1.0525-1.0576 is not something our desk is comfortable with. Yet, similarly, taking shorts from the 1.06 neighborhood is also not really a trade we would label high probability, due to March's opening level at 1.0569 sitting only 30 pips away! It doesn't exactly leave a lot of room to play with.
Data points to consider: German ZEW economic statement at 10am. FOMC member Kashkari speaks at 6.45pm GMT+1.
Levels to watch/live orders:
- Buys: Flat (stop loss: N/A).
- Sells: Flat (stop loss: N/A).
GBP/USD
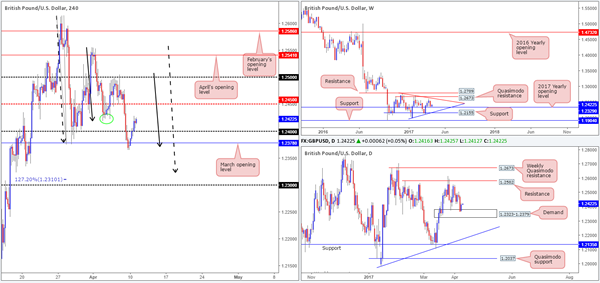
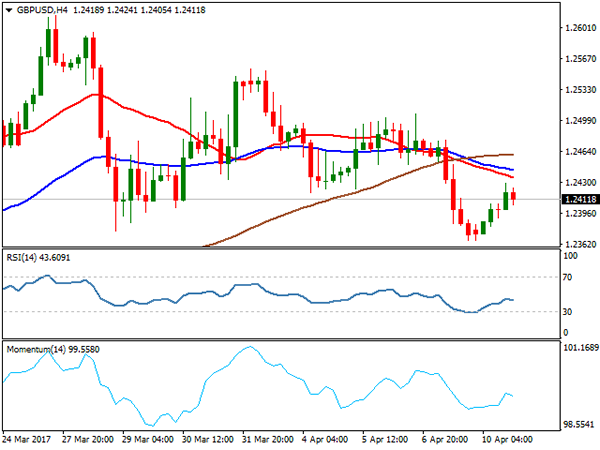
Strengthened by the daily demand at 1.2323-1.2379, the H4 symmetrical AB=CD (filled arrows) completion point taken from the high 1.2556 managed to hold firm, closing price back above March's opening level at 1.2378 and the 1.24 handle. While we are expecting H4 flow to find some resistance around current price, due to immediate structure seen to the left marked with a green circle at the 1.2423ish range, both the weekly and daily charts show room to advance.
Our suggestions: Given the noted structure, longs from the 1.24 handle could be something to consider. Nevertheless, there is a strong possibility that H4 price could fakeout down to 1.2378, so avoid simply placing a pending buy order and hoping for the best! Instead, wait for price to connect with 1.24 and form a lower-timeframe confirming buy signal (see the top of this report). This will help with stop-loss placement and avoiding the dreaded fakeout. The Initial take-profit target from this region is the H4 mid-way resistance marked at 1.2450.
Data points to consider: UK inflation figures at 9.30am. FOMC member Kashkari speaks at 6.45pm GMT+1.
Levels to watch/live orders:
- Buys: 1.24 region ([waiting for a lower-timeframe confirming signal to form before pulling the trigger is advised] stop loss: dependent on where one confirms this area).
- Sells: Flat (stop loss: N/A).
AUD/USD
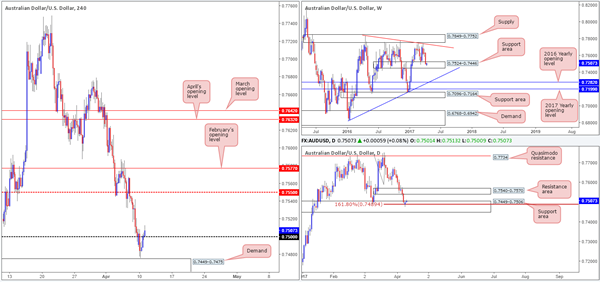
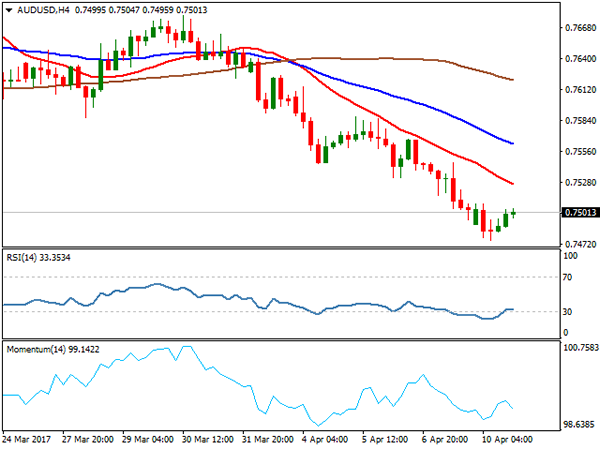
Looking at this market from the top/down today, buyers and sellers remain battling for position within the walls of a weekly support area at 0.7524-0.7446. This zone has provided support and resistance since mid-2016, so we do expect to see some buying pressure eventually emerge from here. Along the same vein, daily price found a pocket of bids around the AB=CD (taken from the high 0.7749) 161.8% Fib ext. at 0.7489, which is housed within a daily support area at 0.7449-0.7506 and the noted weekly support area.
Over on the H4 chart, the candles are seen trading above the 0.75 handle after coming within striking distance of demand at 0.7449-0.7475. Should the bulls manage to hold ground beyond 0.75, this would, in our opinion, further confirm bullish strength from the mentioned higher-timeframe support areas.
Our suggestions: Basically, our team is looking for 0.75 to hold. In the event that price retests this number and prints a reasonably sized H4 bullish candle, we would, dependent on the time of day, look to long from here and target 0.7550 as an initial take-profit zone.
Data points to consider: FOMC member Kashkari speaks at 6.45pm GMT+1.
Levels to watch/live orders:
- Buys: 0.75 region ([waiting for a reasonably sized H4 bullish candle to form before pulling the trigger is advised] stop loss: ideally beyond the trigger candle's tail).
- Sells: Flat (stop loss: N/A).
USD/JPY
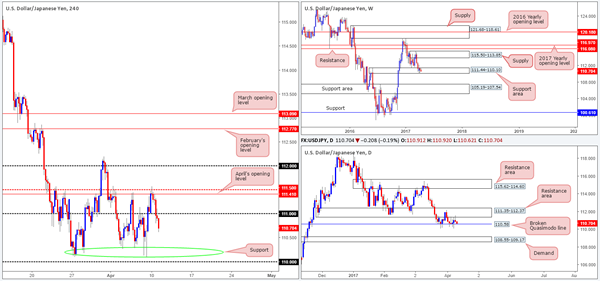
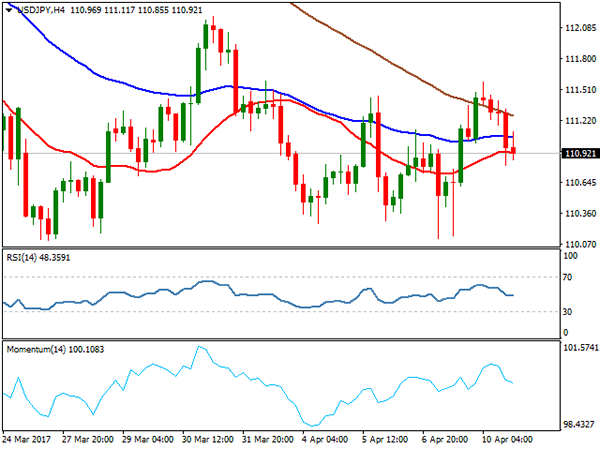
The USD/JPY spent yesterday's sessions fading from April's opening level at 111.41 which, as you can see, is shadowed closely by the H4 mid-way resistance at 111.50. After running through bids at the 111 handle, the H4 chart shows room for price to attack the support area marked with a green circle at the 110.20ish area, followed closely by the 110 handle.
Although we have to agree the bears do look incredibly enthusiastic at the moment, it might be worth noting that there's a weekly support area in play at 111.44-110.10 and also a daily broken Quasimodo line at 110.58! As such, we wouldn't fancy being a seller in this market right now.
Our suggestions: In view of the unit's close proximity to the noted higher-timeframe structures, our desk is going to be looking for longs around the 110 neighborhood today. An ideal scenario would be for the H4 candles to print a reasonably sized bullish rotation off this number. This would be enough evidence to suggest the buyers are making a play, in our opinion.
Data points to consider: FOMC member Kashkari speaks at 6.45pm GMT+1.
Levels to watch/live orders:
- Buys: 110 region ([waiting for a reasonably sized H4 bullish candle to form before pulling the trigger is advised] stop loss: ideally beyond the trigger candle's tail).
- Sells: Flat (stop loss: N/A).
USD/CAD
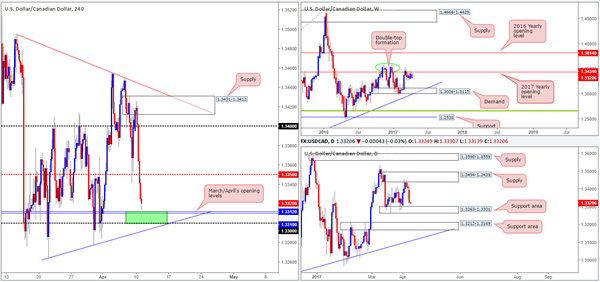
Weighed on heavily by rising oil prices, the USD/CAD fell sharply yesterday. The 1.34 handle and the H4 mid-way support 1.3350 were both taken out, leaving price free to challenge March/April's opening levels at 1.3310/12.
Technically speaking, this recent downside move should not really come as too much of a surprise since weekly price has spent the best part of a month teasing the underside of the 2017 yearly opening level at 1.3434. While the bears do look to be in a strong position at the moment, one may want to take into account that a daily support area at 1.3263-1.3301 has recently elbowed its way into the spotlight! The zone has offered support to this market since the 16th March and could very well do so again.
Our suggestions: March/April's opening levels at 1.3310/12, coupled with the 1.33 handle and nearby daily support area (green H4 zone), could, in our view, hold this market higher this week despite weekly action suggesting lower prices may be on the horizon. However, before we'd look to commit here, we would require a reasonably sized H4 bullish candle to form out of the zone, showing us that the bulls have interest here.
Data points to consider: FOMC member Kashkari speaks at 6.45pm GMT+1.
Levels to watch/live orders:
- Buys: 1.33/1.3312 ([waiting for a reasonably sized H4 bullish candle to form before pulling the trigger is advised] stop loss: ideally beyond the trigger candle's tail).
- Sells: Flat (stop loss: N/A).
USD/CHF
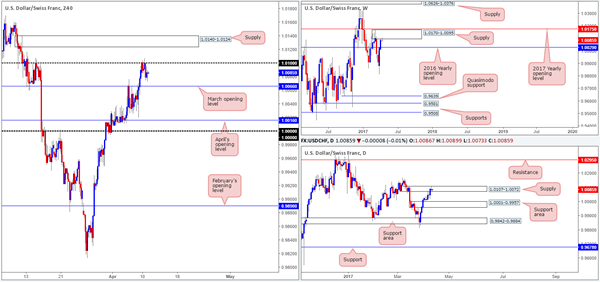
Try as it might, the Swissy failed to muster enough strength to breach the 1.01 handle yesterday. This might have had something to do with the fact that the daily candles are seen trading within the walls of a supply zone penciled in at 1.0107-1.0072, and also weekly price seen teasing the underside of a supply formed at 1.0170-1.0095.
Before traders look to press the sell button, however, we would strongly recommend waiting for March's opening level at 1.0066 to be consumed. Not only would this confirm downside strength, it would also open the path south to April's opening level at 1.0016 and parity (1.0000), which also represents the top edge of a daily support area (the next downside target on that timeframe).
Our suggestions: A decisive H4 close beyond 1.0066, followed up with a retest as resistance and a reasonably sized H4 bearish candle, would, in our estimation, be enough evidence to warrant a short position. Under these circumstances, stops are usually placed a few pips beyond the candle's wick.
Data points to consider: FOMC member Kashkari speaks at 6.45pm GMT+1.
Levels to watch/live orders:
- Buys: Flat (stop loss: N/A).
- Sells: Watch for H4 price to engulf 1.0066 and then look to trade any retest seen thereafter ([waiting for a reasonably sized H4 bearish candle to form following the retest is advised] stop loss: ideally beyond the trigger candle's wick).
DOW 30
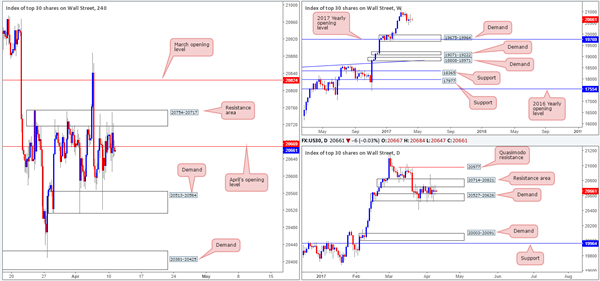
The H4 resistance area at 20754-20717 managed to hold ground yesterday, consequently pushing the index back below April's opening level at 20669. While a short from this number could be something to consider, let's be mindful to the fact that the daily candles have experienced a significant amount of choppy action between demand plugged at 20527-20626 and the resistance area at 20714-20821 since the 22nd March. Although daily action indicates that shorts may be risky, we should remind ourselves that there is little weekly structure seen until the index crosses swords with demand at 19675-19964, which happens to intersect with the 2017 yearly opening level at 19769.
Our suggestions: For those willing to take the risk of selling into a daily demand, a short from 20669 does have the backing of weekly flow at the moment. Waiting for a H4 bearish candle to form off 20669 is advised before pressing the sell button. That way stops can be placed beyond the rejection candle's wick.
Data points to consider: FOMC member Kashkari speaks at 6.45pm GMT+1.
Levels to watch/live orders:
- Buys: Flat (stop loss: N/A).
- Sells: 20669 level ([waiting for a reasonably sized H4 bearish candle to form before pulling the trigger is advised] stop loss: ideally beyond the trigger candle's wick).
GOLD
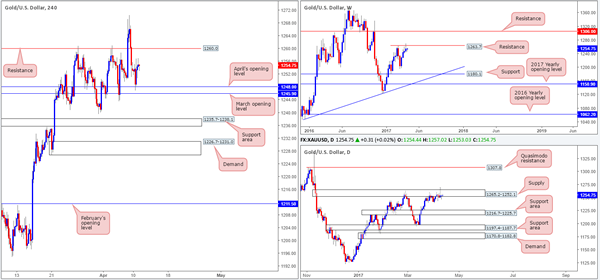
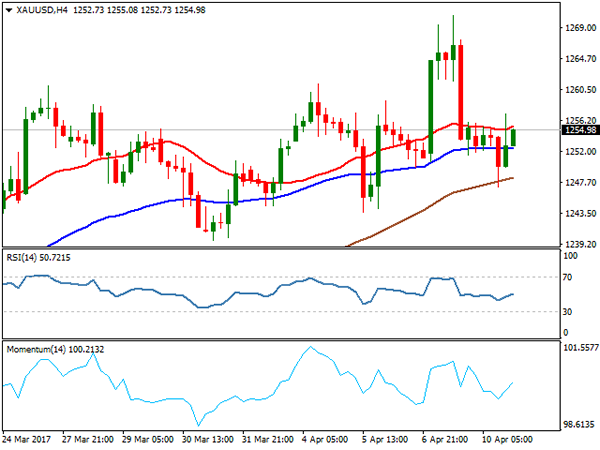
As anticipated, the yellow metal bounced nicely from between April and March's opening lines at 1245.9/1248.0 and rallied to a high of 1257.0 on the day. With H4 price now seen meandering between the noted monthly levels and resistance planted at 1260.0, where does one step from here? Well, with weekly price recently crossing swords with resistance at 1263.7, and daily movement trading within supply lodged at 1265.2-1252.1, the path of least resistance is south.
Our suggestions: Based on the above notes, we see two possible scenarios playing out:
Wait and see if H4 price tests resistance at 1260.0. In the event that it holds ground and forms a reasonably sized H4 bearish candle, a short from here is valid.
Assuming that the monthly levels at 1245.9/1248.0 are taken out, the next area on the hit list is a support zone formed at 1235.7-1238.1. Should price retest the underside of these levels and print a reasonably sized H4 bearish candle, a short from here is also valid.
Levels to watch/live orders:
- Buys: Flat (stop loss: N/A).
- Sells: 1260.0 region ([waiting for a reasonably sized H4 bearish candle to form before pulling the trigger is advised] stop loss: ideally beyond the trigger candle's wick). Watch for H4 price to engulf 1245.9/1248.0 and then look to trade any retest seen thereafter ([waiting for a reasonably sized H4 bearish candle to form following the retest is advised] stop loss: ideally beyond the trigger candle's wick).
European Open Briefing: Most Asian Stock Markets Declined Overnight
Global Markets:
- Asian stock markets: Nikkei down 0.65 %, Shanghai Composite fell 0.35 %, Hang Seng declined 0.90 %, ASX 200 gained 0.40 %
- Commodities: Gold at $1258 (+0.30 %), Silver at $17.95 (+0.15 %), WTI Oil at $63.10 (+0.10 %), Brent Oil at $65.08 (+0.15 %)
- Rates: US 10 year yield at 2.34, UK 10 year yield at 1.08, German 10 year yield at 0.21
News & Data:
- Australia NAB Business Conditions Mar: 14 (prev 9)
- Australia NAB Business Confidence Mar: 6 (prev 7)
- Australia ANZ Roy Morgan Consumer Confidence 9-Apr: 114.8 (prev 111.1)
- UK BRC Sales Like-For-Like (YoY) Mar: -1.0% (exp -0.3%; prev -0.4%)
- PBoC Fixes USDCNY Reference Rate At 6.8957 (prev fix 6.9042 prev close 6.9050)
- Global stocks pressured, safe assets up on rising geopolitical risks – RTRS
- Oil hits five-week top on geopolitical tensions, strong demand – RTRS
Markets Update:
Most Asian stock markets declined overnight, while safe havens were once again in demand. The Japanese Yen extended gains as USD/JPY fell from 111.00 to a low of 110.58. Meanwhile, Gold recovered to 1257. Geopolitical tensions are keeping traders nervous, and there is little risk appetite in the market. Gold should therefore remain in demand and retest the recent high at 1270 soon.
The commodity currencies are under pressure as well. The Australian Dollar managed to recover slightly yesterday, but reversed those gains overnight as it fell back to 0.7495. Worse than expected NAB business confidence weighed on the AUD too. Following the break below 0.75 support, a test of 0.74 seems likely in the short-term.
The British Pound recovered a bit against the Dollar. The UK will release its inflation numbers for March today, and the traders are anticipating a higher number. Intraday, resistance is seen at 1.2450 and 1.25, while decent support is noted in the area between 1.2350 and 1.2370.
Upcoming Events:
- 09:30 GMT – UK CPI
- 10:00 GMT – German ZEW Economic Sentiment
- 10:00 GMT – Euro Zone Industrial Production
- 10:00 GMT – Euro Zone ZEW Economic Sentiment
- 15:00 GMT – US JOLTs Job Openings
- 18:45 GMT – FOMC Member Kashkari speaks
Elliott Wave View: Crude Oil (CL_F) Waiting For Pullback
Short term Elliott Wave view in Crude Oil (CL_F) suggests that cycle from 3/22 low (47.01) is unfolding as a double three Elliott wave structure where Minute wave ((w)) ended at 50.85 and Minute wave ((x)) ended at 49.88. Minute wave ((y)) is in progress and the internal is unfolding also as a double three Elliott wave structure where Minutte wave (w) ended at 52.94 and Minutte wave (x) pullback ended at 51.49. Near term, while pullbacks stay above 51.51, focus is on 53.71 – 54.61 area to complete Minor wave 1 and end cycle from 3/22 low, then Crude Oil should pullback in Minor wave 2 to correct cycle from 3/22 low before the rally resumes. We don’t like selling CL_F and expect buyers to appear once Minor wave 2 pullback is complete in 3, 7, or 11 swing for an extension higher.
Market Morning Briefing: Nothing Changed In The Global Scenario
STOCKS
Dow (20658.02, +0.01%) is almost stable and in a sideways consolidation mode as expected. Some steady movement in the 20780-20500 region is possible in the next couple of sessions before breaking on either side.
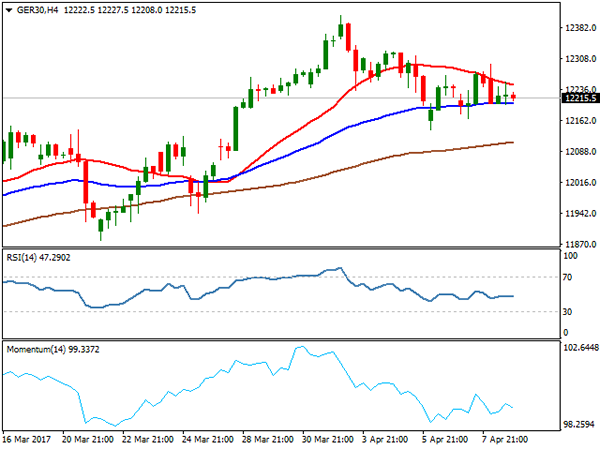
Dax (12200.52, -0.20%) is testing support near 12200 or could test lower support near 12100 from where an immediate bounce is expected in the coming sessions. But on a medium term some sideways movement could be expected as there is not much scope on the upside beyond 12400 just now. A dip below 12100, could take it towards 12000 or lower before recovering again.
Asia-Pac is weak with the Chinese and Japanese stocks looking weak.
Shanghai (3262.10, -0.22%) came off from daily resistance near 3280 and while that holds, we could see a fall towards 3250 again before bouncing back towards 3300 in the medium term.
Nikkei (18708.49, -0.48%) has not been able to sustain at higher levels and may re-test 18600 or lower in the near term. A sustained movement below 18600, if seen, could eventually lead to a fall in the index for the medium term.
Nifty (9181.45, -0.18%) could fall to 9130 today before possibly bouncing back again from there in the coming sessions.
COMMODITIES
Gold (1251) was almost unchanged and it keep trading in the narrow range of 1237-1263, which may continue for some days. Global cues are in favor of gold as the break below 100.50 for Dollar Index (101) could be resulted in good gains for bullion. We have been expecting 1237 for gold to hold for some time and gradual buying at lower levels can’t be ruled out as buyers are taking every dip as a further opportunity for buying.
Silver (17.95) has tested its support at 17.70 and settled marginally higher. Immediate trading range could be 17.80-18.30 but a close below 17.70 could open up 17.50 as well. Overall silver looks weak but we need to wait for confirmation for immediate directional clarity.
Copper (2.61) has been stuck in the range of 2.55-2.70 with no visible intent for a breakout. Range bound trading may go on for some time. In the medium term 2.55-57 are going to be a strong support now but a close below that could open up 2.50 and 2.45 levels respectively.
Brent (56.01) and WTI (53.07) had closed above their respective resistances, which has opened up higher levels of 57 and 54. Immediate trading range for Brent and WTI could be 54-56.40 and 51-53 and considering the short term overbought state, possibility of a near term correction can’t be ignored.
In case of any surplus in U.S crude inventories, the upside in the near term may be limited to 56.40 and 53. The trend is bullish in the near term time frame and any corrective fall may add fresh longs at the lower levels.
FOREX
Nothing changed in the global scenario as the political tension over Syria and North Korea lingers. Dollar stays strong against the majors and Rupee may conditionally weaken a bit more.
Dollar Index (101.05) is stalling near our resistance of 101.55-75 and only a successful break above the resistance can open up further upside. In case of a failure here, a gradual decline towards 100.00 can be seen. Prefer to watch the price action here for clarity at this point.
Euro (1.0585) is timidly holding above the support of 1.0550 till now but no strength is visible yet. The persistent decline in the German-US yield spreads (check Interest Rates section) keep the currency weak and if 1.0550 breaks, the decline may extend to 1.0450.
Dollar Yen (110.65) has been rejected exactly from our resistance of 111.60. Unless an immediate break above 111.60 is seen, the risk of a break below the support of 111.10-109.90 may be back. No clear bias in the near term though the trend remains down in the medium term.
Pound (1.2419) has bounced back from our support of 1.2350, increasing the chances of further sideways movement in the broader range of 1.2350-1.2600. Immediate resistance comes at 1.2465 which may be tested soon.
Aussie (0.7495) sustains the lower levels with no apparent strength. Our downside target of 0.7450 remains unchanged with even 0.7375 a possibility.
Dollar-Rupee (64.56) has made a high of 64.5750 yesterday, very close to our immediate target of 64.60. As the pair trades at 64.72 in the NDF at this moment, a successful break above 64.60-70 in the onshore market may push it higher towards the major resistance of 65.10-25 in the next few days.
INTEREST RATES
The US yields do not look as if they are willing to move up just now contrary to our expectation of a rise mentioned yesterday. Some consolidation near current levels is possible for a few more sessions before moving up sharply. The yields have again moved down to re-test support levels and may not have much scope on the upside just now.
The 5YR (1.88%), 10Yr (2.35%) and the 30YR (2.98%) are down from 1.91%, 2.38% and 2.98% respectively.
The German-US 2Yr (-2.10%) and 10Yr (-2.14%) have moved up slightly but overall looks bearish over the medium term. A slight rise could be expected over today and tomorrow followed by a dip back toward current levels or even lower.
The 10Yr GOI (7.0569%) could rise towards 7.15-7.20% in the next 4-5 sessions before dipping towards 7%.
EUR/GBP Daily Outlook
Daily Pivots: (S1) 0.8520; (P) 0.8536; (R1) 0.8549; More...
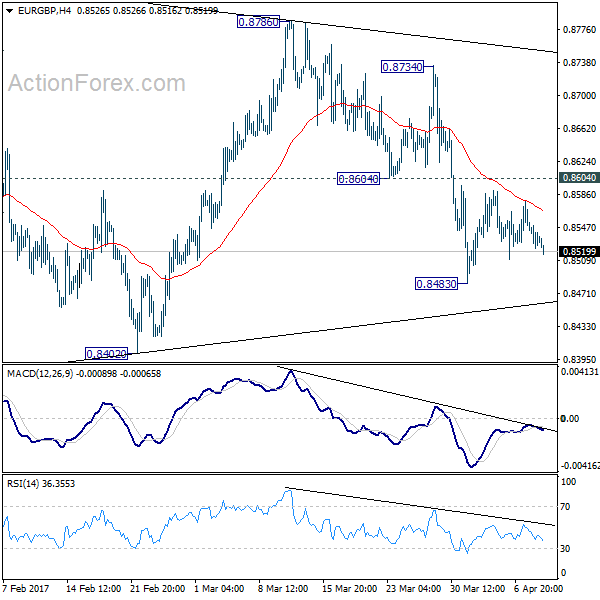
EUR/GBP dips mildly today but stays above 0.8483 temporary low. Intraday bias remains neutral at this point. As noted before, decline from 0.8786 could be developing into the third leg of the whole corrective pattern from 0.9304. And hence, deeper fall is expected ahead. On the downside, break of 0.8483 will turn bias to the downside for 0.8402 support first. Decisive break there should confirm our bearish view and target 0.8303 and below. As fall from 0.9304 is viewed as a corrective move, we'd expect strong support at 0.8116/20 cluster support to contain downside and bring rebound. On the upside, above 0.8604 minor resistance will delay the bearish case. That is, one more recovery will be seen to complete a five wave triangle pattern fro 0.8303 before completion.
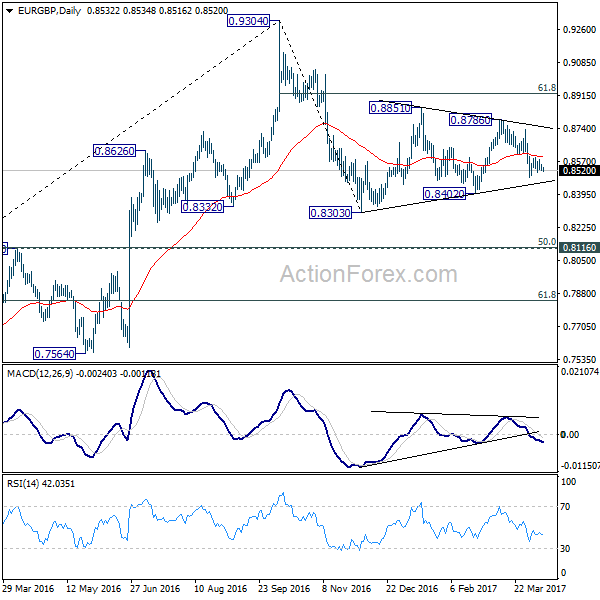
In the bigger picture, price actions from 0.9304 are viewed as a medium term corrective pattern. Such decline is likely ready to resume and should make a new low below 0.8303. At this point, we'd expect strong support from 0.8116 cluster support (50% retracement of 0.6935 to 0.9304 at 0.8120) to contain downside. Rise from 0.6935 (2015 low) will resume at a later stage to 0.9799 (2008 high). However, sustained break of 0.8116 could bring deeper decline to next key support level at 0.7564 before the correction completes.
Euro Sees Renewed Selling, British Pound Resilience to be Tested by UK CPI
Some selling pressure is seen in Euro in Asian session as the common currency is dipping through Monday's low against Yen and Sterling. French election in April and May is the main focus for the common currency for now. But it should be noted that instead of political uncertainties, Euro's current selloff is more due to adjustments on ECB expectations. That is, there is little chance for ECB to raise interest rate soon in spite of the "hawkish twist" back in March. There are talks that Euro could be given a lift after French election but that would likely be just temporary. The situation of the British Pound is indeed quite different as Sterling has survived news of Brexit and stayed firm. BoE outlook is the main support for the Pound as Kristin Forbes voted for a rate hike back in March. And that was accompanied by stronger than expected February headline inflation reading. UK CPI release today will be importantly to decide whether Sterling can hold on to its resilience.
ECB Draghi: 2016 was a good year
ECB President Mario Draghi said in the central bank's annual report that 2016 "ended with the economy on its firmest footing since the crisis," even though the year began "shrouded in economic uncertainty". The report noted that the scaling back of asset purchase from EUR 80b per month to EUR 60b "reflected the success of our actions earlier in the year: growing confidence in the euro area economy and disappearing deflation risks". However, overall, the Eurozone economy's recovery is still dependent on massive support from the central bank. And the report also reiterated the calls on governments' effort on fiscal reforms.
Fed Yellen: Policy stance closer to neutral
Dollar fails to extend last week's rally while stocks and yields also lost some momentum. Fed chair Janet Yellen said yesterday that the central bank has shifted its focus the economy is closing to the targets of inflation and employment. She said that before, Fed had to "press down on the gas pedal trying to give the economy all of the oomph that we possibly could." But now, Fed is trying to "give it some gas, but not so much that we're pushing down hard on the accelerator." And, the "appropriate stance of policy" is now closer to "neutral". But she also emphasized not be to "ahead" nor "behind" the curve. Or, Fed would be in a position to "have to raise rates rapidly, which could conceivably cause a recession".
Australia business conditions improved, confidence dropped
Australia NAB business confidence rose 5 pts to 14 in March, hitting the highest level since the global financial crisis. But business confidence dropped 1 pt to 6. NAB noted that "the bounce in business conditions this month came as a bit of a surprise, especially the big improvement in Queensland in light of the likely disruptions from Cyclone Debbie in late March." And, "one possibility is that 'Debbie' is having the unexpected effect of overstating conditions in March given that the cyclone coincided with a lower response rate from firms in Northern Queensland.". But overall, "conditions have improved almost across the board to levels that suggest a strong economy in the near term."
On the data front...
UK BRC retail sales monitor dropped -1.0% yoy in March. Australia NAB business confidence dropped to 6 in March. UK inflation data will be a main focus for today as CPI, RPI and PPI will be released. Germany will release ZEW economic sentiment while Eurozone will release industrial production. No important economic release is scheduled for US session.
EUR/GBP Daily Outlook
Daily Pivots: (S1) 0.8520; (P) 0.8536; (R1) 0.8549; More...
EUR/GBP dips mildly today but stays above 0.8483 temporary low. Intraday bias remains neutral at this point. As noted before, decline from 0.8786 could be developing into the third leg of the whole corrective pattern from 0.9304. And hence, deeper fall is expected ahead. On the downside, break of 0.8483 will turn bias to the downside for 0.8402 support first. Decisive break there should confirm our bearish view and target 0.8303 and below. As fall from 0.9304 is viewed as a corrective move, we'd expect strong support at 0.8116/20 cluster support to contain downside and bring rebound. On the upside, above 0.8604 minor resistance will delay the bearish case. That is, one more recovery will be seen to complete a five wave triangle pattern fro 0.8303 before completion.
In the bigger picture, price actions from 0.9304 are viewed as a medium term corrective pattern. Such decline is likely ready to resume and should make a new low below 0.8303. At this point, we'd expect strong support from 0.8116 cluster support (50% retracement of 0.6935 to 0.9304 at 0.8120) to contain downside. Rise from 0.6935 (2015 low) will resume at a later stage to 0.9799 (2008 high). However, sustained break of 0.8116 could bring deeper decline to next key support level at 0.7564 before the correction completes.
Economic Indicators Update
| GMT | Ccy | Events | Actual | Forecast | Previous | Revised |
|---|---|---|---|---|---|---|
| 23:01 | GBP | BRC Retail Sales Monitor Y/Y Mar | -1.00% | -0.50% | -0.40% | |
| 1:30 | AUD | NAB Business Confidence Mar | 6 | 7 | ||
| 6:00 | JPY | Machine Tool Orders Y/Y Mar P | 9.10% | |||
| 8:30 | GBP | CPI M/M Mar | 0.30% | 0.70% | ||
| 8:30 | GBP | CPI Y/Y Mar | 2.30% | 2.30% | ||
| 8:30 | GBP | Core CPI Y/Y Mar | 1.90% | 2.00% | ||
| 8:30 | GBP | RPI M/M Mar | 0.40% | 1.10% | ||
| 8:30 | GBP | RPI Y/Y Mar | 3.20% | 3.20% | ||
| 8:30 | GBP | PPI Input M/M Mar | -0.10% | -0.40% | ||
| 8:30 | GBP | PPI Input Y/Y Mar | 17.00% | 19.10% | ||
| 8:30 | GBP | PPI Output M/M Mar | 0.10% | 0.20% | ||
| 8:30 | GBP | PPI Output Y/Y Mar | 3.40% | 3.70% | ||
| 8:30 | GBP | PPI Output Core M/M Mar | 0.20% | 0.00% | ||
| 8:30 | GBP | PPI Output Core Y/Y Mar | 2.50% | 2.40% | ||
| 8:30 | GBP | House Price Index Y/Y Feb | 6.10% | 6.20% | ||
| 9:00 | EUR | Eurozone Industrial Production M/M Feb | 0.10% | 0.90% | ||
| 9:00 | EUR | German ZEW (Economic Sentiment) Apr | 14.8 | 12.8 | ||
| 9:00 | EUR | German ZEW (Current Situation) Apr | 77.5 | 77.3 | ||
| 9:00 | EUR | Eurozone ZEW (Economic Sentiment) Apr | 25 | 25.6 |
Daily Technical Analysis: EURUSD, GBPUSD, USDJPY, USDCHF
EURUSD
The EURUSD was indecisive yesterday. The bias is neutral in nearest term. Overall price is still in a bearish phase since the false break above 1.0873 key resistance two weeks ago but as you can see on my H4 chart below price respecting a trend line support which is a good place to buy with a tight stop loss as a clear break below the trend line support and 1.0570 area would expose 1.0500 region. Immediate resistance is seen around 1.0620. A clear break above that area could trigger further bullish pressure testing 1.0700 region. On the downside, a clear break and daily close below 1.0500 would expose 1.0350 area. Overall I remain neutral.
GBPUSD
The GBPUSD failed to continue its bearish momentum yesterday topped at 1.2428. The bias is neutral in nearest term. The bearish outlook after broke below the triangle (see my H1 chart below) remains valid with 1.2450 as key resistance (H1 EMA 200). A clear break above that area would nullify the bearish scenario testing 1.2500 region. Immediate support is seen around 1.2375. A clear break below that area would expose 1.2300 region. Overall I remain neutral.
USDJPY
The USDJPY attempted to push higher yesterday topped at 111.57 but closed lower back below 111.30 key resistance and hit 110.62 earlier today in Asian session. The bias is neutral in nearest term probably with a little bearish bias testing 110.10 key support which is a good place to buy with a tight stop loss as a clear break and daily close below that area could trigger further bearish pressure testing 108.50 region. On the upside, 111.30 remains a key resistance. Any sustained movement above that level could trigger further bullish pressure testing 112.00 or higher.
USDCHF
The USDCHF was indecisive yesterday. The bias is neutral in nearest term but overall price is still in a bullish phase with 1.0020 – 1.0060 as key support area targeting 1.0170 area. A clear break and daily close above that area would expose 1.0250 or higher. On the downside, a clear break and daily close back below 1.0020 would be a threat to the bullish phase testing 0.9970 region. Overall I remain neutral.
Foreign Exchange Market Commentary: EUR/USD, USD/JPY, GBP/USD,AUDUSD, GBPCAD, GOLD, WTI CRUDE, DJIA, FTSE 100, DAX
.
EUR/USD
The pair traded within narrow range during the most of European session and holding above new marginally lower one-month low at 1.0570. Lack of data on Monday kept the single currency against dollar in narrow consolidation after Friday's strong fall when the pair ended trading down 0.43%.Strong bearish sentiment, established in last three days of the past week and boosted by fresh geopolitical tensions in the Middle East after US army attacked the airbase of Syrian army, failed to extend bear-leg from 1.0689, Apr 05 lower top, despite long bearish candle of Friday that was expected to produce stronger downside pressure. In addition, the greenback paused fresh rally that was sparked after Friday's attack on Syria and mixed jobs data last Friday.The euro briefly probed below key near-term support at 1.0584, base of daily Ichimoku cloud, but was unable to hold losses below cloud and generate stronger bearish signal.Daily cloud base now acts as solid support for recovery that commenced in early American session, signalled by reversal of daily chart slow stochastic after being deeply oversold.However, corrective attempts during mid / late American session remained capped by daily cloud top at 1.0611, as investors were awaiting speech from Fed Chair Janet Yellen to get more information about US policy, the timing of Fed's next interest rates hike and to possibly learn about Fed's plan to start shrinking its massive $4.5 trillion balance sheet.Technical studies are in negative mode on daily chart and maintain downside risk, which would be accelerated on firm break below daily Ichimoku cloud.
Resistance: 1.0611; 1.0622; 1.0668; 1.0700
Support: 1.0584; 1.0570; 1.0525; 1.0494
USD/JPY
The USDJPY pair extended bounce from temporary base at 110.00 zone, after last Friday's repeated downside rejection and subsequent bounce that managed to close briefly above 111.00 handle and sideline immediate downside risk. Recovery extension above daily Tenkan-sen line at 111.16 was seen as another supportive factor for stronger recovery, on daily close above the indicator which would then turn to solid support for further recovery. Probes above Tenkan-sen pivot remained capped by falling 20SMA at 111.60 in late Asian trading on Monday and the pair remained at the back foot during European and American session. Formation of double-bottom at 110.00 that is bullish signal, was expected to support scenario of stronger correction after multiple downside rejections at 110.00 zone.So far, the pair was unable to sustain break above Tenkan-sen barrier, diminishing hopes of stronger recovery that requires confirmation on firm break above daily Tenkan-sen and weekly Ichimoku cloud top at 111.36.While these pivotal barriers stay intact, prospects for extended correction will be limited.In such scenario, the pair may hold in extended consolidation between 110 base and weekly cloud top, before establishing in fresh direction, with mixed technicals on lower timeframes supporting the notion.Rising geopolitical tensions that increase demand for safe-haven assets may offer support to Japanese yen for renewed attack at 110 trigger and spark fresh extension of bear-leg from 118.66, Dec 15 peak that is supported by firm bearish setup of daily studies.
Resistance: 111.16; 111.36; 111.60; 112.00
Support: 110.80; 110.53; 110.12; 109.90
GBP/USD
The GBPUSD currency pair recovered a half of Friday's 1.2477/1.2365 fall when it ended trading with 0.9% loss for the day. Strong bearish acceleration was contained by daily Kijun-sen line at 1.2362, which guards another strong support at 1.2346, daily Ichimoku cloud base.Despite expectations that long red daily candle that was formed on Friday's fall will continue to weigh and trigger fresh extension of bear-leg from 1.2555 lower top, the pair managed to stabilize above daily Kijun-sen support and bounce back.Recovery was capped by the top of narrowing daily Ichimoku cloud at 1.2426, which marks solid barrier, together with broken Fibonacci 38.2% retracement of 1.2108/1.2615, 14/27 Mar rally, that is expected ideally limit recovery attempts.Daily MA's in bearish setup and rising bearish momentum, keep negative scenario in play, as daily cloud is twisting at the beginning of next week and may support fresh downside action.However, emerging out of daily cloud is seen as minimum requirement to signal fresh near-term direction.The upper trigger above daily cloud top is daily Tenkan-sen line at 1.2460, regain of which would be seen as strong bullish signal.Traders are looking for Tuesday's release of UK inflation data on Tuesday, for fresh signals.Inflation is holding above projected levels that are seen as good signal for British economy.
Annualized CPI is forecasted at 2.3% in Feb and release at/above this level would be supportive for sterling. On the other side, pound may come under increased pressure on release below consensus that may also cool down the idea of rate hike towards the end of the year.
Resistance: 1.2426; 1.2460; 1.2477; 1.2505
Support: 1.2400; 1.2365; 1.2346; 1.2300
AUDUSD
The Aussie dollar extended strong losses on last Thu/Fri that broke below strong supports at 0.7550 (200SMA); 0.7523 (Fibonacci 38.2% retracement of broader 0.7158/0.7749 rally) and 0.7512 (100SMA) and eventually broke below key short-term support at 0.7489, Mar 09 low, confirming full retracement of 0.7489/0.7747 upleg.The pair hit fresh low at 0.7475, the lowest since Jan 17, above which, near-term consolidation is under way. Firmly bearish technical studies on daily chart favour further weakness, which needs bearish signal on close below 0.7489 pivot. Such scenario would trigger fresh bearish acceleration towards next key support at 0.7449 (base of thick daily Ichimoku cloud) and look for another strong bearish signal on break below this support. Meantime, the pair could extend narrow consolidation above fresh low at 0.7475, which was so far capped by initial barrier – 100SMA.Extended upticks should not exceed next strong barrier, offered by 200SMA, as break here would generate fresh bullish signal and sideline immediate downside threats.
Resistance: 0.7512; 0.7526; 0.7550; 0.7576
Support: 0.7489; 0.7475; 0.7449; 0.7400
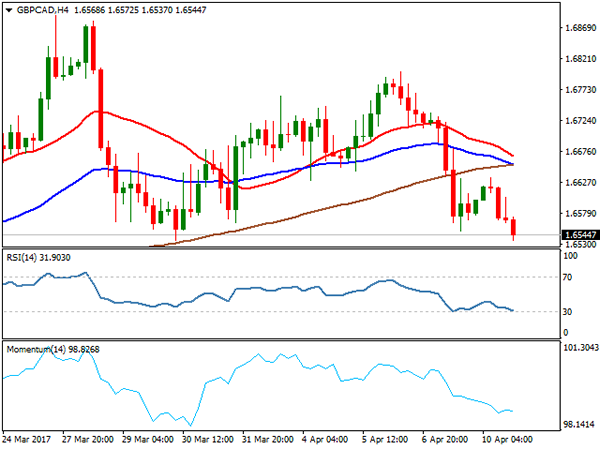
GBPCAD
The GBPCAD cross remained in red on Monday and extended strong bearish acceleration from last Thursday's high at 1.6800, to retest former low of Mar 30 at 1.6535. The pair is maintaining bearish pressure that increased on break below 200SMA (1.6694) and 20SMA (1.6610) which now acts as initial resistance and capped recovery attempts during early hours of the American session.Upbeat numbers in Canada's Housing Starts (253.7K in Mar vs forecasted 216K and 214.3K in Feb) helped Canadian dollar to firm further against its British counterpart.Sustained break below 1.6535 pivot is needed to complete Failure Swing pattern on daily chart and generate strong bearish signal for fresh downside acceleration, as support at 1.6535 also marks 61.8% Fibonacci retracement of 1.6311/1.6888 ( Mar 16/27 rally) and acts as strong downside trigger.Broken daily Kijun-sen line at 1.6589 which so far managed to hold upticks, marks immediate resistance, ahead of upper pivots at 1.6668 (daily Tenkan-sen) and 1.6694 (200SMA), break of which would generate fresh bullish signal and turn focus higher.
Resistance: 1.6589; 1.6635; 1.6668; 1.6694
Support: 1.6535; 1.6500; 1.6448; 1.6400
GOLD
Spot Gold slipped further on Monday and hit low at $1247, following last Friday's strong spike to $1270, fresh five-month high and subsequent quick pullback that marked strong upside rejection and left daily candle with long upper wick on Friday. Another false break above key barriers at $1257 (200SMA) and former top of Feb 27 at $1263, weakened near-term structure and introduced fresh downside risk.As Friday's daily candle continues to weigh, gold price lost its initial footstep at $1250 zone and shifted risk lower. Fresh bears off $1270 peak may extend to $ 1243 (rising daily 20SMA / Fibonacci 38.2% retracement of $1195/$1270 rally on repeated close below 200SMA and weak studies on 1 & 4-hour charts.The yellow metal came under pressure on expectations that US Federal Reserve will press ahead with interest rate hikes that counterweighs rising geopolitical concerns over Syri and North Korea that should be boosting demand for safe-haven gold.Gold is expected to struggle at the upside under current circumstances, however, downside attempts should be also limited. Ideally, dips should be contained at $1243 zone in order to avoid deeper pullback on violation of the latter support that may also unmask another key support at $1234 (top of thick daily Ichimoku cloud).On the other side, return above 200SMA would improve the sentiment.Spot Gold ended Monday's trading in long-legged Doji candle that signals strong near-term indecision.
Resistance: 1255; 1257; 1263; 1270
Support: 1253; 1250; 1247; 1243
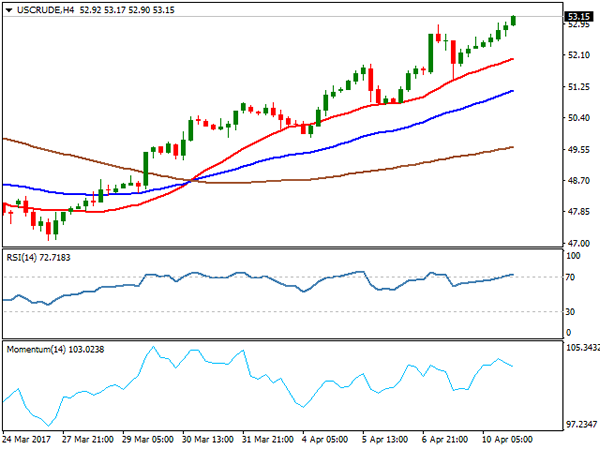
WTI CRUDE OIL
WTI oil price remained in steep ascend and rose above $53.00 per barrel on Monday, in the third consecutive bullish day. Oil price regained support on hopes of OPEC and non-OPEC oil producers will reach agreement on extension of current program for reduction of oil output that will ease pressure from global oversupply and boost oil prices.Last week's break above psychological $50.00 per barrel level was initial bullish signal, with oil price being boosted by rising geopolitical tensions over North Korea and Syria that also raised tensions between USA and Russia. Such environment is seen ideal for oil prices to rise strongly.WTI contract rose by nearly S1 on Monday, on extension that penetrated into thin daily Ichimoku cloud and broke above barrier at $53.13 (Fibonacci 76.4% retracement of $55.01/$47.06 descend). Fresh bullish acceleration is looking for break above daily cloud (cloud top lies at $53.44) to get fresh bullish signal for acceleration towards key short-term barriers at $55.00 zone (recovery peaks of Jan/Feb 2017).The price is supported by firmly bullish daily and weekly technicals, as well as growing geopolitical tensions. Break above daily Ichimoku cloud would open %53.78 (Mar 07 high) and levels above $54.00, r=en-route towards $55 zone targets.Shallow corrections are seen interrupting rallies, with broken Fibonacci 61.8% barrier, expected to ideally contain and guard 55SMA support at $51.64.
Resistance: 53.44; 53.78; 54.50; 55.00
Support: 52.29; 51.97; 51.64; 51.49
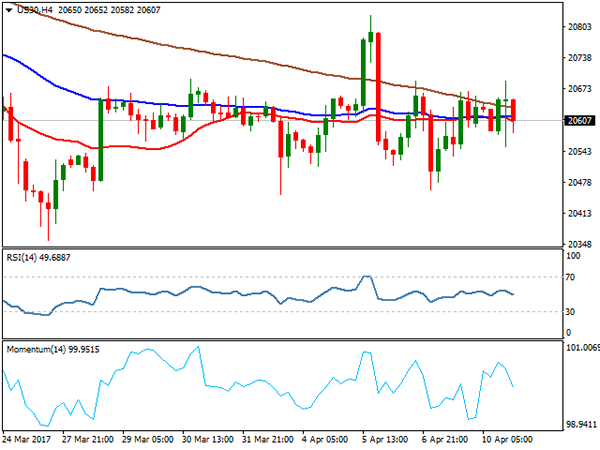
DJIA
Dow ended another day in directionless mode, as Monday's trading was shaped in Doji candle. Choppy Monday's session has ended with slight bullish alignment on gains of energy stocks that offset losses in financial stocks. Quiet trading in past two days is seen on stock markets awaiting corporate quarterly earnings, due later this week. Also, choppy trading was caused by rising geopolitical tensions as trading starts to slow on holiday-shortened week.No significant signals seen from technical studies, as daily chart shows mixed signals on conflicting indicators, however, prevailing bullish bias was dented by recent penetration into daily Ichimoku cloud that was underpinning bullish action since Nov 2016.Stronger bullish signals could be expected by break above daily Kijun-sen line at 20692 and extension above last week's spike-high at 20827.Conversely, weakness through last week's lows at 20460/20450 would soften the structure further and risk fresh weakness.
Resistance: 20659; 20692; 20750; 20827
Support: 20551;20500; 20450; 20400
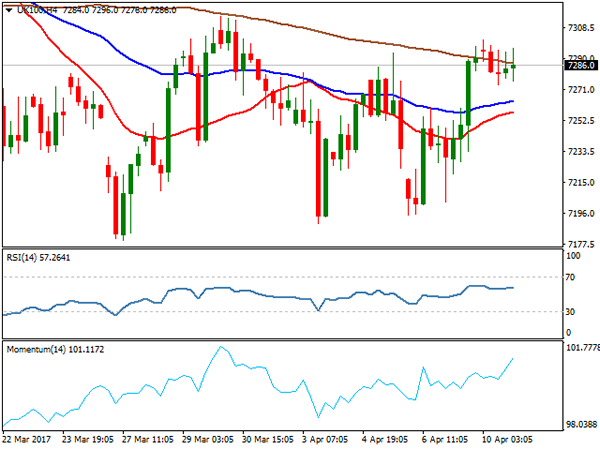
FTSE 100
FTSE index stayed under fresh recovery high at 7301 on Monday, ending daily trading in red at 7286, after previous two day's strong rally. Growing downside risk that was seen on penetration into daily Ichimoku cloud last week, has been neutralized on strong rally that emerged above rising daily cloud that continued to underpin the advance. Weaker pound also helped the index to recover and shift near-term focus higher.The price is looking key n=barriers at 7311/15 (daily Kijun-sen line / recovery top of Mar 30) that also marks the top of near-term congestion between 7179 and 7315 and 50% retracement of 7444/7179 pullback.Sustained break above 7315 is needed to generate firmer bullish signal for fresh recovery towards targets at 7343 and 7381.Daily Tenkan-sen and daily cloud top at 7252/41 are expected to hold extended downticks.
Resistance: 7311; 7315; 7343; 7381
Support: 7280; 7252; 7241; 7203
DAX
DAX closed in red on Monday after two bullish days at the end of last week, but series of higher g=highs and higher lows formed near-term bull-leg from 12141 (Apr 06 low). The action was contained and remains underpinned by rising 20SMA (currently at 12151). Overall bullish structure on the daily chart is supportive for further recovery, while 20SMA underpins. However, firm break above daily Tenkan-sen at 12275 is needed to v=confirm recovery and open next target at 12307 (Fibonacci 61.8% retracement). On the downside, Monday's low at 12200 marks initial support, followed by pivots at 12151 (20SMA) and 12144 / 41 (daily Kijun-sen / Apr 6 trough), loss of which would generate stronger bearish signal.
Resistance: 12275l 12307; 12346; 12410
Support: 12200 12167; 12141; 12070;
Balancing Act: Normalizing the Fed’s Balance Sheet
Executive Summary
As the Fed considers what do with its $4.5 trillion dollar balance sheet and the implications these decisions might have on financial markets, we are reminded of Donald Rumsfeld's observation that "it is easier to get into something than to get out of it."
When the Fed first raised rates in this cycle in December 2015, the FOMC announced its intention to continue rolling over its maturing assets until "normalization of the level of the fed funds rate is well under way." At the time, the Fed had just raised rates for the first time in almost a decade, meaning that "well under way" remained quite a ways off. Nearly a year and a half later, the Fed has increased the funds rate two more times and is signaling more hikes on the horizon.
The latest FOMC meeting minutes raised the level of urgency, with some members favoring balance sheet reductions by year-end 2017. Recent commentary by Fed speakers suggests momentum is building for a change. Cleveland Fed President Loretta Mester's comments are a prime example: "Ending reinvestments is a first step toward reducing the size of the balance sheet and returning its composition to primarily Treasury securities over time."
In this report, we consider the factors that will drive Fed balance sheet policy, such as size, composition and timing. We then consider two scenarios under which the Fed may normalize its balance sheet: A baseline scenario, in which maturing assets gradually roll off, and an alternative scenario, in which we explore what it would take for the Fed to consider active sales of its assets.
How Did We Get Here in the First Place?
Prior to the 2008 financial crisis and the ensuing recession, the Fed's asset holdings were about $900 billion, consisting primarily of Treasuries (Figure 1). During the crisis, the balance sheet temporarily held a diverse selection of financial instruments, such as commercial paper and currency swaps, to help mitigate the liquidity challenges that were unfolding in the financial system. Subsequent efforts to drive down long-term interest rates and thus stimulate the economy led to the various "quantitative easing" programs that brought the balance sheet to its current size of roughly $4.5 trillion, comprised mostly of Treasuries and mortgage-backed securities (MBS).
Fed holdings of MBS in such large quantities are without historical precedent. Past holdings of Treasuries, however, can help give us a sense of the role the Fed has played in the market for U.S. Treasuries in more 'normal times'. Perhaps counterintuitively, the Fed's share of the Treasury market plummeted at the onset of the last recession and remained below pre-recession levels for the first couple of years of the recovery (Figure 2). While this may seem odd at first, skyrocketing deficits during this period led to a surge in net treasury issuance (Figure 3). In addition, the Fed's initial purchases were more focused on assets other than Treasuries, such as MBS. Thus, at least initially, the size of the Treasury pie (or the amount of outstanding debt) grew, while the Federal Reserve's slice did not. When the Fed implemented the first and second rounds of quantitative easing (QE), these programs boosted the Fed's holdings of U.S. debt up from a historically low share. The last round of QE helped flip the narrative. QE3 brought the Fed's holdings of U.S. Treasuries, when viewed as a share of total outstanding, up to new highs. This occurred as an improving fiscal outlook simultaneously brought down the pace of new Treasury issuance.
If the Fed unwound its balance sheet and returned its holdings to its average share of the Treasury market from 1982-2007, it would still hold slightly less than $2 trillion in assets, which in nominal dollars would be historically quite high relative to its pre-recession holdings. Returning to the average from the more recent 2000s would yield an even larger balance sheet. Writing for Brookings earlier this year, former Fed Chairman Ben Bernanke discussed balance sheet reductions and maintained that "it's not unreasonable to argue that the optimal size of the Fed's balance sheet is currently greater than $2.5 trillion and may reach $4 trillion or more over the next decade."2 These estimates highlight that the Fed is unlikely to reduce its holdings to anywhere near pre-recession levels. Although the Fed's total balance sheet remains quite large, the economy has 'grown into' the Fed's balance sheet over the past decade, a phenomenon that should continue in the years ahead. Even still, if the rough estimate for the appropriate size of the balance sheet is somewhere in the neighborhood of $2 trillion-$2.5 trillion, there is clearly still scope for the Fed to begin reductions at some point in the near future.
The Path Forward: What Might the Road to "Normal" Look Like?
Fed guidance on the timing and structure of balance sheet reduction has been fairly tight-lipped until recently. However, based off of the Fed's "Policy Normalization Principles and Plans,"3 the following points appear likely to serve as key guidelines:
- "The Committee intends to reduce the Federal Reserve's securities holdings in a gradual and predictable manner primarily by ceasing to reinvest repayments of principal on securities held in the System Open Market Account (SOMA)."
- "The Committee currently does not anticipate selling agency mortgage-backed securities as part of the normalization process, although limited sales might be warranted in the longer run to reduce or eliminate residual holdings. The timing and pace of any sales would be communicated to the public in advance."
- "The Committee intends that the Federal Reserve will, in the longer run, hold no more securities than necessary to implement monetary policy efficiently and effectively, and that it will hold primarily Treasury securities, thereby minimizing the effect of Federal Reserve holdings on the allocation of credit across sectors of the economy."
In short, the Fed appears set to 1) allow maturing assets to roll off rather than outright sell securities and 2) gradually return its holdings to primarily Treasury securities over the long-run. Given this, we outline two illustrative scenarios to highlight the different paths ahead.
Scenario 1: The Passive Approach
Under this scenario, which we consider our baseline, the Fed will cease reinvesting the proceeds of its maturing securities, passively winding down the balance sheet in the process. As illustrated in Figure 4, more Treasury securities come due in 2018 than any other year. With a slightly longer time horizon, the Treasuries held on the Fed's balance sheet are front-loaded; nearly one-half of the Fed's $2.4 trillion in Treasury holdings come due between now and 2020. The maturity schedule leaves the Fed well-positioned to adopt this passive approach while still making a material impact on the size of its balance sheet. This route is also consistent with the Fed's stated goal of avoiding outright asset sales for the time being and is thus the least likely policy to roil financial markets. In an effort to smooth the process and avoid another "taper tantrum" episode, the initial reductions may entail reinvesting a significant fraction of the maturing assets. For example, for every $100 that comes due, the Fed could choose to reinvest $75 of that original $100, slowing the pace of balance sheet reduction more than the maturity schedule would suggest. Then, as economic conditions warrant and financial markets adjust to this new change in monetary policy, the Fed could begin to reduce the fraction of maturing proceeds it reinvests.
For Treasuries, this approach is fairly straightforward. On the MBS side of the portfolio, however, the balancing act is a bit more complicated for the Fed. As highlighted above, over the long-run the Fed would prefer to hold only Treasury securities to minimize its influence on the private allocation of credit. However, unlike the fixed maturity schedule of Treasuries, the passive approach to reducing MBS holdings leaves the Fed at the whim of forces outside its control. Prepayment on MBS, due to refinancing, mobility, downsizing/upsizing, etc., all influence the pace at which these securities will mature. Figure 5 illustrates a hypothetical scenario of how Fed holdings of MBS could evolve if they were allowed to pay down without being reinvested.4 At current rate levels, about $180 billion could pay down in 2018, a sizeable amount relative to the approximately $225 billion in net MBS issuance expected per year. This reinforces the notion that the Fed will likely choose to reinvest a share of the MBS proceeds to reassure financial markets that the balance sheet reductions will not be too sharp and the impact on markets rates will be more limited.
In our view, the Fed most likely will propose starting the process by allowing maturing securities to roll off by year's end, through a combination of MBS and Treasury reductions. In order to prevent a taper tantrum repeat, the Fed will likely try to signal this well in advance and choose to reinvest a sizable percentage of the maturing assets, smoothing the transition. The comments from Cleveland Fed President Mester and the latest Fed minutes offer examples of this messaging. If all proceeds according to plan and the economy continues to improve, the Fed would then gradually reduce the share of its reinvestments to normalize further.
Scenario 2: What Would It Take for the Fed to Commit to Outright Sales?
Given the above scenario, under what circumstances might the Fed consider outright sales of its assets? We doubt that the Fed will sell a meaningful quantity of MBS or Treasuries any time soon. Our interest rate strategists think that sizable sales could unnerve these markets. Indeed, although the Fed has explicitly stated it intends to wind down the balance sheet through ceasing reinvestments, it has also admitted that there is a chance that "limited sales [of MBS] might be warranted in the longer run to reduce or eliminate residual holdings."
A sharp change in the economic outlook could warrant asset sales of Treasuries, MBS or a combination of the two. If, for example, a sizable economic stimulus package ramped up economic growth and stoked faster inflation, the Fed might consider a more active approach to normalizing monetary policy beyond the fed funds rate. Alternatively, a shift in the composition of the FOMC could also lead to a more active approach than is currently anticipated. There are currently two open spots on the FOMC, and soon to be a third with the departure of Governor Tarullo. With Chair Yellen's term set to end in February 2018 and Vice-Chair Fischer's term ending that summer, President Trump and the Republican Congress have the opportunity to dramatically reshape the FOMC in the years ahead.
If the new Board members adopted a more hawkish/traditional approach that sought to return the Fed's balance sheet to a much smaller portfolio comprised primarily of Treasuries, this could lead to a more rapid reduction in MBS holdings. As illustrated in Figure 5, even if all maturing MBS over the next five years were allowed to roll off, at current rate levels MBS holdings could still be nearly $1 trillion, a far cry from pre-recession normalcy. The incoming policymakers could view this as unacceptably slow and ramp up the process in order to more rapidly exit the MBS market. Again, although this is not our baseline scenario and would likely play out over several years, it bears close watching given the Fed's competing goals of returning to primarily Treasuries holdings over the long-run and a desire to gradually and passively reduce the balance sheet without disrupting financial markets, the housing market or the overall economy.
Other Balance Sheet Considerations: The Greenspan Conundrum Could the Balance Sheet Offer the Fed Greater Flexibility?
In testimony before Congress in 2005, then Federal Reserve Chairman Alan Greenspan described the difficulty the Fed was encountering as longer term interest rates were not especially responsive to increases in the fed funds rate, a situation Chairman Greenspan famously referred to as a "conundrum."5 Later in that same year, then Governor Ben Bernanke expanded on the potential causes of the Greenspan conundrum, citing an oversupply of investment dollars from foreign investors, which drove longer dated bond prices up and pushed yields lower.6 Arguably a similar situation exists today and this foreign demand for longer-dated Treasuries becomes even more pronounced when volatility contributes to a flight-to-safety move by investors.
The flattening of the yield curve first observed by Greenspan in 2005 eventually gave way to an inverted yield curve at various points of time between 2005 and 2007 (Figure 6). Since 2014, the yield curve has been flattening again, with the spread between the yields on the 10-year and two-year Treasury returning to the level that prevailed at the time of the Greenspan conundrum.

Our interest rate forecast has short term rates rising faster than longer term rates and thus implies a continuation of this flattening trend. In this scenario, the swollen balance sheet of today's Fed offers some additional monetary policy flexibility vis-à-vis the Fed of the Greenspan era. Rather than waiting for the Treasuries it holds to come to maturity, the Fed might instead sell longer-dated Treasury securities on the open market. All else equal, the additional supply should push prices down and drive yields higher at the long end of the curve.
Relationship between Fiscal & Monetary Policy Isn't a One-Way Street
There are a number of Republican members of Congress who would like to see the Fed get out of the housing market and unwind some or all of its $1.8 trillion portfolio of MBS and agencies. In many instances, these are members of Congress who also place a high value on balancing the federal budget.
As Figure 7 shows, Congressional Budget Office estimates suggest that the fiscal budget deficit is poised to worsen over the next few years. Without making a value judgement about whether or not the Fed "should" maintain a large balance sheet, the Fed's large holdings currently help reduce the budget deficit. In an environment of rising deficits and policy proposals for which finding the funding is often a major challenge, reduced remittances to the Treasury cannot be ignored. As illustrated in Figure 8, Fed earnings remitted to the Treasury over the past 12 months add up to roughly $90 billion. Without those remittances, last year's fiscal budget deficit would have been 16 percent larger.
Furthermore, despite a debt-to-GDP ratio that has doubled since the Great Recession began, net interest costs as a share of GDP have remained historically low (Figure 9). With monetary policy tightening likely driving interest rates higher, this represents yet another way in which monetary policy can influence the fiscal side of the economic policy equation.
When the Levee Breaks
We do not expect the Fed to fully liquidate its balance sheet or fully 'normalize' its portfolio holdings. The next recession is coming. The next recession is always coming, and our baseline expectation is that this cycle has at least a couple more years to go. However, we would be remiss not to point out that in three months, the length of the current expansion will be eight years. The longest expansion on record is 10 years.
The Fed has lowered its estimates of what it considers the appropriate level for the fed funds rate in the longer-run from 4.25 percent in 2012 to 3.0 percent today.8 The ultimate terminal fed funds rate will likely be lower when the current cycle comes to an end that it has been in prior economic cycles. With limited scope for the Fed to cut rates when the next recession comes along, whenever that may be, the Fed may have to go back to the well of quantitative easing. This could entail resuming reinvestments or even returning to asset purchases, depending on what economic conditions warrant.
Normalization of the Fed's balance sheet is an important consideration and will become a focus of both monetary policymakers and financial markets in the months ahead. Monetary policymakers will be challenged to find a balanced path that begins the process of unwinding years of unconventional monetary policy while simultaneously keeping the economic expansion chugging along. The various scenarios considered in this paper are offered to help decision makers frame their thinking and make informed decisions as this process unfolds.
Canadian Dollar Higher On Oil Gains Ahead Of BOC Rate
The Canadian dollar is trading higher against the US dollar on Monday (1.3333) after another supply disruption in Libya has boosted oil prices. Geopolitical risk continues to be a factor as US President Donald Trump called in an airstrike on Syrian targets when he was hosting Chinese President Xi Jinping. The loonie lost ground on risk aversion on Friday despite a stronger than expected Canadian jobs report. 19,400 jobs were added in March and the unemployment rate rose slightly as more people are seeking to re-enter the workforce. The same day the US jobs report missed expectations but became a non-factor as targets looked to the Russia-US reactions to the attack on Syria triggering a flight to safety that kept the USD bid.
Earlier this morning housing starts in Canada jumped 254,000 beating the forecast of 212,000 and adding more pressure on what is already an overheating market. March housing starts were at their highest level since 2007 according to the Canada Mortgage and Housing Corporation (CMHC). Vancouver is seen as starting to cool off in what could be a direct reaction to updated mortgage rules, while Toronto continues to trend higher.
The Bank of Canada (BoC) will publish its monetary policy statement on Wednesday, April 13. The majority of analysts are in consensus that the central bank won’t raise rates. After a proactive 2015 where it cut rates twice ahead of the drop in oil prices, the BoC spent 2016 on the sidelines as a newly elected Liberal government announced a stimulus program. Governor Poloz has tried to talk down the currency in order to boost exports, but there are some fundamental signs that the economy is recovery which might bring about higher rates sooner rather than later.
The USD/CAD lost 0.508 percent in the last 24 hours. The pair is trading at 1.3337 as the loonie advances thanks to the bump in oil prices. The USD has lost some ground at the start of the week as risk appetite has returned to markets. The price of oil has helped the CAD appreciate as well as some strong fundamental data.
Investors will be looking at the Bank of Canada on Wednesday for more insight into the stance of the central bank. Inflation is rising, but the BoC has assured markets that there is no risk of overheating but as the U.S. Federal Reserve continues its rate hike path it will put further pressure on Poloz to keep up. For now the failure of the Trump administration to pass the healthcare reform policies has reduced the anticipated number of US rate hikes as the inflation boost from a tax reform or infrastructure spending might take longer than expected before Trump was inaugurated.
Oil prices gained 1.376 percent on the Monday session. The price of West Texas is trading at $52.73 after Libya’s largest oilfield is still offline after another outage. Geopolitical risk combined with the supply disruption to keep driving oil prices higher. Russia is also hinting at going along with an extension of the Organization of the Petroleum Exporting Countries (OPEC) production cut agreement. The deal has been the biggest factor in bringing stability to crude prices after the near free fall seen at the beginning of 2016.
OPEC and other major producers have joined in an unprecedented deal with very strong compliance but oil prices have been kept in check by the downward pressure of higher production from shale producers who are not part of the agreement. US inventories have hit record highs and US exports have regions hit by the OPEC oil cuts supplied with crude.
Market events to watch this week:
Monday, April 10
4:00pm USD Fed Chair Yellen Speaks
Tuesday, April 11
4:30am GBP CPI y/y
Wednesday, April 12
4:30am GBP Average Earnings Index 3m/y
10:00am CAD BOC Monetary Policy Report
10:30am USD Crude Oil Inventories
11:15am CAD BOC Press Conference
9:30pm AUD Employment Change
Tentative CNY Trade Balance
Thursday, April 13
8:30am CAD Manufacturing Sales m/m
8:30am USD PPI m/m
8:30am USD Unemployment Claims
10:00am USD Prelim UoM Consumer Sentiment
Friday, April 14
8:30am USD CPI m/m
8:30am USD Core CPI m/m
8:30am USD Core Retail Sales m/m
8:30am USD Retail Sales m/m