
Sample Category Title
Canadian Housing Starts Surge to Almost 10 Year-High in March
Highlights:
- Housing starts jumped to 254k in March, marking the highest 'standalone' reading since September 2007.
- Most of the monthly increase in March was accounted for by more multifamily dwelling starts, which are notoriously volatile, although single-unit starts (75k in March) were also at their highest level since November 2010.
- The increase was broadly-based on a regional basis. Starts jumped 35% in Alberta and an outsized 60% in B.C. (led by a spike in multiple-unit starts) with a strong 31% gain also posted in Quebec. Ontario rose a more modest 6%.
- On a year-over-year basis, starts were up in all regions, though led by gains in Quebec and the Prairies.
Our Take:
The surge in housing starts in March was largely concentrated in a jump in the volatile multiple-unit component that will very likely not be repeated to the same extent going forward. Single-unit starts have, nonetheless, also strengthened notably with the latest level in March (75k) marking the highest reading since mid-2010. Looking through monthly volatility, it remains the case that strength has generally been weighted to areas where housing markets have been tighter (eg. Ontario and B.C.); however, the aggregate level of starts nationally is still well-above most (including our own) estimates of the underlying pace of household formation. An earlier slowdown in the national resale market later in 2016 - in part, perhaps, related to the implementation of new macro-prudential policy measures in the fall - appears to have proven short-lived with demand picking up once again in early 2017, particularly in hotter markets in and around Toronto but also recent gains in Quebec and Alberta where sales have started to perk up once again. We expect stretched affordability conditions in some regions, a modest up-drift in lending rates, and potentially new regulatory measures, particularly in Ontario, will still eventually slow home demand this year with spillovers to new building activity; however, strong recent permit issuance (averaging 236k per month over the last three months to February) alongside strong demand in resale markets year-to-date suggests near-term building activity could continue to outperform expectations.
Elliott Wave Analysis: S&P500 Intraday View
Traders, welcome back for the US updates! We can see market mixed today, with USD turning slightly lower despite lower metals while stocks and crude oil are trading higher. In fact, we expect a resumption of an uptrend on stocks soon since S&P500 turned up in five waves from 2321 followed by recently completed expanded flat correction. Price is now trading near 2363 resistance where breakout may open door for 2378 once again.
S&P500, 1H
Trade Idea: USD/CAD – Stand aside
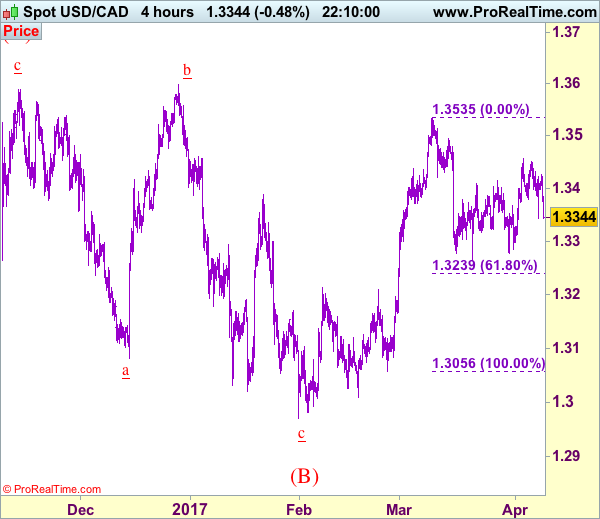
USD/CAD - 1.3348
Recent wave: Only wave v of c has ended at 0.9407 and wave C of major A-B-C correction is underway for headway to 1.4700
Trend: Near term up
Original strategy :
Exit long entered at 1.3375
Position: - Long at 1.3375
Target: -
Stop: -
New strategy :
Stand aside
Position: -
Target: -
Stop:-
As the greenback has dropped again after meeting resistance at 1.3427, retaining our view that top has possibly been formed at 1.3456 earlier and downside risk has increased for weakness to 1.3310-20, however, break of 1.3277 support is needed to signal another leg of decline from 1.3535 top is underway for test of 1.3264, below there would add credence to this view and extend weakness to 1.3235-40 (61.8% Fibonacci retracement of 1.3056-1.3535) and then 1.3200-10.
In view of this, would be prudent to stand aside for now. Above 1.3430-35 would revive bullishness and bring retest of 1.3456 resistance, break there would add credence to our view that the correction from 1.3535 has ended and bring further gain to 1.3495-00 but break there is needed to signal upmove has resumed for retest of 1.3535, once this level is penetrated, this would extend recent recent upmove from 1.2969 to 1.3575-80 but previous chart resistance at 1.3599 should hold on first testing.
To recap, wave B from 1.3066 is unfolding as an a-b-c and is sub-divided as a: 1.2192, b: 1.2716 and wave c is a 5-waver with i: 1.1983, ii: 1.2506, extended wave iii with minor iii at 1.0206, wave iv ended at 1.0781 and wave v as well as wave iii has ended at 0.9931, hence the subsequent choppy trading is the wave iv which is unfolding as (a)-(b)-(c) with (a) leg of iv ended at 1.0854, followed by (b) leg at 1.0108 and (c) leg as well as the wave iv ended at 1.0674. The wave v is sub-divided by minor wave (i): 0.9980, (ii): 1.0374, (iii): 0.9446, (iv): 0.9913 and (v) as well as v has possibly ended at 0.9407, therefore, consolidation with upside bias is seen for major correction, indicated target at 1.3700 and 1.4000 had been met and further gain to 1.4700 would be seen later.
EUR/USD Mid-Day Outlook
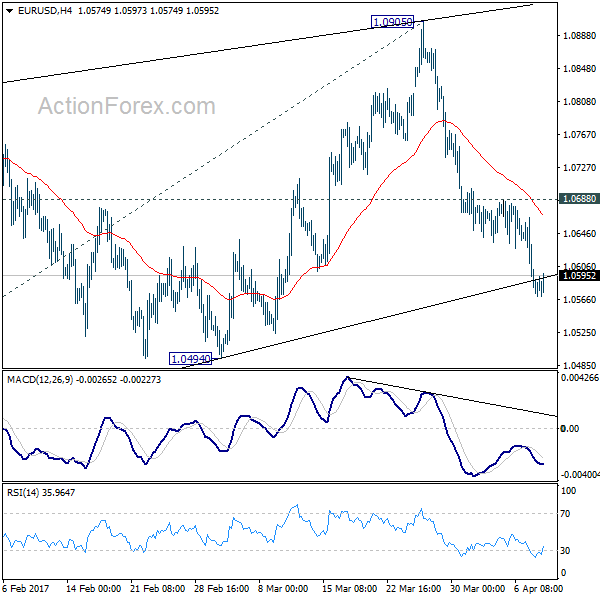
Daily Pivots: (S1) 1.0558; (P) 1.0611 (R1) 1.0642; More....
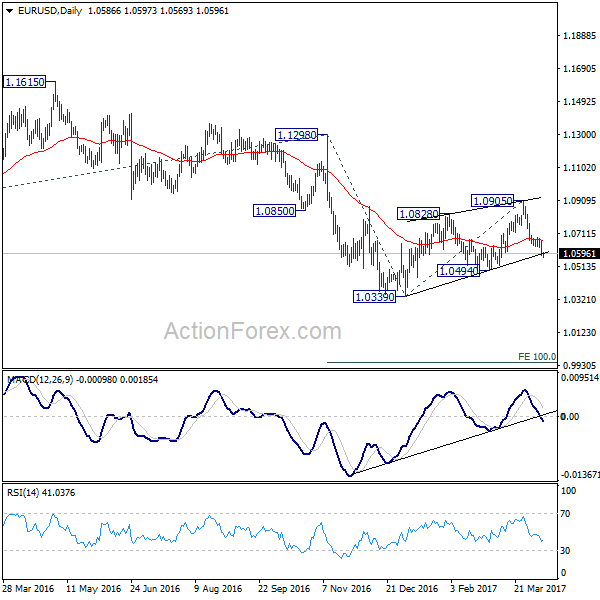
Further decline is expected in EUR/USD for 1.0494 support. As noted before, corrective rise from 1.0339 is likely finished after being rejected by 55 week EMA. And, the larger down trend is ready to resume. Decisive break of 1.0494 support will confirm this bearish case and target 1.0339 low. Break of 1.0339 will confirm down trend resumption and target 100% projection of 1.1298 to 1.0339 from 1.0905 at 0.9946. On the upside, however, break of 1.0688 resistance will delay the bearish case and turn focus back to 1.0905 resistance instead.
In the bigger picture, as long as 1.1298 key resistance holds, whole down trend from 1.6039 (2008 high) is still expected to continue. Break of 1.0339 low will send EUR/USD through parity to 61.8% projection of 1.3993 to 1.0461 from 1.1298 at 0.9115. However, considering bullish convergence condition in weekly MACD, break of 1.1298 will indicate term reversal. this would also be supported by sustained trading above 55 week EMA.
GBP/USD Mid-Day Outlook
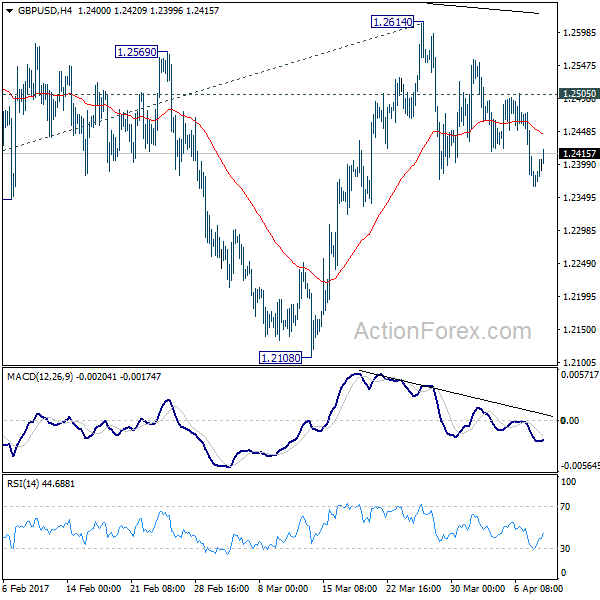
Daily Pivots: (S1) 1.2332; (P) 1.2404; (R1) 1.2445; More...
No change in GBP/USD's outlook. Further is expected with 1.2505 minor resistance intact. Triangle pattern from 1.1946 could be finished with five waves to 1.2614 too. Deeper decline would be seen back to 1.2108 first. Decisive break there will argue that medium term down trend is resuming. In that case, GBP/USD should take out 1.1946/1986 support zone to 61.8% projection of 1.5016 to 1.1946 from 1.2614 at 1.0717. On the upside, however, break of 1.2505 resistance will invalidate this immediately bearish case. Then, it will turn bias back to the upside for 1.2614 resistance instead.
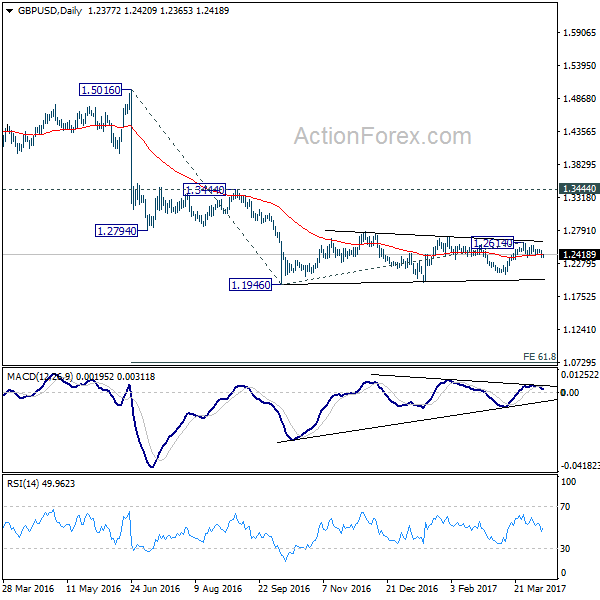
In the bigger picture, fall from 1.7190 is seen as part of the down trend from 2.1161. There is no sign of medium term reversal yet. Sustained trading below 61.8% projection of 2.1161 to 1.3503 from 1.7190 at 1.2457 will target 100% projection at 0.9532. Overall, break of 1.3444 resistance is needed to confirm medium term bottoming. Otherwise, outlook will remain bearish.
USD/JPY Mid-Day Outlook
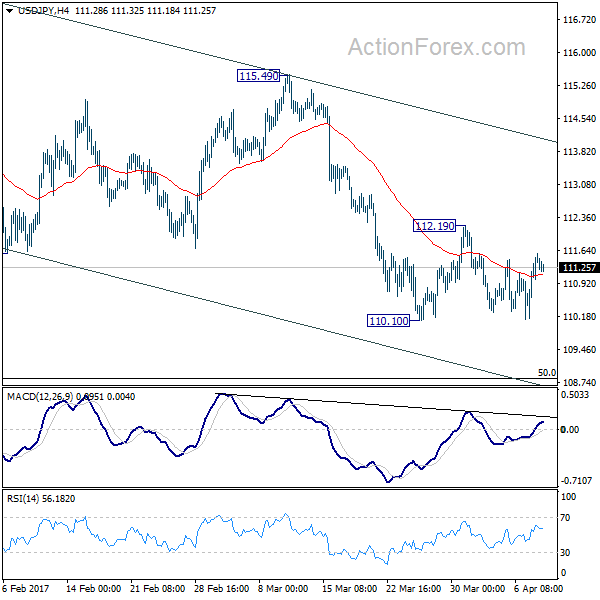
Daily Pivots: (S1) 110.29; (P) 110.83; (R1) 111.57; More....
USD/JPY is bounded in range of 110.10/112.19 and intraday bias remains neutral first. The pair is staying in the near term falling channel and the correction from 118.65 could extend lower. Below 110.10 will turn intraday bias to the downside for 50% retracement of 98.97 to 118.65 at 108.81. On the upside, however, break of 112.19 resistance will indicate short term reversal and turn bias back to the upside for 115.49 resistance.
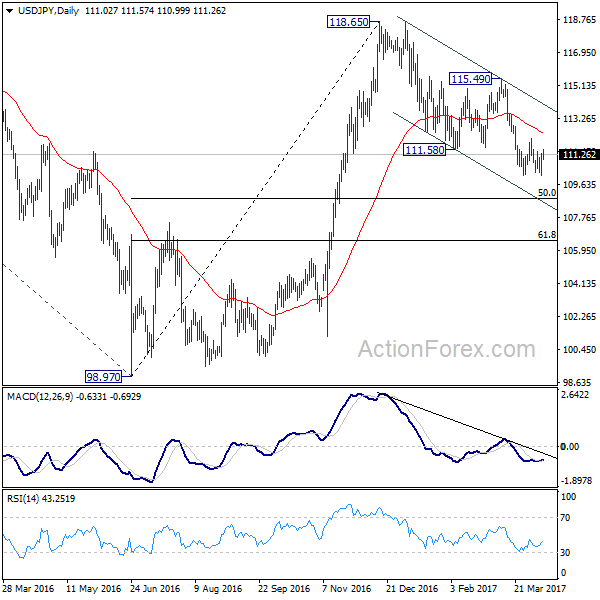
In the bigger picture, price actions from 125.85 high are seen as a corrective pattern. The impulsive structure of the rise from 98.97 suggests that the correction is completed and larger up trend is resuming. Decisive break of 125.85 will confirm and target 61.8% projection of 75.56 to 125.85 from 98.97 at 130.04 and then 135.20 long term resistance. Nonetheless, sustained trading below 55 week EMA (now at 111.15) will extend the consolidation from 125.85 with another fall through 98.97 before completion.
EUR/USD Bullish Divergence at Strong Support
The EUR/USD has formed a bullish divergence at the confluence - POC. The POC 1.0535-60 (historical buyers, M L3, W L3, W L4, bullish divergence) is at the strong support indicated by camarilla pivot points. If 1.0500 stays strong the POC could reject the price towards 1.0618, 1.0650 and 1.0700. Have in mind that these are counter trend movements and the trend is still bearish. However due to a potential reversal at POC, the pair could reject towards above mentioned levels.
Canada: Home Construction Surges in March
Canadian housing starts surged more than 50k to 254k annualized units in March, or nearly 50k above expectations and the highest number in nearly a decade. The strong March number sent the 6-month moving average higher to 211k – the fastest pace since 2012.
Most of the uptick was related to the highly volatile multifamily units, which were 37k higher on the month. Single-family construction was largely flat, rising a mere 2k in March.
Looking across the country, the gains were broad based. British Columbia accounted for most of the March uptick, rising 17k to 44.7k, while Quebec (+12k to 53k) and the Prairies (up nearly 9k to 45.1k) were not far behind. Ontario also saw 5k more units being constructed, with the March tally at 88.8k. Atlantic Canada was the lone underperformer, down by 3k to 3.8k on weakness in Nova Scotia and Newfoundland & Labrador.
Toronto and Vancouver, the two most closely watched housing markets, saw the largest gains, up 17k (to 53k) and 12k (to 30k), respectively.
Key Implications
Despite some anticipated give back following two unusually warm months, March surprised to the upside, with builders breaking ground on the highest number of properties since 2007. This was particularly true on the multi-family segment, which accounted for most of the monthly gain.
The strength was particularly pronounced in Toronto and Vanouver, which have been the two hottest markets in recent quarters – despite some pullback in luxury segment sales in the latter market in recent months. The supply response in Toronto is particularly welcome, given the white hot pace of price growth and dearth of inventory on the market. The completion of these units should help take some steam out of Toronto's home price growth, although this won't happen overnight and is likely a story for next year and beyond.
The gains in the Prairies, while above expectations, corroborate a turning point for the region's economies, which are slowly recovering from a two-year recession, particularly in Alberta and Saskatchewan, while the weakness in Atlantic Provinces, while partly-weather related, appears in line with slowing population and economic growth across this region.
All in all, this was a great report, but the lofty number is unlikely to last into the coming months as the effects of the warm winter likely manifest in a slower pace of homebuilding during spring and summer months. This is especially the case given the likely slowdown in the volatile multifamily segment, which should come back down to earth in the coming months. Ultimately, we expect starts will settle just below 200k during the remainder of the year.
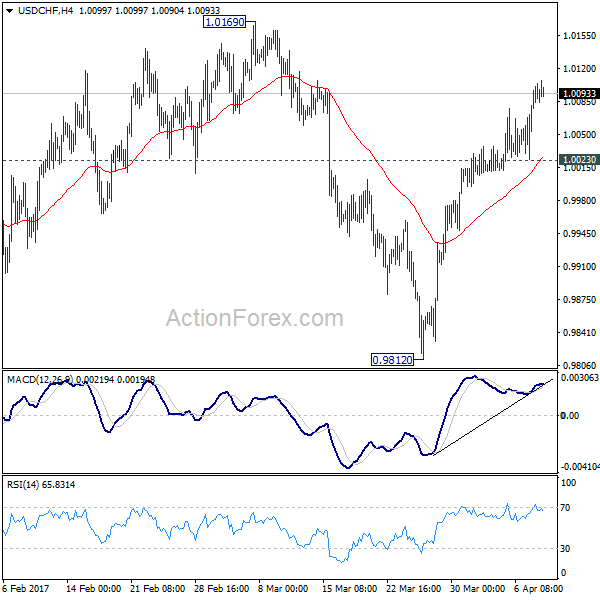
USD/CHF Mid-Day Outlook
Daily Pivots: (S1) 1.0043; (P) 1.0069; (R1) 1.0117; More.....
Intraday bias in USD/CHF remains on the upside as the rise from 0.9812 is still in progress. As noted before, corrective fall from 1.0342 should have finished with three waves down to 0.9812. Further rise should now be seen to 1.0169 resistance first . Decisive break there will confirm this bullish case and target 1.0342 key resistance next. On the downside, below 1.0023 minor support will turn bias neutral and bring consolidations before staging another rally.
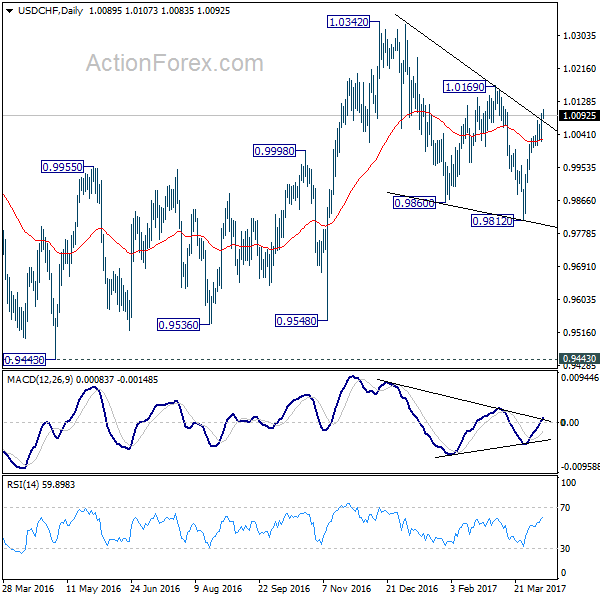
In the bigger picture, we're still maintain that firm break of 1.0342 key resistance is needed to confirm underlying bullish momentum in the cross. However, the corrective nature of the fall from 1.0342 to 0.9812 is starting to give the medium term outlook a bullish favor. Hence, in stead of looking for topping signal around 1.0342, we'd now pay closer attention to upside acceleration as USD/CHF approaches this level again.
Euro Lower on French Election News, Canadian Dollar Lifted by Oil Price
The Japanese Yen is trading as the weakest major currency today as it's paring back this month's gain. Canadian Dollar is so far the strongest one for the day as supported by strength in oil price. Dollar attempted to extend Friday's rally earlier today but no follow through buying in seen yet. Meanwhile, Euro is weighed down mildly by news on French presidential election. Overall, trading activity is quite subdued today as traders are probably starting preparing for holiday and long weekend ahead.
French election becomes a four-way match
In France, support for far left Jean-Luc Melenchon and conservative Francois Fillon jumped recently. That makes the presidential election in April and May a four-way match together with far right Marine Le Pen and centrist Emmanuel Macron. The latest Kantar Sofres poll published on Sunday showed that Macron and Le Pen tied for first with 24% support, Melenchon at 18% and Fillon at 17%. For the moment, anti-Euro Le Pen and pro-Euro Macron are still the favorites to enter into the run-off in May. And in that case, Macron is the favorite to win. However, the odds of Le Pen winning could jump if Fillon or Melenchon run the run-off with her. And, in that case, Frexit risk will also surge.
Released from Eurozone, Sentix investor confidence rose to 23.9 in April, up from 20.7, above expectation of 23.9.
BoJ concerned of Trump's trade policies
BoJ Governor Haruhiko Kuroda said at a quarterly meeting of regional branch managers that Japan's economy "continues to recover moderately as a trend". And he's optimistic that it would "turn into a moderate expansion". Meanwhile, he also reiterated his pledge to maintain ultra loose monetary policy until the 2% inflation target is hit. A report of the meeting noted that business plains could be affected by uncertainties over US President Donald Trump's trade balance. In particular, the reported noted a postponement of a metal product plant in Mexico even though there was no change in the investment plan in Japan. Also, there were growing concerns that US trade policies could affect exports and overseas production.
Released in Asian session, Japan economy watcher sentiment dropped to 47.4 in March. Current account surplus widened to JPY 2.12T in February. From Australia, home loans dropped -0.5% in February.
CAD strengthens as oil extends rally
Bank of Canada rate decision on Wednesday will be a major focus this week. BoC is widely expected to keep interest rate unchanged at 0.50%. The tone of the statement could remain slightly dovish in spite of improvements in economic data. Nonetheless, Canadian Dollar will likely follow more on oil prices as WTI crude oil could be heading back to 55.24 resistance due to geopolitical tensions. In addition, Libya's Sharara field halted production just one week after re-opening. Meanwhile, Russia Energy Minister Alexander Novak was reported saying that he's considering an extension of the OPEC-led production cuts by another six-month.
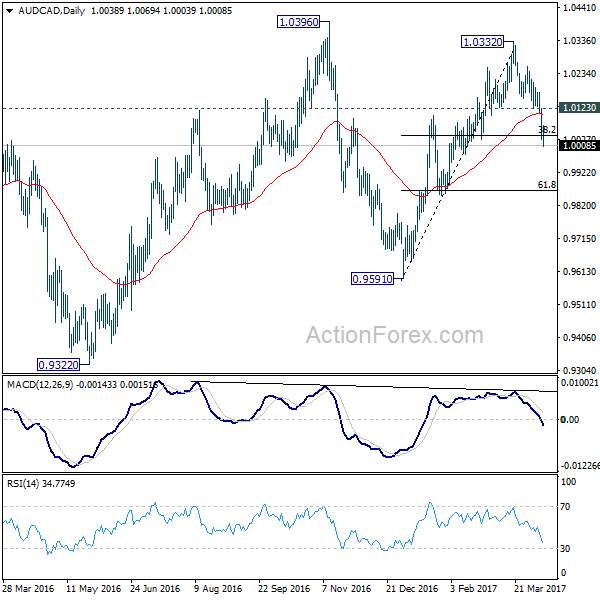
AUD/CAD to head lower to 0.9874 fibonacci level.
Canadian Dollar continues to enjoy much strength against Australian Dollar. As we mentioned back in the Daily Report on April 3, 1.0332 was confirmed to be a top and rise from 0.9591 is finished. The cross dropped through 38.2% retracement of 0.9591 to 1.0332 at 1.0049 as expected. And there is no sign of bottoming yet. Outlook in AUD/CAD will remains bearish as long as 1.0123 resistance holds. Current fall should extend to 61.8% retracement at 0.9874 and below. But overall, the cross is bounded in long term consolidation pattern start at 1.0784 (2012 high). And it stayed in range between 0.9148/1.0784 for more than five years. We're not seeing any clear long term trend yet.
USD/CHF Mid-Day Outlook
Daily Pivots: (S1) 1.0043; (P) 1.0069; (R1) 1.0117; More.....
Intraday bias in USD/CHF remains on the upside as the rise from 0.9812 is still in progress. As noted before, corrective fall from 1.0342 should have finished with three waves down to 0.9812. Further rise should now be seen to 1.0169 resistance first . Decisive break there will confirm this bullish case and target 1.0342 key resistance next. On the downside, below 1.0023 minor support will turn bias neutral and bring consolidations before staging another rally.
In the bigger picture, we're still maintain that firm break of 1.0342 key resistance is needed to confirm underlying bullish momentum in the cross. However, the corrective nature of the fall from 1.0342 to 0.9812 is starting to give the medium term outlook a bullish favor. Hence, in stead of looking for topping signal around 1.0342, we'd now pay closer attention to upside acceleration as USD/CHF approaches this level again.
Economic Indicators Update
| GMT | Ccy | Events | Actual | Forecast | Previous | Revised |
|---|---|---|---|---|---|---|
| 23:50 | JPY | Current Account (JPY) Feb | 2.21T | 1.79T | 1.26T | |
| 01:30 | AUD | Home Loans Feb | -0.50% | 0.00% | 0.50% | 0.40% |
| 05:00 | JPY | Eco Watchers Survey Current Mar | 47.4 | 49.8 | 48.6 | |
| 08:30 | EUR | Eurozone Sentix Investor Confidence Apr | 23.9 | 21 | 20.7 | |
| 12:15 | CAD | Housing Starts Mar | 254K | 215.5k | 210.2k | 214K |
| 14:00 | USD | Labor Market Conditions Index Change Mar | 1.3 |