Sample Category Title
EUR/USD Elliott Wave Analysis
EUR/USD – 1.0877
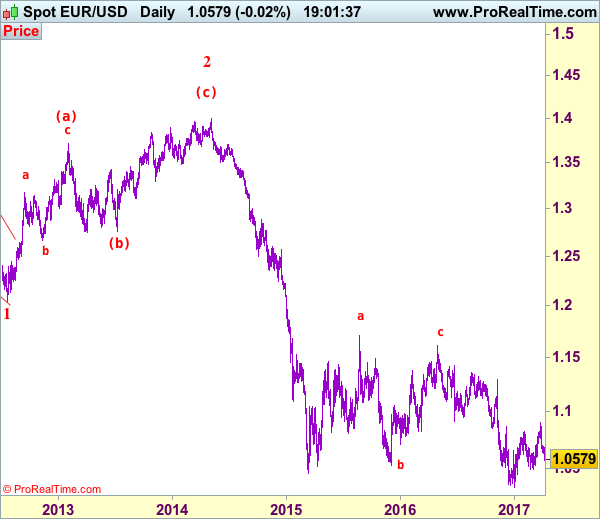
EUR/USD: Wave (c) of 2 ended at 1.3993 and wave 3 of III has commenced for weakness to 1.0411 (1.236 of wave 1), then 1.0000.
As the single currency has fallen again after brief recovery last week, adding credence to our view that top has been formed at 1.0906 earlier and consolidation with downside bias remains for weakness to 1.0525, however, a daily close below support at 1.0493 is needed to confirm correction from 1.0340 low has ended at 1.0906, bring further fall to 1.0450-55. Looking ahead, below there would signal early downtrend has resumed and extend fall to 1.0400 and later towards this year’s low at 1.0340 later.
Our preferred count on the daily chart remains that a wave (II) from 1.2329 ended at 1.5145 with A-leg ended at 1.4720, followed by wave B at 1.2457, the wave C from there was also a 3 legged move and is labeled as (a): 1.3739, (b): 1.2885, the wave iii of the 5-waver (c) from 1.2885 has ended at 1.4339 and wave iv is a triangle ended at 1.3878 and wave v formed a top at 1.5145. The decline from there is a 5-waver (C) with minor wave (i) of I of (C) ended at 1.4218 with wave (ii) ended at 1.4580, wave (iii) ended at 1.3267 and wave (iv) ended at 1.3692 and wave (v) ended at 1.1876, this is also the low of wave I of (C) and wave II ended at 1.4940, hence wave III is now in progress with a diagonal wave 1 ended at 1.2042, the breach of previous support at 1.1876 (wave I trough) adds credence to our view that the wave 2 has ended at 1.3993, wave 3 has commenced for further weakness to 1.0411, then towards 1.0000.
On the upside, whilst initial recovery to 1.0640-50 cannot be ruled out, reckon upside would be limited to 1.0670-80 and bring another decline. Above 1.0765-70 would defer and suggest first leg of decline from 1.0906 has ended, bring a stronger rebound to 1.0800-10 but price should falter well below 1.0870-75 and bring another decline. In the unlikely event euro breaks above resistance at 1.0906, this would shift risk back the upside for the erratic rise from 1.0340 low to bring retracement of early downtrend to 1.0930-35 (61.8% Fibonacci retracement of 1.1300-1.0340), then 1.1000.
Recommendation: Sell at 1.0680 for 1.0480 with stop above 1.0780.
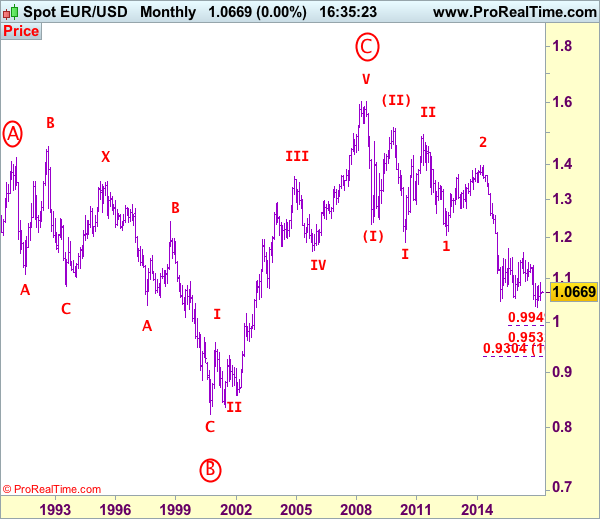
Euro's long-term uptrend started from 0.8228 (26 Oct 2000) with an impulsive structure. The rise from 0.8228 to 0.9593 (5 Jan 2001) is labeled as wave I, the retreat to 0.8352 (6 Jul 2001) is wave II and the rally to 1.3670 (31 Dec 2004) is wave III. Wave IV from there ended at 1.1640 (15 Nov 2005), the subsequent upmove to 1.6040 (July 15, 2008) is treated as wave V, the major selloff from the record high of 1.6040 to 1.2329 (October 27, 2008) signals a reversal has taken place with (I) leg ended at 1.2329 and once (II) ended at 1.5145, wave (III) itself is an extended move with I: 1.1876 and complex wave II ended at 1.4902, wave III has commenced with wave 1 and 2 ended at 1.2042 and 1.3993 respectively, wave 3 of III is now unfolding for weakness towards parity.
Technical Outlook: GOLD – Strong Upside Rejection On Friday Keeps The Downside Vulnerable
Spot Gold is trading within narrow range on Monday, supported by 10SMA at $1251, but with limited upside action, holding below strong 200SMA barrier at $1257.
Last Friday's spike to fresh five-month high at $1270 was short-lived, as subsequent pullback brought the price back to $1250 zone, where it found footstep.
Friday's strong upside rejection that formed daily candle with long upper shadow, weighs on near-term action, as the price failed to close above 200SMA for the fourth consecutive time.
Near-term studies weakened and see risk of deeper pullback on loss of 10SMA handle, as the price is losing momentum on daily chart.
Gold price may extend pullback from $1270 peak towards next strong support at $1243 (Fibo 38.2% of $1197/$1270 rally / rising 20SMA) before broader bulls re-assert.
200SMA is key and eventual close above it would generate stronger bullish signal.
Res: 1255, 1257, 1263, 1270
Sup: 1251, 1249, 1243, 1239
USD/JPY Elliott Wave Analysis
USD/JPY - 111.25
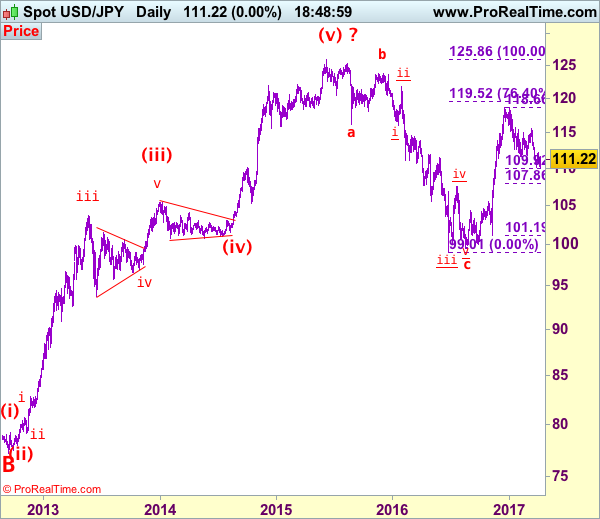
USD/JPY – Wave V of larger degree circle V has possibly ended at 75.31 and major correction has commenced and already met indicated target at 125.00.
Although the greenback fell to as low as 110.13 late last week, as price has recovered again after holding above indicated support at 110.11, retaining our view that further consolidation above this level would be seen and corrective bounce to 111.90-00 cannot be ruled out, however, reckon upside would be limited to 112.80-85 and bring another decline later. A break of said support at 110.11 would signal the erratic decline from 118.66 top is still in progress, bring retracement of early upmove to 109.90-95 (50% Fibonacci retracement of 101.19-118.66) and then 109.50 but reckon downside would be limited to 109.00 and price should stay well above 107.85-90 (61.8% Fibonacci retracement), bring rebound later.
Our preferred count is that, triangle wave IV (with circle) ended at 101.45 and the circle wave V brought dollar down to the record low of 75.31 in 2011 and the subsequent rebound signal major correction has commenced with A leg ended at 84.19, followed by wave B at 77.14 and impulsive wave C is now unfolding (indicated upside target at 125.00 had been met) for gain towards 127.00 level. In the event dollar drops below support at 99.01, this would confirm medium term decline from 125.86 top (2015 high) has resumed for subsequent weakness to 98.00 and possibly 97.00.
Under this count, this wave C is unfolding as impulsive waves with (1) (2), 1 2 ended at 80.67, 79.07, 82.84 and 81.69 respectively, hence the extended wave 3 has ended at 103.74 and wave 4 correction of recent upmove should bring weakness to 92.57, then towards 90.88 but psychological support at 90.00 should limit downside and bring another rally later in wave 5, indicated target at 125.00 had been met and gain to 127.00 cannot be ruled out but reckon price would falter below 130.00.
On the upside, whilst initial recovery to 111.90-00 cannot be ruled out, reckon upside would be limited to 112.80-85 and bring another decline later. A daily close above 113.54 would abort and signal low is formed instead, bring a stronger rebound to 114.00-10 and possibly 115.10-20 but resistance at 115.51 should remain intact, bring another decline.
Recommendation: Sell at 112.80 for 110.80 with stop above 113.80.
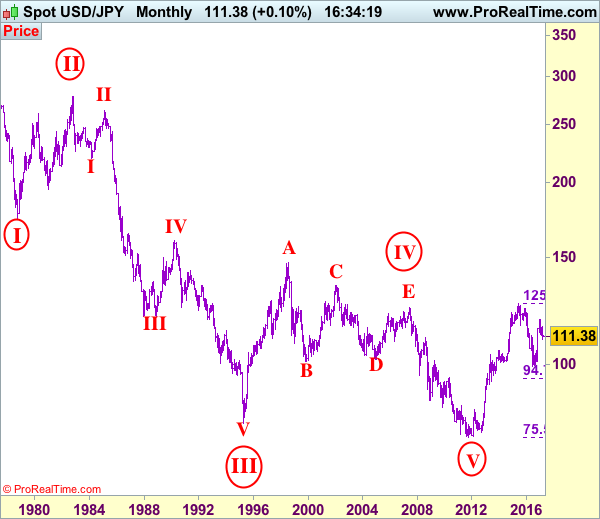
On the monthly chart, we have changed our preferred count that an impulsive wave is unfolding with major wave III with circle ended at 79.75, then followed by wave IV with circle and is labeled as a triangle with A: 147.64 (11 August, 1998), B: 101.25, C: 135.20, D: 101.67 and E leg ended at 124.14 to end the wave IV with circle. Hence, wave V with circle commenced from there and hit a record low of 75.31, however, the subsequent strong rebound signals this circle wave V has possibly ended there, hence gain to (indicated upside target at 122.00 and 125.00 had been met), the retreat from 125.86 suggests wave A of major correction has ended there and wave B correction back to 99.00, then 95.00 would be seen, however, reckon downside would be limited to 90.00, bring another rebound in wave C next year.
Gold Breaking Resistance At $1263, Silver Random Sell-Off, Crude Oil Continued Bullish Move.
Gold Breaking resistance at $1263.
Gold challenge to near term resistance has paused yet, momentum seems back to bullish despite some consolidation. Resistance is located at 1263 (27/02/2017 high). Hourly support can be found at 1224.10 (16/03/2017 low).
In the long-term, the technical structure suggests that there is a growing upside momentum. A break of 1392 (17/03/2014) is necessary ton confirm it, A major support can be found at 1045 (05/02/2010 low).
Silver Random sell-off.
Silver is trying to find a new equilibrium after its massive sell-off. Strong resistance is given at a distance at 18.49 (27/02/2017 high). Key support is given at 16.82 (15/03/2017 low).
In the long-term, the death cross indicates that further downsides are very likely. Resistance is located at 25.11 (28/08/2013 high). Strong support can be found at 11.75 (20/04/2009).
Crude oil Continued bullish move.
Crude oil keeps on increasing. The commodity had been located in a bearish trend since the commodity had been unable to mount a serious challenge to resistance at 55.24 (03/01/2017 high) but now the pair is heading higher. Resistance is given at 51.88 (05/041/2017 high). Hourly support is given at 47.09 (22/03/2017 low).
In the long-term, crude oil has recovered after its sharp decline last year. However, we consider that further weakness are very likely. Strong support lies at 24.82 (13/11/2002) while resistance can now be found at 55.24 (03/01/2017 high).
EUR/CHF Remains Below Its Declining Trendline, EUR/JPY Minor Bounce, EUR/GBP Consolidating After Sharp Decline.
EUR/CHF Remains below its declining trendline.
EUR/CHF has paused near the key support at 1.0684 (see also the falling channel). However, the persistent succession of lower highs favours a bearish bias. Hourly resistances can be found at 1.0691 (07/04/2017 high). The medium-term pattern suggests us to see continued bearish pressures towards key support that can be found at 1.0623 (24/06/2016 low). Expected to see further decline.
In the longer term, the technical structure is mixed. Resistance can be found at 1.1200 (04/02/2015 high). Yet,the ECB's QE programme is likely to cause persistent selling pressures on the euro, which should weigh on EUR/CHF. Supports can be found at 1.0184 (28/01/2015 low) and 1.0082 (27/01/2015 low).
EUR/JPY Minor bounce.
EUR/JPY rejection at 122.88 has triggered a correction. Resistance stands at 122.88 (13/03/0217 high). Support at 117.43 has held up so far however, break would trigger further weakness towards strong support given at 113.73 (09/11/2016 low).
In the longer term, the technical structure validates a medium-term succession of lower highs and lower lows. As a result, the resistance at 149.78 (08/12/2014 high) has likely marked the end of the rise that started in July 2012. Strong support at 94.12 (24/07/2012 low) looks nonetheless far away.
EUR/GBP Consolidating after sharp decline.
EUR/GBP is consolidating following sharp fall. Hourly resistance is given at 0.8591 (05/04/2017 high). Strong resistance is given at 0.8787 (13/03/2017 high). Hourly support can be found at 0.8484 (31/03/2017 low). Expected to show continued weakness.
In the long-term, the pair has largely recovered from recent lows in 2015. The technical structure suggests a growing upside momentum. The pair is trading above from its 200 DMA. Strong resistance can be found at 0.9500 psychological level.
Trade Idea Update: USD/CHF – Buy at 1.0030
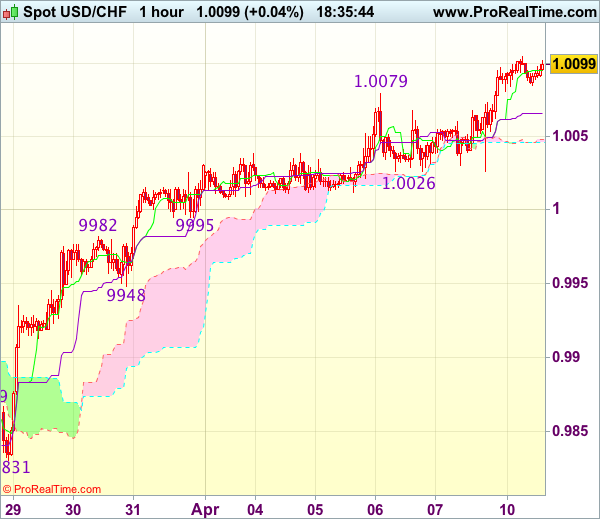
USD/CHF - 1.0098
Original strategy :
Buy at 1.0030, Target: 1.0130, Stop: 0.9995
Position : -
Target : -
Stop : -
New strategy :
Buy at 1.0030, Target: 1.0130, Stop: 0.9995
Position : -
Target : -
Stop : -
The greenback has maintained a firm undertone after Friday’s rally, adding credence to our bullish view that recent upmove from 0.9813 is still in progress and upside bias remains for this move to extend further gain to previous resistance at 1.0109, then towards 1.0140-45, however, loss of upward momentum should prevent sharp move beyond another previous resistance at 1.0171, risk from there has increased for a retreat to take place later.
In view of this, would not chase this rise here and would be prudent to buy dollar on pullback as support at 1.0026 should limit downside. Below minor support at 0.9995 would defer and suggest top is possibly formed, risk correction to 0.9960 but support at 0.9948 should hold from here.
Trade Idea Update: GBP/USD – Sell at 1.2450
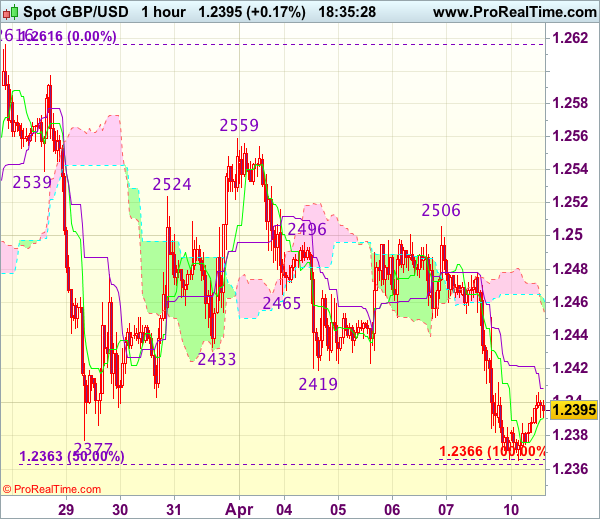
GBP/USD - 1.2396
Original strategy :
Sell at 1.2450, Target: 1.2350, Stop: 1.2485
Position : -
Target : -
Stop : -
New strategy :
Sell at 1.2450, Target: 1.2350, Stop: 1.2485
Position : -
Target : -
Stop : -
As the British pound found good support around 1.2365-66 and has recovered, suggesting consolidation above this level would be seen an above the Kijun-Sen (now at 1.2418) would bring recovery towards 1.2450-55 before prospect of another decline, below said support at 1.2365-66 would extend recent decline from 1.2616 to 1.2350, then towards 1.2325-30 but near term oversold condition should limit downside and reckon 1.2300 would hold from here.
In view of this, would not chase this fall here and would be prudent to sell cable on recovery as 1.2450-60 should limit upside. Above the upper Kumo (now at 1.2469) would defer and suggest low is formed instead, risk test of resistance at 1.2506 first, break there would confirm, then a stronger rebound to 1.2525-30 would follow.
Trade Idea Update: EUR/USD – Sell at 1.0635
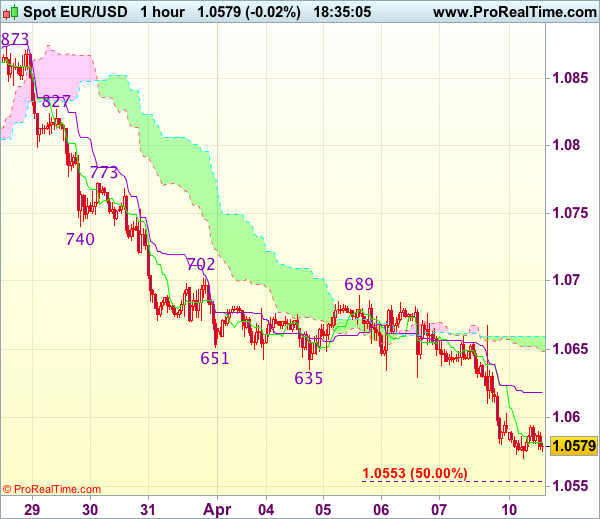
EUR/USD - 1.0580
Original strategy :
Sell at 1.0635, Target: 1.0535, Stop: 1.0670
Position : -
Target : -
Stop : -
New strategy :
Sell at 1.0635, Target: 1.0535, Stop: 1.0670
Position : -
Target : -
Stop : -
The single currency ran into renewed selling interest at 1.0667 on Friday (after NFP) and has dropped again, the breach o indicated support at 1.0600 adds credence to our bearish view that the decline from 1.0906 is still in progress and may extend further weakness towards 1.0550-55 (50% projection of 1.0906-1.0635 measuring from 1.0689), then 1.0525-30, however, near term oversold condition should prevent sharp fall below 1.0500, risk from there is seen for a rebound later.
In view of this, would not chase this fall here and would be prudent to sell dollar on recovery as 1.0635 (previous support now resistance) should limit upside. Only a firm break above said resistance at 1.0667 would abort and suggest low is formed instead, risk a stronger rebound to 1.0689, then 1.0702.
Trade Idea Update: USD/JPY – Buy at 110.90
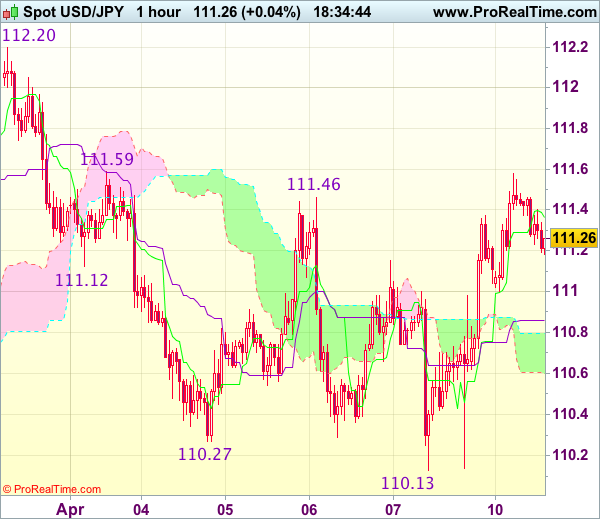
USD/JPY - 111.27
Original strategy :
Buy at 110.90, Target: 111.90, Stop: 110.55
Position : -
Target : -
Stop : -
New strategy :
Buy at 110.90, Target: 111.90, Stop: 110.55
Position : -
Target : -
Stop : -
Although the greenback fell to as low as 110.13 late last week, as dollar has staged a strong rebound after holding above indicated support at 110.11, retaining our view that further consolidation above this level would be seen and mild upside bias is for test of 111.59 resistance, a break there would signal the fall from 112.20 has ended, then a stronger rebound to 111.90-00 would follow but said resistance at 112.20 should hold and choppy trading within 110.11-112.20 would continue.
In view of this, we are looking to buy dollar on dips but one should exit on such rebound. Below the lower Kumo (now at 110.60) would signal an intra-day top is formed instead, risk weakness to 110.40 but only break of said support at 110.11-13 would confirm medium term decline has resumed for further subsequent fall to 109.80-85 (1.618 times projection of 112.20-111.12 measuring from 111.59) but price should hold above 109.50-55 (100% projection of 112.20-110.27 measuring from 111.46).
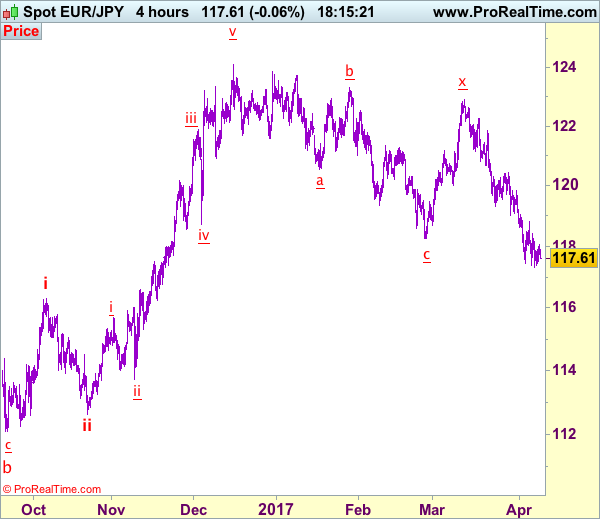
Trade Idea: EUR/JPY – Sell at 119.00
EUR/JPY - 117.68
Recent wave: wave v of (C) ended at 94.12 and major correction in wave A has ended at 149.79
Trend: Near term down
Original strategy:
Sell at 119.00, Target: 117.00, Stop: 119.60
Position: -
Target: -
Stop: -
New strategy :
Sell at 119.00, Target: 117.00, Stop: 119.60
Position: -
Target: -
Stop:-
As the single currency recovered after falling to 117.32, suggesting consolidation above this level would be seen and corrective bounce to 118.15-20 and then 118.45-50 cannot be ruled out, however, reckon upside would be limited to 118.80 and bring another decline later, below said support at 117.32 would add credence to our view that recent erratic decline from 124.10 top (2016 high) is still in progress and extend weakness to 117.00 but oversold condition should prevent sharp fall below 116.50-60 and reckon 116.15-20 would hold from here.
In view of this, would not chase this fall here and would be prudent to sell euro on subsequent rebound as 118.90-00 should limit upside. Above 119.06 resistance would defer and suggest a temporary low is possibly formed, risk rebound to 119.40-50 but price should falter below resistance at 119.85, bring another selloff.
Our latest preferred count is that wave (ii) is ABC-X-ABC which ended at 123.33 and wave (iii) is unfolding with wave iii ended at 100.77, followed by wave iv at 111.57 and wave v as well as the wave (iii) has ended at 97.04, followed by wave (iv) at 111.43 and wave (v) has ended at 94.12 which is also the end of the larger degree v, this also implied the major wave (C) has also ended there, hence major correction has commenced from there with (A) leg unfolding in its lower degree wave c which has possibly ended at 145.69. Under this count, A-B-C wave (B) has commenced with A leg ended at 136.23, wave B at 143.79 and wave C has possibly ended at 149.79.
Our larger degree count is that the decline from 139.26 is wave (C) and is sub-divided into a diagonal triangle i-ii-iii-iv-v with wave i - 105.44, wave ii- 123.33, wave iii - 97.03, wave iv - 111.43, followed by the final wave v as well as the end of wave (C) at 94.12, this also mark the bottom of larger degree wave B. Under this count, major rise in wave C has commenced as an impulsive wave with minor wave III ended at 145.69, wave V is still in progress for further gain to 150.00. Having said that, this so-called wave V could well be the first leg of larger degree 5-waver wave C and this wave C should bring at least a retest of wave A top at 169.97 (July 2008).