Sample Category Title
USD/CHF Finding Demand, USD/CAD Choppy Trading, AUD/USD Breaks Support Area.
USD/CHF Finding demand.
USD/CHF has gained significant momentum. Hourly support is given at 1.0039 (07/04/2017 base low) then 0.9814 (27/03/2017 low). Key resistance can be found at a distance at 1.0171 (07/03/2017) then 1.0344 (15/12/2016 high). Expected to show another leg higher.
In the long-term, the pair is still trading in range since 2011 despite some turmoil when the SNB unpegged the CHF. Key support can be found 0.8986 (30/01/2015 low). The technical structure favours nonetheless a long term bullish bias since the unpeg in January 2015.
USD/CAD Choppy trading.
USD/CAD has broken resistance area around 1.3400 which invalidates the short term bearish technical structure. Hourly support is given at 1.3265 (21/03/2016 low) is at stake. Key support is given at 1.2969 (31/01/2017 low).
In the longer term, there is a golden cross with the 50 dma crossing the 200 dma indicating further upside pressures. Strong resistance is given at 1.4690 (22/01/2016 high). Long-term support can be found at 1.2461 (16/03/2015 low).
AUD/USD Breaks support area.
AUD/USD has broken the support at 10.7494 (19/01/2017 low. The current bounce near the support has thus far unimpressive failed to find momentum, confirming persistent selling pressures. Next meaningful support is located at 0.7449 (13/01/2017 low).
In the long-term, we are waiting for further signs that the current downtrend is ending. Key supports stand at 0.6009 (31/10/2008 low) . A break of the key resistance at 0.8295 (15/01/2015 high) is needed to invalidate our long-term bearish view.
Trade Idea: AUD/USD – Hold long entered at 0.7525
AUD/USD – 0.7489
Recent wave: Wave 5 ended at 1.1081 and major correction has commenced for fall to 0.7000 and then towards 0.6500-10
Trend: Near term down
Original strategy :
Bought at 0.7525, Target: 0.7680, Stop: 0.7465
Position: - Long at 0.7525
Target: - 0.7680
Stop: - 0.7465
New strategy :
Hold long entered at 0.7525, Target: 0.7680, Stop: 0.7465
Position: - Long at 0.7525
Target: - 0.7680
Stop:- 0.7465
As aussie has remained under pressure after recent selloff, marginal weakness from here cannot be ruled out, however, loss of near term downward momentum should prevent sharp fall from there and bring rebound later, above 0.7550 would bring test of indicated resistance at 0.7588, break there would suggest a temporary low is possibly formed, bring rebound to 0.7625-30 and later towards resistance at 0.7680-85.
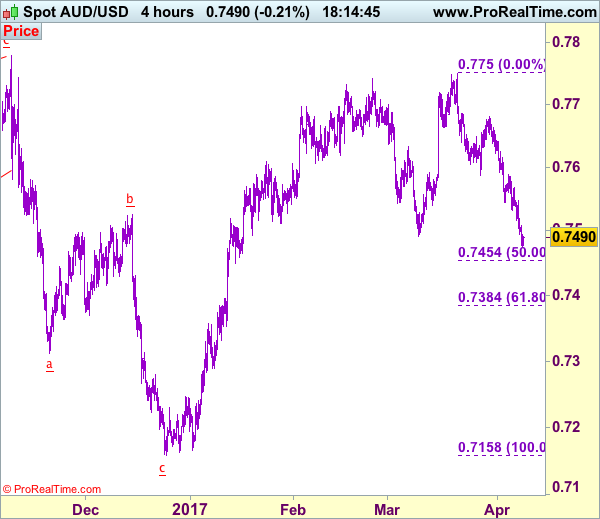
In view of this, we are holding on to our long position entered at 0.7525. Below indicated support at 0.7465-70 would signal the fall from 0.7750 is still in progress for further weakness to 0.7450-55 (50% Fibonacci retracement of 0.7158-0.7750), however, oversold condition should limit downside to 0.7380-85 (61.8% Fibonacci retracement), risk from there is seen for a rebound later.
On the 4-hour chart, the move from 0.8066 is the wave 5 with i: 0.8860, ii: 0.8315, wave iii is an extended move ended at 1.0183, iv: 0.9706 and wave v has ended at 1.1081 (also the top of entire wave 5). The subsequent selloff is the major correction which is unfolding as ABC-X-ABC and 2nd A leg has ended at 0.8848, followed by a-b-c wave B which ended at 0.9758, hence, 2nd C wave is now in progress and indicated downside target at 0.7000 and 0.6950 had been met, so further fall to 0.6710-20 cannot be ruled out.
EUR/USD Downside Pressure Builds, GBP/USD Pushing Lower, USD/JPY Moving Sideways.
EUR/USD Downside pressure builds.
EUR/USD has broken the key resistance at 1.0679 (02/16/2017 high). Hourly support can be found at 1.0570 (intraday low). Stronger support can be found at 1.0494 (22/02/2017 low). Resistance can be located at a distant 1.0658 (07/07/2017 reaction high). Expected to see further short-term weakness.
In the longer term, the death cross late October indicated a further bearish bias. The pair has broken key support given at 1.0458 (16/03/2015 low). Key resistance holds at 1.1714 (24/08/2015 high). Expected to head towards parity.
GBP/USD Pushing lower.
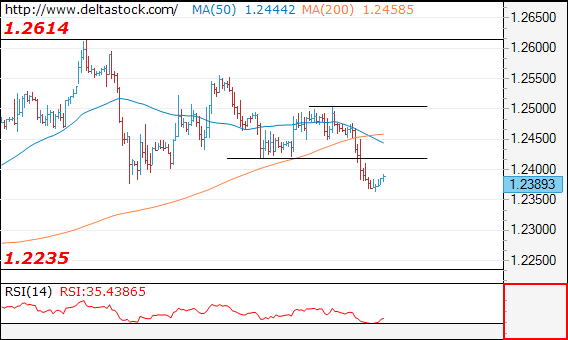
GBP/USD remains weak near the support at 1.2334, indicating persistent selling pressures. Hourly resistance is located at 1.2469 (07/04/2017 high).
The long-term technical pattern is even more negative since the Brexit vote has paved the way for further decline. Long-term support given at 1.0520 (01/03/85) represents a decent target. Long-term resistance is given at 1.5018 (24/06/2015) and would indicate a long-term reversal in the negative trend. Yet, it is very unlikely at the moment.
USD/JPY Moving sideways.
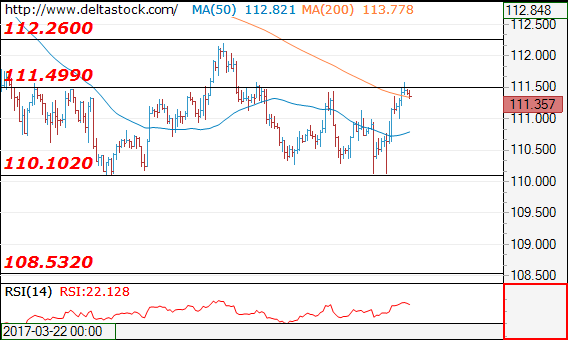
USD/JPY is consolidating below resistance at 112.20 (31/03/2017 high). Stronger resistance can be located at 113.57 (16/03/2017 high) while support is given at 110.11 (27/03/2017 low).
We favor a long-term bearish bias. Support is now given at 96.57 (10/08/2013 low). A gradual rise towards the major resistance at 135.15 (01/02/2002 high) seems absolutely unlikely. Expected to decline further support at 93.79 (13/06/2013 low).
Technical Outlook: AUDUSD – Wave C Extends To 138.2% After Probe Below Key 0.7489 Support
The Aussie is under strong pressure and eventually broke below strong support at 0.7489 (09 Mar low) on Monday that marked full retracement of 0.7489/0.7747 rally.
The pair is in red far the past three weeks, with last week’s strong bearish acceleration leaving long red weekly candle that heavily weighs on market.
Close below 0.7489 pivot will be seen as strong bearish signal for further extension of the wave C of five-wave cycle from 0.7747 that met its target at 0.7472 (FE 138.2%) today.
Consolidation around 0.7489 handle could be expected on oversold daily slow stochastic, however, the indicator is still pointing lower and without bullish signal for now.
Broken 100SMA (0.7511) offers solid resistance which keeps the upside limited for now, with extended upticks expected to hold below broken 200SMA (0.7550) to keep firm bearish structure intact.
Res: 0.7506, 0.7550, 0.7582, 0.7606
Sup: 0.7472, 0.7436, 0.7400, 0.7380
Market Update – European Session: Quiet Start To Trading Week
Quiet start to trading week
Notes/Observations
Florida meeting between China President Xi and US President Trump viewed as a success. China has reportedly offered improved market access for US financial sector investments and beef exports in a move to avert a trade war
Geopolitical risks help USD maintain firm tone
Weekend/Overnight:
Asia:
China Premier Li Keqiang calling on cabinet to remain vigilant for risks related to bad assets, bond defaults, shadow banking and online finance
PBoC skipped its open market operations for 11th straight session as liquidity remained at relatively high leve
China said to be willing offer Trump administration better market access for financial sector and US beef/agriculture exports to help avert a trade
BOJ Gov Kuroda reiterated view that Japan CPI to rise toward 2% target and it would maintain QQE until achieving core CPI stably exceeded 2%
US has ordered an aircraft carrier group to move closer to the Korean Peninsula in response to recent provocations from North Korea. State Sec Tillerson noted that US was not planning a regime change in North Korea
Europe:
Bank of England (BOE) said to be implicated in secret recording on Libor that it repeatedly pressured commercial banks to lower their Libor rates during financial crisis
Americas:
President Trump said to executive order to launch a trade investigation that could lead to supplemental duties in certain product categories
Energy:
Weekly Baker Hughes US Rig Count: 839 v 824 w/w (+1.8%) (12th straight weekly rise)
Sen Murkowski (R-AK) introduces measure to repeal Obama-era Arctic offshore oil drilling restrictions
Economic Data
(NO) Norway Mar CPI M/M: 0.3% v 0.4%e; Y/Y: 2.4% v 2.4%e
(NO) Norway Mar CPI Underlying M/M: 0.4% v 0.4%e; Y/Y: 1.7% v 1.7%e
(SE) Sweden Mar PES Unemployment Rate: 3.9% v 3.9%e
(FR) Bank of France Mar Business Sentiment: 103 v 104e
(CZ) Czech Mar CPI M/M: 0.0% v 0.0%e; Y/Y: 2.6% v 2.6%e
(CZ) Czech Mar Unemployment Rate: 4.8% v 4.9%e
(DK) Denmark Mar CPI M/M: 0.1% v 0.1%e; Y/Y: 1.0% v 1.0%e
(TW) Taiwan Mar Trade Balance: $3.7B v $3.7Be, Exports Y/Y: 13.2% v 15.5%e, Imports Y/Y: 19.8% v 25.0%e
(EU) Euro Zone Apr Sentix Investor Confidence: 23.9 v 21.0e
Fixed Income Issuance:
(DK) Denmark sold total DKK1.0B in 3-month and 6-month Bills
SPEAKERS/FIXED INCOME/FX/COMMODITIES/ERRATUM
Index snapshot (as of 10:00 GMT)
Indices [Stoxx50 -0.3% at 3,483, FTSE flat at 7,351, DAX -0.1% at 12,210, CAC-40 -0.5% at 5,110, IBEX-35 -0.4% at 10,486, FTSE MIB -0.2% at 20,252, SMI -0.5% at 8,599, S&P 500 Futures +0.1%]
Market Focal Points/Key Themes:European equity indices are trading generally lower after China's indices ended lower overnight; Banking stocks trading mixed as shares of SocGen, BNP and Santander trade lower in the Eurostoxx despite shares of Deutsche Bank trading higher; commodity and mining stocks trading mixed in the FTSE 100 as copper prices trading lower intraday; FTSE 100 marginally outperforming led by shares of BHP Billiton after Elliott reportedly sent a letter to holders proposing single Australian HQ and tax residence, with a demerger of BHP's US petroleum ops, unlocking value.
No upcoming scheduled US earnings pre-market.
Equities (as of 09:50 GMT)
Consumer Discretionary: [Air France AF.FR +3.7% (March metrics), Sanoma SAA1V.FI +3.5% (Divests Dutch TV Business SBS stake to Talpa for €237M – Adjusts FY17 outlook)]
Financials: [Barclays BARC.UK +0.5% (Confirms investigation by the FCA and PRA into CEO Jes Staley relating to Barclays whistleblowing programme)]
Healthcare: [Stada Arzneimittel SAZ.DE +11.0% (Supports the voluntary public tender offer by Bain Capital and Cinven worth €66.00/shr)]
Materials: [BHP Billiton BLT.UK +5.0% (Reportedly Elliott send letter to holders to unlock value; proposing single Australian HQ and Tax residence; Proposes demerging BHP's US petroleum ops), Centamin CEY.UK -3.8% (Q1 production)]
Bund futures trade at 162.94 up 9 ticks continuing momentum higher after weaker US Mar NFP numbers. Futures traded near session highs with 163.12 the upside target to print new contract highs, followed by 163.34. A reversal looks to 162.02 initially followed by 161.63.
Gilt futures trade at 128.01 up 12 ticks trading higher on risk aversion flows. Support remains at 127.75 then 127.34 followed by 127.05. A move above 128.63 high sees resistance at 128.96 followed by 129.24. Short Sterling futures trade flat with Jun17Jun18 flattening 12/12.5bp
Monday's liquidity report showed Friday's excess liquidity rose to a record €1.600T a rise of €9B from €1.591T prior. Use of the marginal lending facility rose to €131M from €90M prior.
Corporate issuance saw $21.15B issued last week via 30 tranches slightly below the $25B polled by analysts. Issuance for the year stands just above $420B for the week ahead analyst eye issuance to come in around $10B ahead of the Easter weekend. In Euro denominated issuance €22.7B came to market, which was in line with analyst expectations. SSA issuance accounted for the bulk of the issuance with just shy of €10B being priced via 12 tranches. Tuesday saw issuance peak with €7.11B priced.
Speakers
Ukraine Central Bank Gov Gontareva said to hand in resignation to President (as expected)
BOJ Quarterly Regional Report (Sakura) maintained assessment in 8 of 9 regions noting that the regions continued to recover or expand moderately.
BOJ Osaka Branch Manager: Recent FX moves were not too concerning for companies in the Kansai region
China Banking Regulatory Commission (CBRC) to strengthen risk control on liquidity and debt default
Currencies
USD was at 3-week highs aided by geopolitical risks
EUR/USD fractionally lower despite continued improvement in the regions confidence data. Sentix climbed to 23.9 but had little impact on price action. Dealers noted that political concerns weighed on the Euro ahead of the French elections.
USD/JPY was higher by 0.3% at 111.35 aided by Fed's Dudley affirmation that the Fed was getting closer to shrinking its balance sheet
Looking Ahead
(IT) G7 Foreign Ministers begin 2-day meeting in Italy
(MX) Mexico Mar Nominal Wages Y/Y: No est v 4.6% prior
05:30 (DE) Germany to sell €2.0B 6-month BuBills
06:00 (PT) Portugal Feb Trade Balance: No est v -€0.9B prior - 06:45 (US) Daily Libor Fixing
07:00 (BR) Brazil Apr IGP-M Inflation (1st Preview): -0.4%e v 0.3% prior
07:00 (CZ) Czech Central Bank comments on monthly CPI data
07:00 (IN) India announces details of upcoming bond sale (held on Fridays)
07:25 (BR) Brazil Central Bank Weekly Economists Survey
08:00 (ES) Spain Debt Agency (Tesoro) announces size of upcoming auctions
08:15 (CA) Canada Mar Annualized Housing Starts: 215.5Ke v 210.2K prior
08:15 (UK) Baltic Dry Bulk Index
08:50 (FR) France Debt Agency (AFT) to sell combined €4.8-6.0B in 3-month, 6-month and 12-month BTF Bills
09:00 IMF updates World Economic Outlook (WEO)
09:30 (EU) ECB announces Covered-Bond Purchases
09:35 (EU) ECB calls for bids in 7-Day Main Refinancing Tender
10:00 (US) Mar Labor Market Conditions Index Change: 1.0e v 1.3 prior
11:00 (PT) ECB's Constancio (Portugal)
11:30 (US) Treasury to sell 3-Month and 6-month Bills
13:00 (US) Treasury to sell 3-Year Notes
16:00 (US) Weekly Crop Progress Report
16:00 (US) Fed Chair Yellen
EUR/USD Candlesticks and Ichimoku Analysis
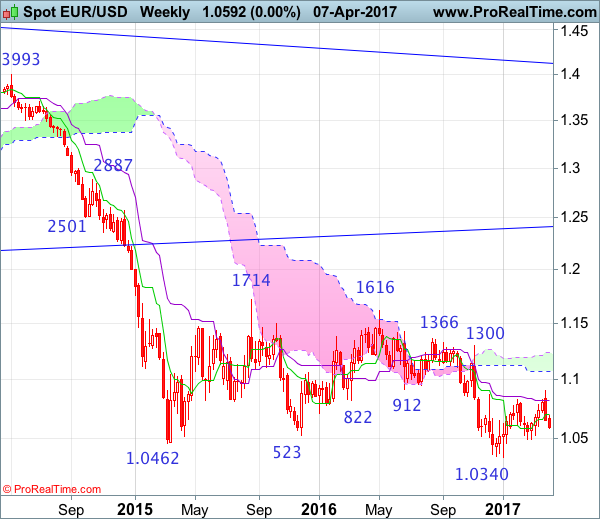
Weekly
• Last Candlesticks pattern: Shooting star
• Time of formation: 03 May 2016
• Trend bias: Down
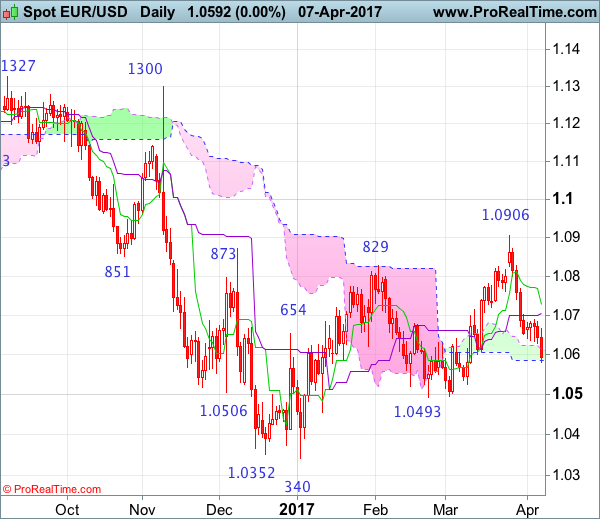
Daily
• Last Candlesticks pattern: Shooting star
• Time of formation: 3 May 2016
• Trend bias: Sideways
EUR/USD – 1.0581
Euro’s selloff after running into strong resistance at 1.0906 signals top has been formed there and consolidation with mild downside bias is seen for weakness to 1.0525 support, however, a daily close below key support at 1.0493 is needed to confirm early erratic rise from 1.0340 low (this year’s low) has ended at 1.0906, bring further fall to 1.0440-50 and possibly towards 1.0390-00 but said support at 1.0340 should remain intact.
In view of this, would not chase this fall here and would be prudent to sell euro on recovery as 1.0665-70 should hold from here, bring another decline. A daily close above the Kijun-Sen (now at 1.0716) would abort and suggest first leg of decline from 1.0906 has ended instead, risk a stronger rebound to 1.0765-70 but upside should be limited to 1.0800 and price should falter well below 1.0870-75, bring another selloff later this month.
Recommendation: Sell euro at 1.0670 for 1.0500 with stop above 1.0770.
On the weekly chart, euro’s selloff from 1.0906 formed two consecutive black candlesticks and price broke below indicated support at 1.0600 last week, adding credence to our view that top has been formed there and consolidation with mild downside bias is seen for weakness to 1.0525. Looking ahead, only a break of indicated pivotal support at 1.0493 would signal the rebound from 1.0340 has ended at 1.0906, bring further fall to key support at 1.0454, a sustained breach below this level would provide confirmation, then further fall to 1.0390-00 and later retest of this January low would follow.
On the upside, expect recovery to be limited to the Tenkan-Sen (now at 1.0700) and brig another decline. Above 1.0730-40 would bring test of 1.0780, however, reckon upside would be limited to 1.0825-30 and price should falter well below said resistance at 1.0906, bring another decline later. Only a break of 1.0906 would revive near term bullish view for the erratic rise from 1.0340 low to bring retracement of recent decline to 1.0930-35 (61.8% Fibonacci retracement of 1.1300-1.0340) and possibly 1.1000, however, reckon upside would be limited to 1.1050-60 and price should falter below 1.1100-10, risk from there is seen for a retreat to take place later.
Forex Technical Analysis: EUR/USD, USD/JPY, GBP/USD
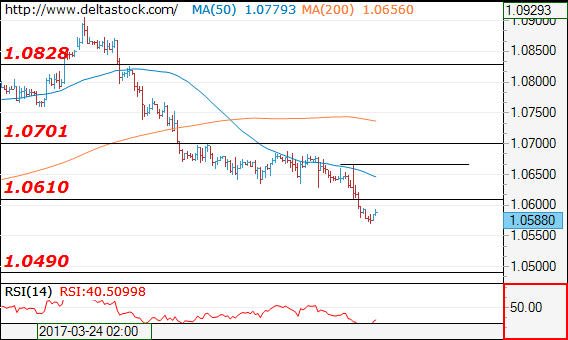
EUR/USD
Current level - 10588
The downtrend is intact, heading towards 1.0490 support area. Initial intraday resistance lies at 1.0610, followed by the crucial high at 1.0667.
| Resistance | Support | ||
| intraday | intraweek | intraday | intraweek |
| 1.0667 | 1.0828 | 1.0570 | 1.0490 |
| 1.0700 | 1.0904 | 1.0490 | 1.0340 |
USD/JPY
Current level - 111.35
Last week's test of 110.10 failed to break the mentioned lows and the intraday bias is positive above 111.00, with a risk of another climb towards 112.26.
| Resistance | Support | ||
| intraday | intraweek | intraday | intraweek |
| 111.50 | 113.50 | 111.00 | 110.10 |
| 112.26 | 115.65 | 110.10 | 107.80 |
GBP/USD
Current level - 1.2389
The intraday bias is negative below 1.2420, with a crucial level at 1.2500. Initial minor support lies at 1.2330.
| Resistance | Support | ||
| intraday | intraweek | intraday | intraweek |
| 1.2420 | 1.2620 | 1.2330 | 1.2230 |
| 1.2500 | 1.2705 | 1.2235 | 1.2107 |
GBP/JPY Daily Outlook
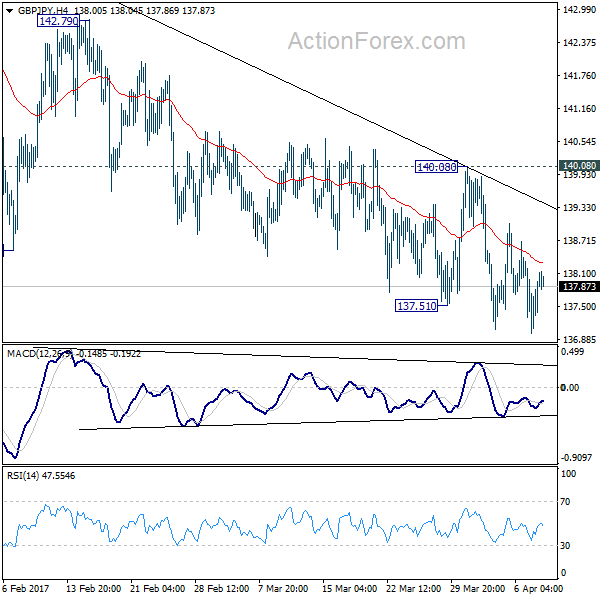
Daily Pivots: (S1) 136.73; (P) 137.54; (R1) 138.18; More...
Further fall is expected in GBP/JPY with 140.08 resistance intact. But still, choppy price actions from 148.42 are viewed as a corrective pattern. Hence, we'd anticipate strong support from medium term fibonacci level at 135.39 to bring rebound. On the upside, firm break of 140.08 resistance will now indicate near term reversal and turn bias back to the upside for 142.79 resistance first.
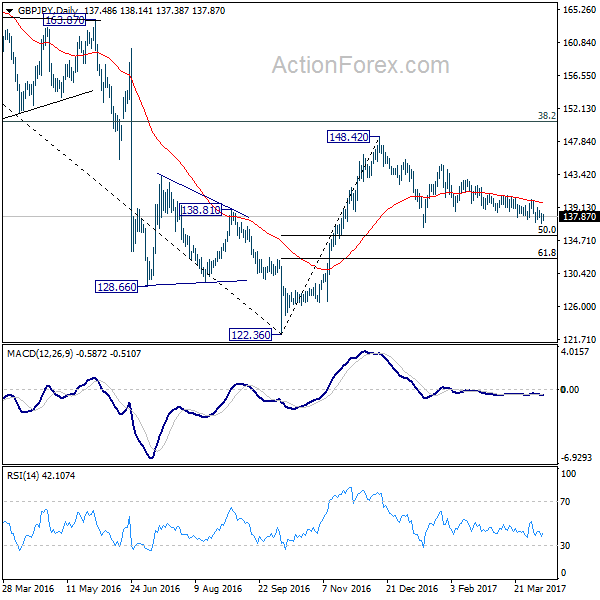
In the bigger picture, price actions from 122.36 medium term bottom are still seen as a corrective pattern. Main focus is on 38.2% retracement of 195.86 to 122.36 at 150.42. Rejection from there will turn the cross into medium term sideway pattern. Or, sustained break of 50% retracement of 122.36 to 148.42 at 135.39 will turn outlook bearish for a test on 122.36 low. Though, sustained break of 150.42 will extend the rebound towards 61.8% retracement of 195.86 to 122.36 at 167.78.
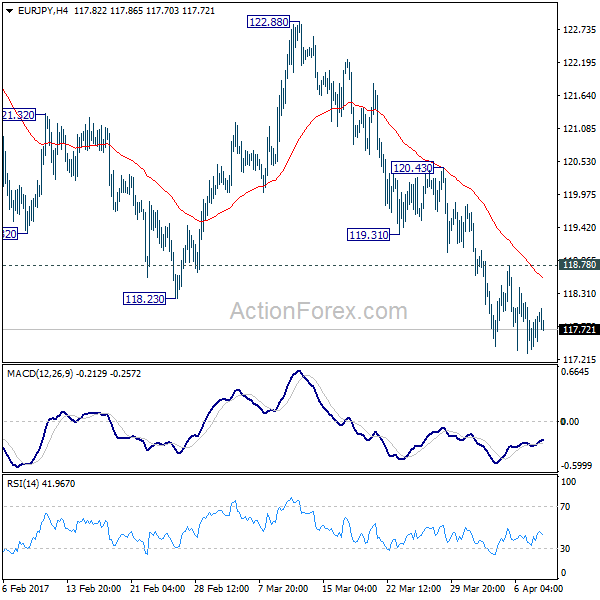
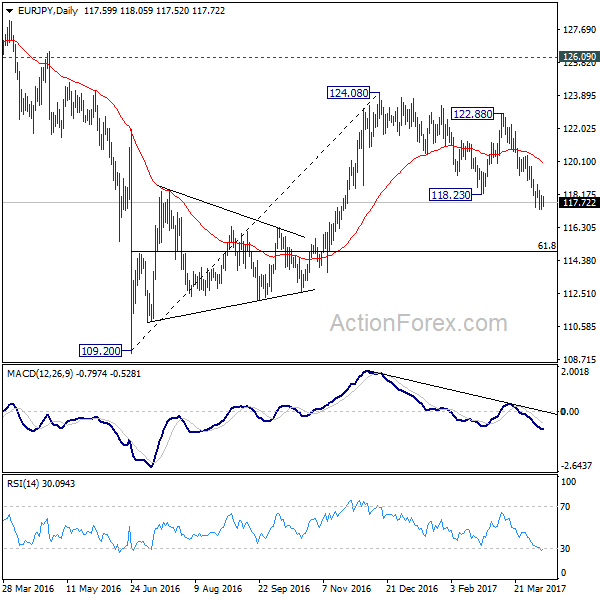
EUR/JPY Daily Outlook
Daily Pivots: (S1) 117.23; (P) 117.70; (R1) 118.08; More...
As long as 118.78 resistance holds, deeper decline is expected in EUR/JPY. As noted before, whole medium term rebound from 109.20 is completed at 124.08 already. Next target will be 61.8% retracement of 109.20 to 124.08 at 114.88. On the upside, above 118.78 will indicate short term bottoming and bring rebound back to 119.31/120.43 resistance zone. That also coincides with 55 day EMA (now at 120.19). In that case, we'll look at the reactions in this resistance zone to assess the outlook again.
In the bigger picture, the firm break of 38.2% retracement of 109.20 to 124.08 at 118.39 indicates that medium term rise from 109.20 is completed at 124.08. That's well below 126.09 key support turned resistance. Also, EUR/JPY failed to sustain above 55 week EMA. Deeper decline would now be seen back to 109.20 low. Overall, the down trend from 149.76 (2014 high) is not completed yet. Break of 109.20 will resume such down trend towards 94.11 low. In any case, break of 126.09 is needed needed to confirm medium term reversal.
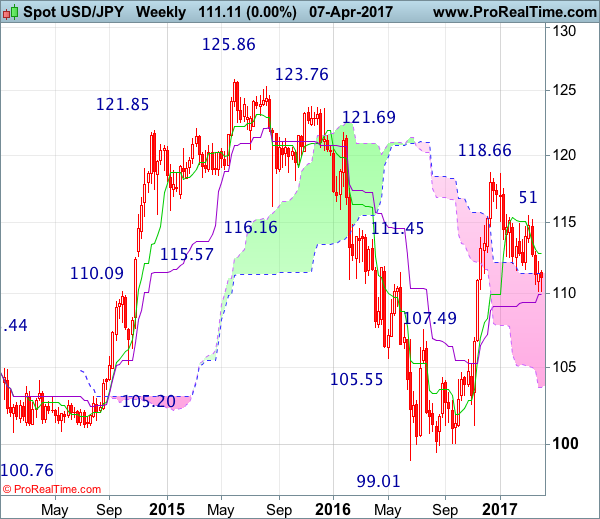
USD/JPY Candlesticks and Ichimoku Analysis
Weekly
• Last Candlesticks pattern: Marubozu
• Time of formation: 14 Nov 2016
• Trend bias: Down
Daily
• Last Candlesticks pattern: Shooting star
• Time of formation: 15 Feb 2017
• Trend bias: Down
USD/JPY – 111.39
Although the greenback fell to as low as 110.13 late last week, as dollar has rebounded again after holding above indicated previous support at 110.11, suggesting further consolidation would take place and another bounce to 111.65-70 cannot be ruled out, however, as long as resistance at 112.20 holds, prospect of another decline remains, below said support at 110.11-13 would confirm downtrend from 118.66 has resumed and extend weakness to 109.90-95 (50% Fibonacci retracement of 101.19-118.66), then 109.50, however, downside would be limited to 109.00 and previous support at 108.55 should hold from here, price should stay well above dynamic support at 107.85-90 (61.8% Fibonacci retracement of 101.19-118.66) and bring rebound later.
On the upside, expect recovery to be limited to 111.65-70 and bring another decline. Above previous support at 112.26 (now resistance) would risk test of 112.81-90 (current level of the Kijun-Sen and previous resistance) but a daily close above there is needed to signal low is possibly formed, risk a stronger rebound to 113.54 resistance, a break above there would add credence to this view, then further gain to 114.00-10 would follow.
Recommendation : Hold short entered at 111.50 for 109.50 with stop above 112.30.
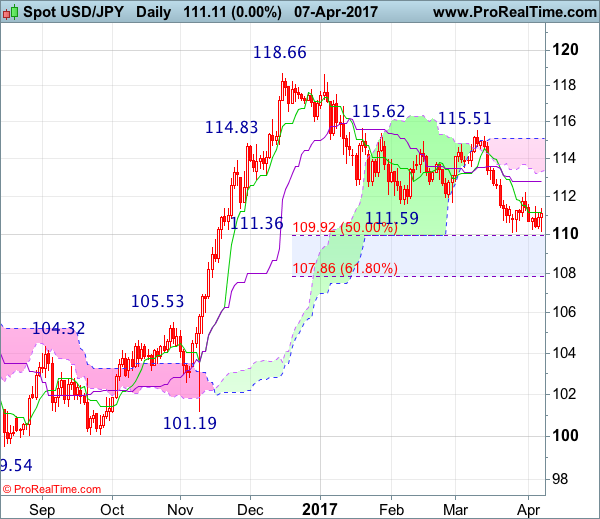
On the weekly chart, as the greenback has recovered again after finding support around the Kijun-Sen (now at 109.79), suggesting minor consolidation above this level would be seen, however, reckon upside would be limited to 112.26 (previous support) would limit upside and bring another decline later, below 109.90-95 (50% Fibonacci retracement of 101.19-118.66) would extend the retreat from 118.66 to 109.00 but reckon support at 108.55 would limit downside and price should stay above 107.85-90 (61.8% Fibonacci retracement), risk from there is seen for a rebound later.
On the upside, although initial recovery cannot be ruled out, reckon upside would be limited to 112.00-10 and bring another decline. Above previous support at 112.26 (now resistance) would defer and suggest a temporary low is formed, bring test of the Tenkan-Sen (now at 112.81), a weekly close above there would add credence to this view, then further gain to 113.54 resistance and then 114.00-10 would follow but price should falter well below resistance at 115.51.