Sample Category Title
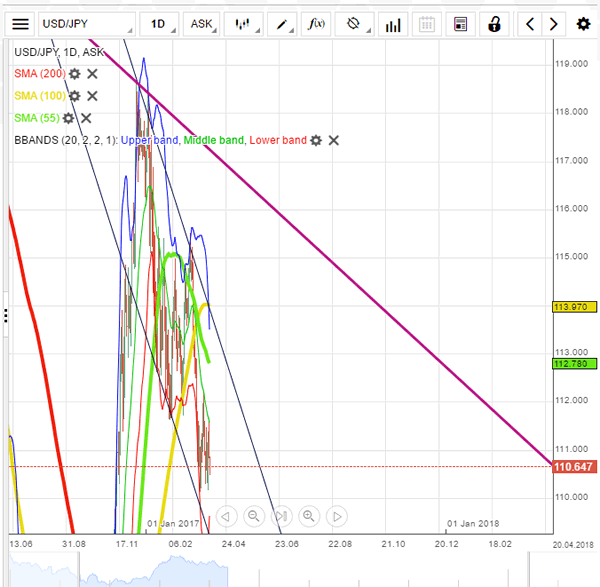
USD/JPY Daily Outlook
Daily Pivots: (S1) 110.62; (P) 111.10; (R1) 111.40; More....
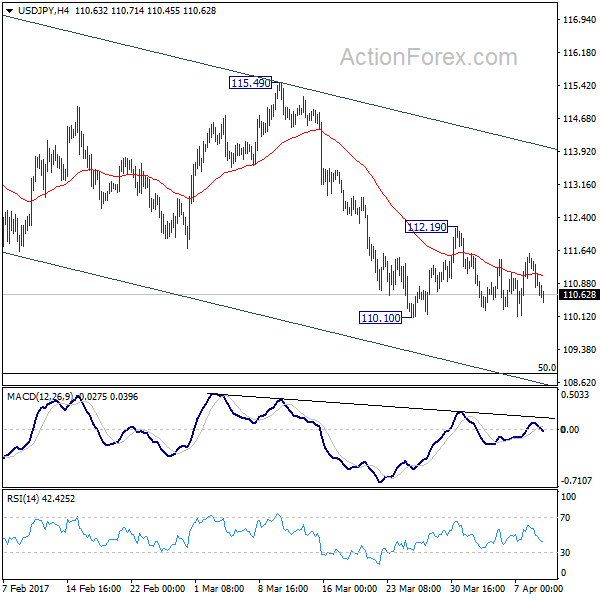
Intraday bias in USD/JPY stays neutral as it's bounded in range of 110.10/112.19. The pair is staying in the near term falling channel and the correction from 118.65 could extend lower. Below 110.10 will turn intraday bias to the downside for 50% retracement of 98.97 to 118.65 at 108.81. On the upside, however, break of 112.19 resistance will indicate short term reversal and turn bias back to the upside for 115.49 resistance.
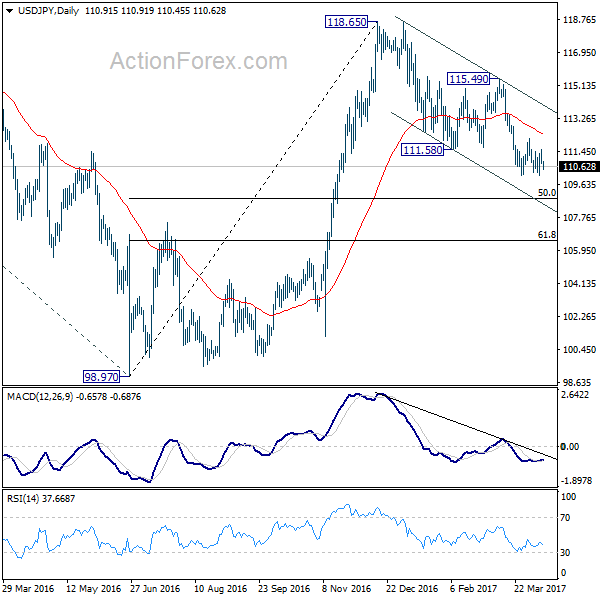
In the bigger picture, price actions from 125.85 high are seen as a corrective pattern. The impulsive structure of the rise from 98.97 suggests that the correction is completed and larger up trend is resuming. Decisive break of 125.85 will confirm and target 61.8% projection of 75.56 to 125.85 from 98.97 at 130.04 and then 135.20 long term resistance. Nonetheless, sustained trading below 55 week EMA (now at 111.15) will extend the consolidation from 125.85 with another fall through 98.97 before completion.
GBP/USD Candlesticks and Ichimoku Analysis
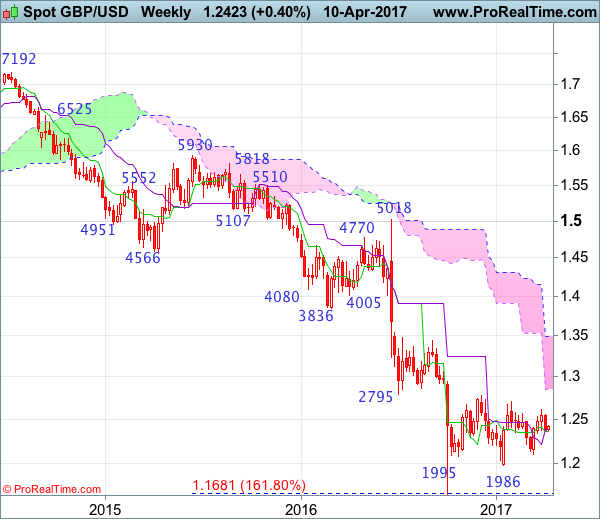
Weekly
• Last Candlesticks pattern: Shooting star
• Time of formation: 5 Sep 2016
• Trend bias: Down
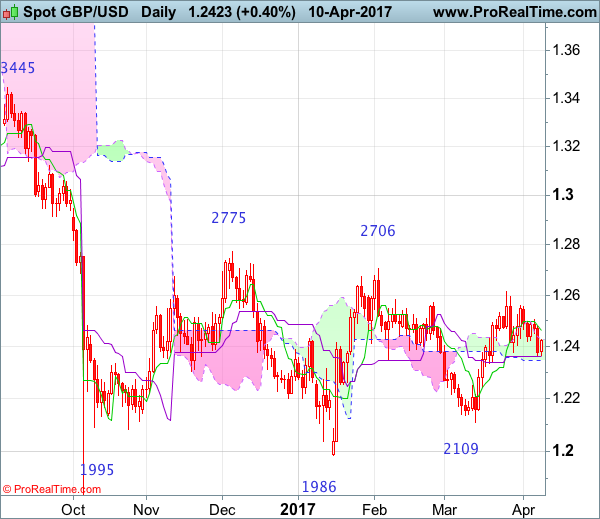
Daily
• Last Candlesticks pattern: Long black candlestick
• Time of formation: 24 Jun 2016
• Trend bias: Down
GBP/USD – 1.2409
The British pound met renewed selling interest just above 1.2500 level and has slipped again, suggesting near term downside risk remains for the erratic fall from 1.2616 to bring at least a retracement of recent upmove to previous support at 1.2335, once this level is penetrated, this would signal the rise from 1.2109 has ended, then weakness to 1.2240-50 would follow but downside should be limited to 1.2190-00 and bring rebound later this month.
On the upside, whilst initial recovery to 1.2450-60 cannot e ruled out, reckon 1.2480 would limit upside and resistance at 1.2506 should hold from here, bring another decline. A daily close above said resistance at 1.2506 would bring risk rebound to 1.2555-60 but only a break above there would signal the retreat from 1.2616 has ended and revive bullishness for retest of this level first, break there would extend the rise from 1.2109 to 1.2650, however, as broad outlook remains consolidative, reckon upside would be limited and price should falter well below indicated previous resistance at 1.2706, bring retreat later. In the event cable is able to penetrate resistance at 1.2706, this would retain bullishness and extend the erratic rise from 1.1986 low towards another previous resistance at 1.2775 first.
Recommendation: Stand aside for this week.
On the weekly chart, although last week’s decline from 1.2506 formed a black candlestick and further consolidation below resistance at 1.2616 would be seen with initial downside bias for weakness to 1.2335 support, break there is needed to add credence to our view that rebound from 1.2109 has ended, bring further fall to 1.2240-50, then 1.2200. Looking ahead, a drop below 1.2109 support is needed to retain bearishness and suggest medium term downtrend has resumed for weakness towards recent low at 1.1986.
On the upside, expect recovery to be limited to 1.2480-85 and resistance at 1.2506 should hold, bring another decline. Above said resistance 1.2506 would bring test of 1.2559, however, break there is needed to signal the retreat from 1.2616 has ended, bring retest of this level first. Once this resistance is penetrated, this would revive previous near term bullish view that another leg of corrective rise from 1.1986 low is underway and extend gain to 1.2706 resistance but only break there would provide confirmation, bring retracement of early downtrend for test of previous resistance at 1.2775 and later 1.2850-60 but price should falter well below psychological resistance at 1.3000.
USD/CHF Candlesticks and Ichimoku Analysis
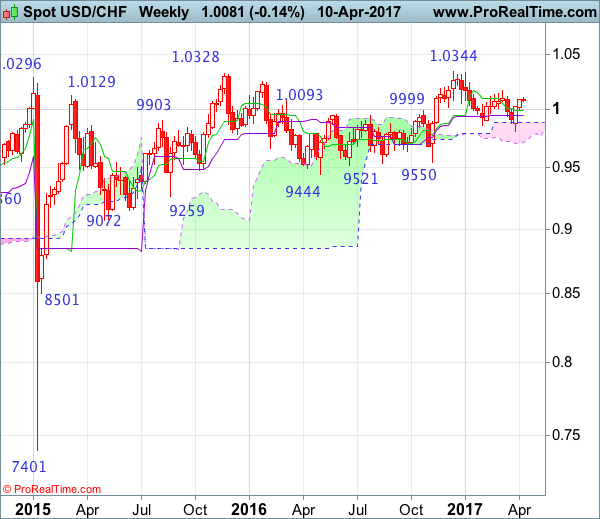
Weekly
• Last Candlesticks pattern: Doji
• Time of formation: 26 Sep 2016
• Trend bias: Sideways
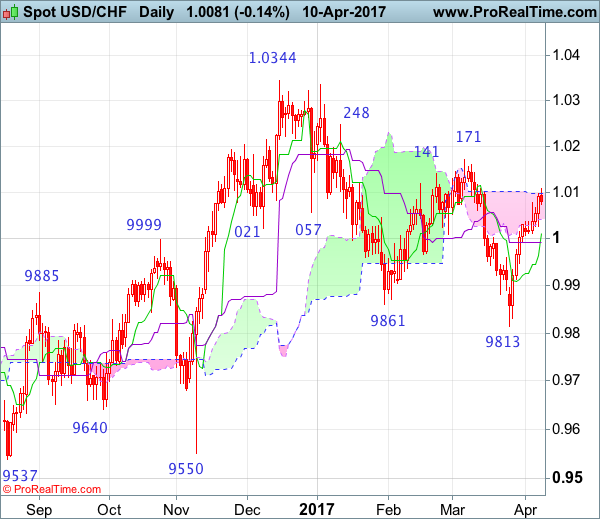
Daily
• Last Candlesticks pattern: Shooting star
• Time of formation: 25 Oct 2016
• Trend bias: Near term up
USD/CHF – 1.0080
As the greenback has maintained a firm undertone after recent rally, adding credence to our view that low has been formed at 0.9813 last month and bullishness remains for the rise from there to extend gain towards resistance at 1.0171, however, a sustained breach above there is needed to add credence to our view that the erratic decline from 1.0344 top has ended at 0.9813, bring further rise to 1.0200-10, then 1.0250 but price should falter well below said resistance at 1.0344 (2016 high).
On the downside, whilst initial pullback to 1.0040-45 and possibly the Tenkan-Sen (now at 1.0011) cannot be ruled out, reckon the Kijun-Sen (now at 0.9992) would contain downside and bring another rise later. Below 0.9890-00 would abort and signal the rebound from 0.9813 has ended, bring another fall to this level. Looking ahead, only a drop below said support at 0.9813 would revive bearishness and signal the decline from 1.0344 top has resumed instead and extend further fall to 0.9735-40 (76.4% retracement of 0.9550-1.0344) and later towards 0.9700 but reckon 0.9650-60 would hold.
Recommendation: Buy at 0.9990 for 1.0190 with stop below 0.9890.
On the weekly chart, as the greenback continued moving higher after staging a strong rebound from 0.9813, another white candlestick was formed, adding credence to our view that low has been formed at 0.9813 last month and consolidation with mild upside bias remains for further gain to resistance at 1.0171, however, a weekly close above this level is needed to confirm the fall from 1.0344 top has ended at 0.9813, bring further subsequent rise towards key resistance at 1.0248. A sustained breach above this level would signal early upmove has possibly resumed, bring test of 1.0335-44 resistance area, above there would provide confirmation and headway to 1.0400-10 and later 1.0500 would follow.
On the downside, expect pullback to be limited to the Tenkan-Sen (now at 0.9992) and bring another rise later. A drop below the Kijun-Sen (now at 0.9947) would bring weakness to 0.9890-00 but only below said support at 0.9813 would abort and signal the erratic fall from 1.0344 top is still in progress, bring further decline for retracement of early upmove to 0.9735-40, then towards the lower Kumo (now at 0.9712) but reckon downside would be limited to 0.9640-50 and price should stay well above support at 0.9550.
Forex Technical Analysis: EUR/USD, USD/JPY, GBP/USD
EUR/USD
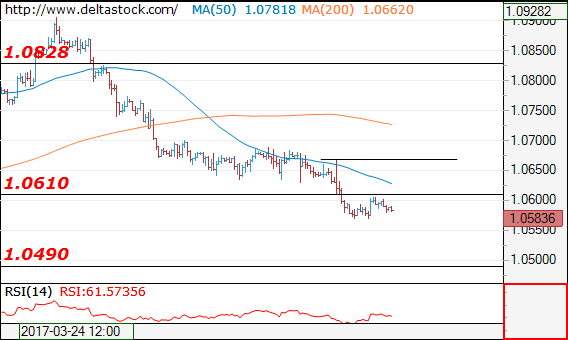
Current level - 10583
The overall bias remains bearish below 1.0610 minor resistance, for a slide towards 1.0490 lows. Crucial on the upside is 1.0668 high.
| Resistance | Support | ||
| intraday | intraweek | intraday | intraweek |
| 1.0667 | 1.0828 | 1.0568 | 1.0490 |
| 1.0700 | 1.0904 | 1.0490 | 1.0340 |
USD/JPY
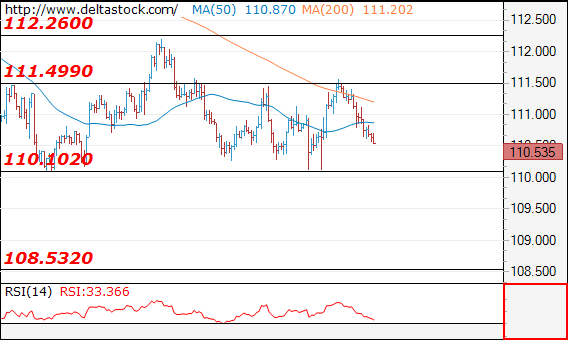
Current level - 110.53
The intraday bias is negative after the reversal at 111.50, but my outlook is counter-trend above 110.10, for another upswing towards 112.00 area. A clear break through 110.10 will signal a renewal of the general downtrend towards 108.50.
| Resistance | Support | ||
| intraday | intraweek | intraday | intraweek |
| 111.50 | 113.50 | 110.10 | 110.10 |
| 112.26 | 115.65 | 110.10 | 107.80 |
GBP/USD
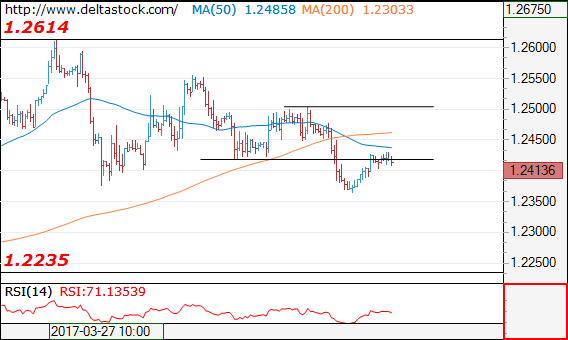
Current level - 1.2413
The intraday bias is slightly positive above 1.2400 and initial resistance lies at 1.2450. Crucial on the upside is 1.2500 area.
| Resistance | Support | ||
| intraday | intraweek | intraday | intraweek |
| 1.2420 | 1.2620 | 1.2330 | 1.2230 |
| 1.2500 | 1.2705 | 1.2235 | 1.2107 |
EUR/USD: Pauses Its Decline
'Uninspiring comments from Fed Chair Janet Yellen.' – Kathy Lien, BK Asset Management (based on investing.com)
Pair's Outlook
On Tuesday morning the common European currency continued to trade just below the 1.06 mark against the US Dollar. The rate remained almost unchanged during Monday's trading session, as the Greenback did not gain strength during the speech with mixed signals given by Janet Yellen. However, the previous technical forecast of a decline of the currency pair remains in force, as on Tuesday the lower Bollinger band has closed in on the rest of the support levels, which surround the 1.0550 level. Due to that reason the way is free for a decline.
Traders' Sentiment
SWFX traders still remain almost neutral, as 52% of open positions are long on Tuesday, compared to 51% previously. Meanwhile, 56% of trader set up orders are to sell the Euro.
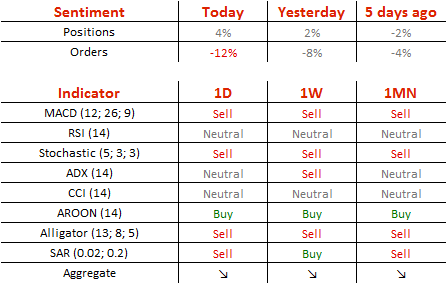
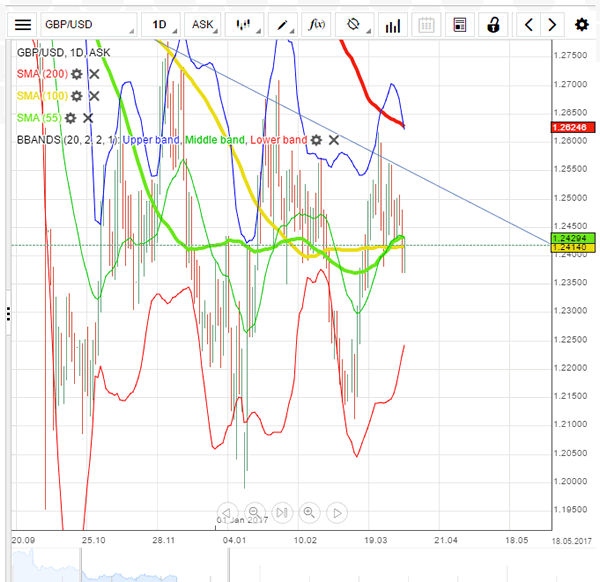
GBP/USD: Downside Risks Persist
'There are still geopolitical concerns, such as the Syrian situation, in the background, and there are no fresh incentives or reasons to buy the dollar.' – Sony Financial Holdings (based on Reuters)
Pair's Outlook
The British currency was able to outperform the US Dollar on Monday, but with gains limited by the tough resistance cluster around 1.2425. This cluster could prevent the Cable from recovering further, with the exchange rate once again slipped under the 1.24 mark, paving its way towards the support area just above 1.23, represented by the weekly S1 and the lower Bollinger band. However, technical indicators are unable to confirm the possibility of the bearish outcome today, thus, there is a chance the Sterling could post gains, but the second supply area, namely the weekly R1 at 1.25, is to remain out of reach.
Traders' Sentiment
There are 57% of traders being long the British Pound today, compared to 61% yesterday. At the same time, the portion of orders to sell the Sterling inched higher, namely from 53 to 56%.
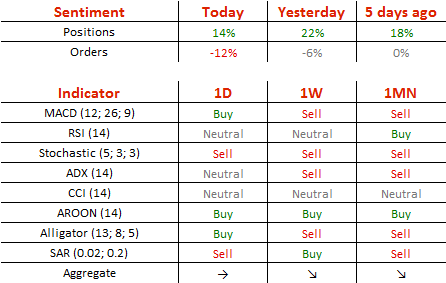
USD/JPY: Continues To Consolidate For The Third Week
'By and large, the yen does tend to appreciate when the situation across markets is one of high volatility, but there has been a squeeze in the yen, which accounts for this anomalous behavior in the sense the yen has outperformed as volatility has been quite benign.' – Societe Generale (based on Market Watch)
Pair's Outlook
The USD/JPY currency pair surprised with its performance on Monday, as it erased all intraday gains and trade closed in the red zone. However, the pair managed to retain its position above the weekly pivot point, but technical indicators keep implying the Buck is to post more losses against the Yen today. Nevertheless, the 110.50 level is expected to be the lowest closing point, even though volatility is likely to stretch even lower. In case the psychological 110.50 mark fails to limit the losses, the weekly S1 at 110.28 is expected to succeed.
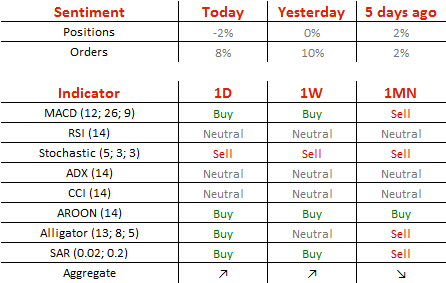
Traders' Sentiment
Although not as strong as yesterday, market sentiment remains bullish, now at 65% (previously 70%). Meanwhile, the portion of orders to acquire the US Dollar lost three percentage points over the day, having fallen to 57%.
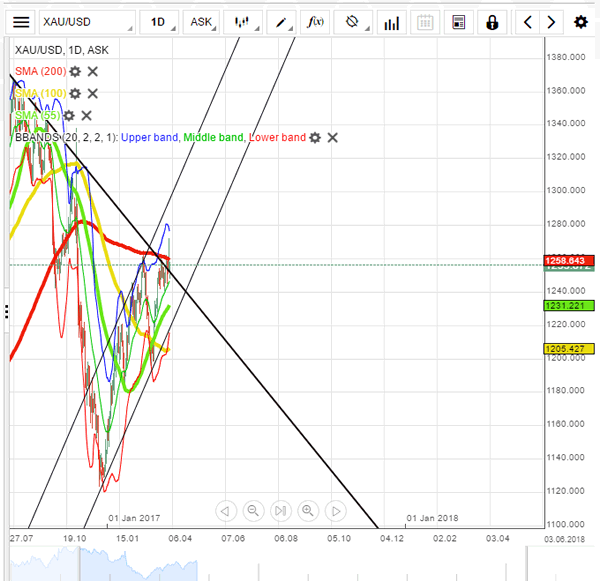
Spot Gold Trades In Established Range
'Gold should retain a measure of support given the political tensions.' – Edward Meir, INTL FCStone (based on Reuters)
Pair's Outlook
During the early hours of Tuesday's trading session the yellow metal continued to trade just below the resistance cluster, which is located near the 1,257 mark. Just as forecasted, on Monday the bullion bounced between the just mentioned cluster and the support provided by the 50.00% Fibonacci retracement level, which is located at the 1,248.96 mark. The fluctuations should continue. However, it is possible, if the political turmoil persists, that the commodity price breaks the resistance put up by the weekly PP at 1,256.96 and the 200-day SMA, which is located at the 1,256.67 mark.
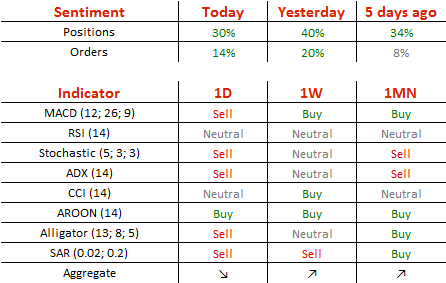
Traders' Sentiment
Traders are still near the neutral zone, as 51% of open positions are short. In the meantime, 54% of trader set up orders are to buy.
Technical Outlook: Cable Is Holding Between 10/30SMA’s And Awaiting UK Inflation Data For Signals
Cable is holding within narrowing daily cloud in early Tuesday and so far unable to break cloud top after bouncing from double downside rejection at 1.2360 (daily Kijun-sen/30SMA). Mixed studies suggest no clear direction, as the pair is stuck between 30 and 10SMA's. Support at 1.2360 also marks 50% retracement of 1.2107/1.2613 upleg and guards another pivotal support at 1.2345 (daily cloud base). The pair is awaiting release of UK inflation data for firmer direction signals. Forecast for annualized CPI for March stands at solid 2.3% and pound is looking for release above, to spark fresh acceleration towards upper pivot at 1.2500 zone. Better than expected inflation numbers today would also support scenario of BOE's early rate hike. Conversely, release below consensus would put sterling under fresh pressure and re-expose lower pivots at 1.2360/45.
Res: 1.2430, 1.2458, 1.2500, 1.2553
Sup: 1.2401, 1.2360, 1.2345, 1.2300
EUR/JPY Daily Outlook
Daily Pivots: (S1) 117.30; (P) 117.68; (R1) 117.91; More...
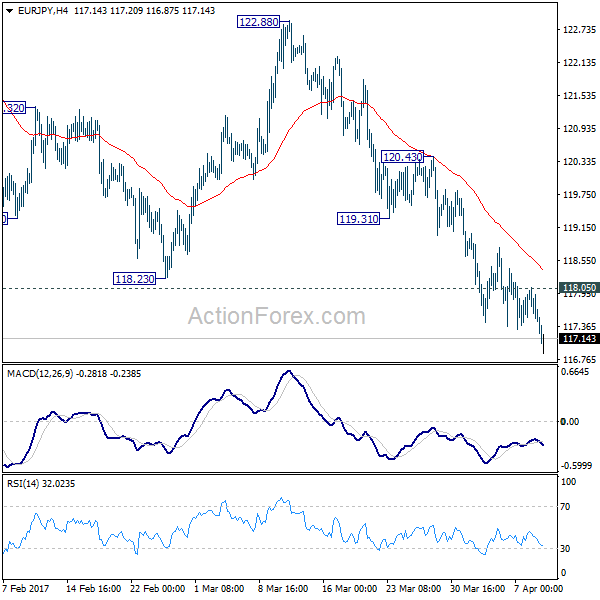
EUR/JPY's fall continues and reaches as low as 116.87 so far. Intraday bias remains on the downside. Whole fall from 124.08 should target 61.8% retracement of 109.20 to 124.08 at 114.88 next. On the upside, above 118.05 minor resistance will turn bias neutral and bring consolidations. But upside should be limited by 119.31 support turned resistance and bring another fall.
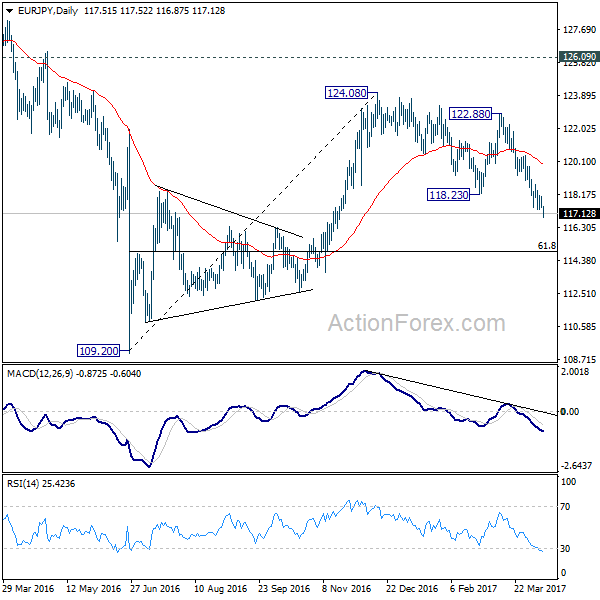
In the bigger picture, the firm break of 38.2% retracement of 109.20 to 124.08 at 118.39 indicates that medium term rise from 109.20 is completed at 124.08. That's well below 126.09 key support turned resistance. Also, EUR/JPY failed to sustain above 55 week EMA. Deeper decline would now be seen back to 109.20 low. Overall, the down trend from 149.76 (2014 high) is not completed yet. Break of 109.20 will resume such down trend towards 94.11 low. In any case, break of 126.09 is needed needed to confirm medium term reversal.