Sample Category Title
UK Consumer Spending to be Reined in for Short Term as Inflation Remains on the Up
UK Inflation rose 2.3 percent in March 2017. Although this is unchanged from the rate of growth seen in February, this figure is still above the Bank of England's (BoE) target of 2 percent. As rising cost pressures across the UK economy take their toll, it appears only a matter of time before this figure rises further. All eyes are now on the BoE and whether they will amend interest rates in response.
Ricky Nelson, Head of Corporate Dealing at currency specialists, Halo Financial, commented, "UK Inflation increased 2.3% in March. Although this represents no change from February's figures, food and clothing prices increased sharply, adding to the burden faced by hard-pressed consumers."
"Inflation began to rise following the UK Referendum vote to leave the European Union, which was the catalyst for the rapid fall in the value of the Pound. With inflation now increasing at similar levels to wages, it would suggest that consumer spending will have to be reined in for the short term."
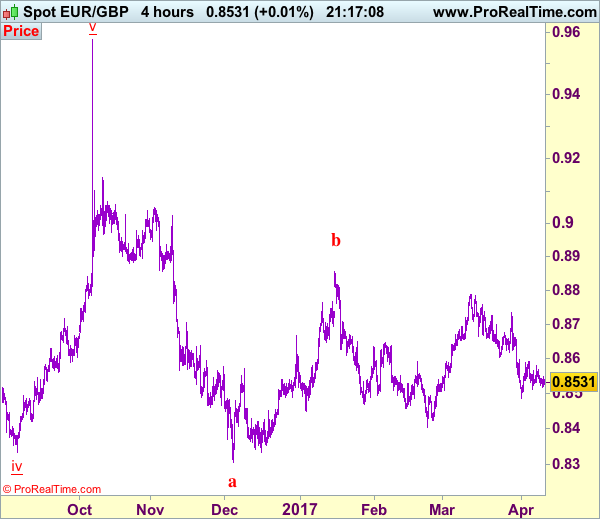
Trade Idea: EUR/GBP – Sell at 0.8620
EUR/GBP - 0.8535
Recent wave: Major double three (A)-(B)-(C)-(X)-(A)-(B)-(C) is unfolding and 2nd (A) has possibly ended at 0.6936.
Trend: Near term down
Original strategy :
Sell at 0.8620, Target: 0.8520, Stop: 0.8660
Position : -
Target : -
Stop : -
New strategy :
Sell at 0.8620, Target: 0.8520, Stop: 0.8660
Position : -
Target : -
Stop : -
The single currency has remained confined within near term established range and further sideways trading is in store, however, euro needs to break 0.8500-10 to retain bearishness and signal the rebound from 0.8485 has ended at 0.8592, bring retest of 0.8485, break there would add credence to our view that top has been formed at 0.8788 and bearishness remains for this fall from there to bring retracement of early upmove, hence further weakness to 0.8470 would be seen but oversold condition should prevent sharp fall below 0.8450.
If said support at 0.8500-10 continues to hold, then further choppy trading would take place and risk of another bounce to 0.8592 cannot be ruled out but upside would be limited to 0.8620-25, bring another decline later. In view of this, we are looking to sell euro on subsequent recovery as 0.8620-25 should limit upside. Only above 0.8660-65 would defer and suggest low is possibly formed, risk rebound to 0.8680, then 0.8700 but price should falter below said resistance at 0.8735, bring further choppy trading later.
Our preferred count is that, after forming a major top at 0.9805 (wave V), (A)-(B)-(C) correction is unfolding with (A) leg ended at 0.8400 (A: 0.8637, B: 0.9491 and 5-waver C ended at 0.8400. Wave (B) has ended at 0.9413 and impulsive wave (C) has either ended at 0.8067 or may extend one more fall to 0.8000 before prospect of another rally. Current breach of indicated resistance at 0.9043 confirms our view that the (C) leg has ended and bring stronger rebound towards 0.9150/54, then towards 0.9240/50.
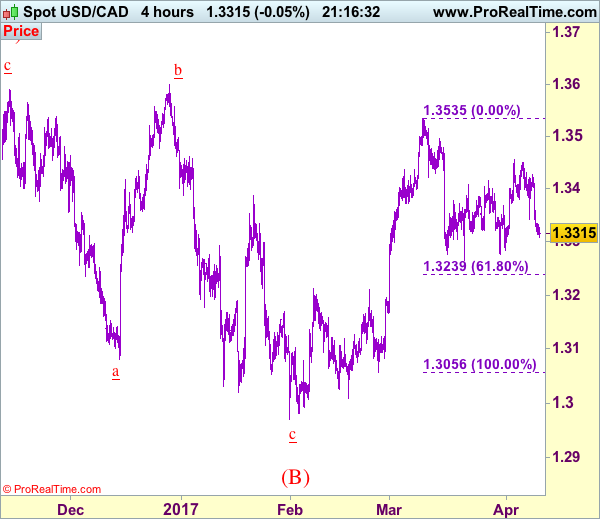
Trade Idea: USD/CAD – Stand aside
USD/CAD - 1.3315
Recent wave: Only wave v of c has ended at 0.9407 and wave C of major A-B-C correction is underway for headway to 1.4700
Trend: Near term up
New strategy :
Stand aside
Position: -
Target: -
Stop:-
As the greenback has remained under pressure after meeting renewed selling interest at 1.3427, initial downside bias remains for test of 1.3277 support, however, a break below this level is needed to signal another leg of decline from 1.3535 top is underway for test of 1.3264, below there would add credence to this view and extend weakness to 1.3235-40 (61.8% Fibonacci retracement of 1.3056-1.3535) and then 1.3200-10.
In view of this, would not chase this fall here and would be prudent to stand aside for now. Above 1.3380-85 would bring test of 1.3430-35 but break there is needed to revive bullishness and bring retest of 1.3456 resistance, break there would add credence to our view that the correction from 1.3535 has ended and bring further gain to 1.3495-00 but break there is needed to signal upmove has resumed for retest of 1.3535, once this level is penetrated, this would extend recent recent upmove from 1.2969 to 1.3575-80 but previous chart resistance at 1.3599 should hold on first testing.
To recap, wave B from 1.3066 is unfolding as an a-b-c and is sub-divided as a: 1.2192, b: 1.2716 and wave c is a 5-waver with i: 1.1983, ii: 1.2506, extended wave iii with minor iii at 1.0206, wave iv ended at 1.0781 and wave v as well as wave iii has ended at 0.9931, hence the subsequent choppy trading is the wave iv which is unfolding as (a)-(b)-(c) with (a) leg of iv ended at 1.0854, followed by (b) leg at 1.0108 and (c) leg as well as the wave iv ended at 1.0674. The wave v is sub-divided by minor wave (i): 0.9980, (ii): 1.0374, (iii): 0.9446, (iv): 0.9913 and (v) as well as v has possibly ended at 0.9407, therefore, consolidation with upside bias is seen for major correction, indicated target at 1.3700 and 1.4000 had been met and further gain to 1.4700 would be seen later.
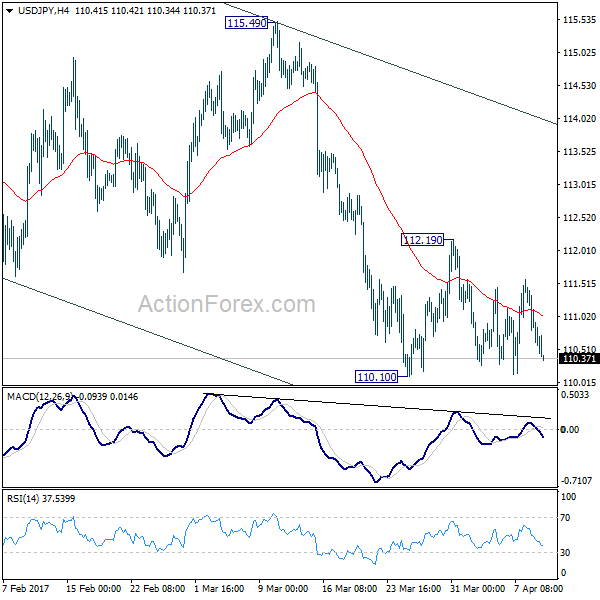
USD/JPY Mid-Day Outlook
Daily Pivots: (S1) 110.62; (P) 111.10; (R1) 111.40; More....
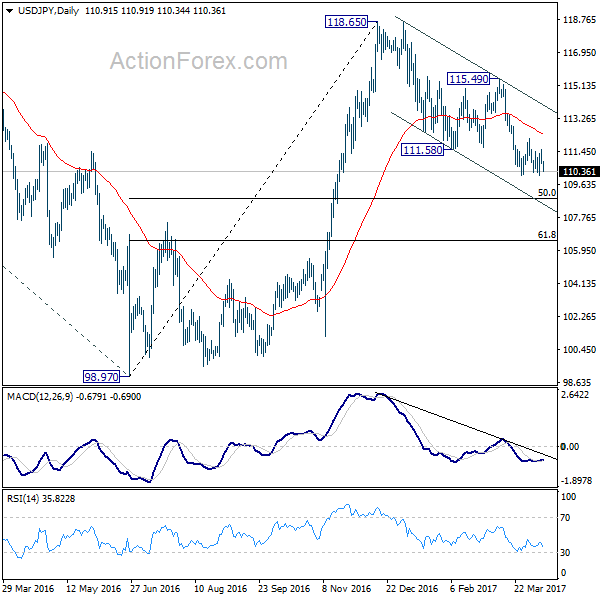
Intraday bias in USD/JPY remains as range trading continues in 110.10/112.19. The pair is staying in the near term falling channel and the correction from 118.65 could extend lower. Below 110.10 will turn intraday bias to the downside for 50% retracement of 98.97 to 118.65 at 108.81. On the upside, however, break of 112.19 resistance will indicate short term reversal and turn bias back to the upside for 115.49 resistance.
In the bigger picture, price actions from 125.85 high are seen as a corrective pattern. The impulsive structure of the rise from 98.97 suggests that the correction is completed and larger up trend is resuming. Decisive break of 125.85 will confirm and target 61.8% projection of 75.56 to 125.85 from 98.97 at 130.04 and then 135.20 long term resistance. Nonetheless, sustained trading below 55 week EMA (now at 111.15) will extend the consolidation from 125.85 with another fall through 98.97 before completion.
GBP/USD Mid-Day Outlook
Daily Pivots: (S1) 1.2377; (P) 1.2402; (R1) 1.2441; More...
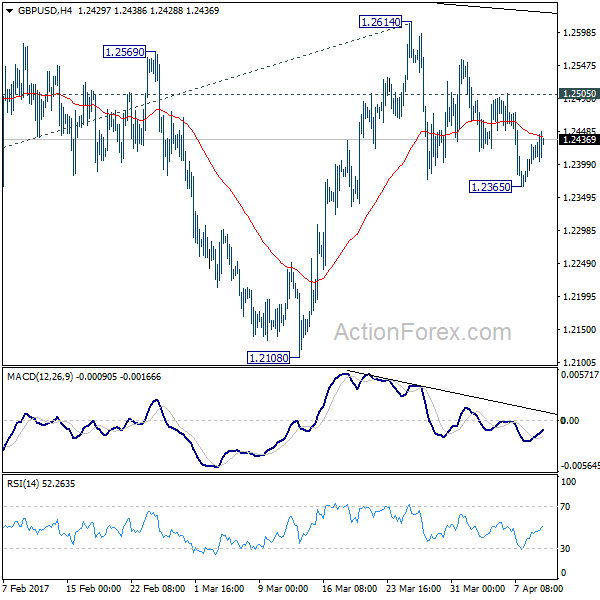
Intraday bias in GBP/USD is turned neutral with current recovery. But deeper decline is still expected with 1.2505 resistance intact. As noted before, triangle pattern from 1.1946 could be finished with five waves to 1.2614. Below 1.2365 will target 1.2108 support first. Decisive break there will argue that medium term down trend is resuming. In that case, GBP/USD should take out 1.1946/1986 support zone to 61.8% projection of 1.5016 to 1.1946 from 1.2614 at 1.0717. On the upside, however, break of 1.2505 resistance will invalidate this immediately bearish case. Then, it will turn bias back to the upside for 1.2614 resistance instead.
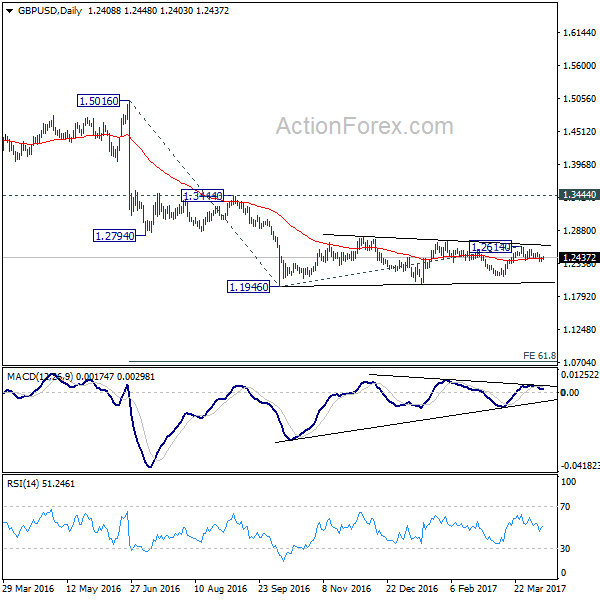
In the bigger picture, fall from 1.7190 is seen as part of the down trend from 2.1161. There is no sign of medium term reversal yet. Sustained trading below 61.8% projection of 2.1161 to 1.3503 from 1.7190 at 1.2457 will target 100% projection at 0.9532. Overall, break of 1.3444 resistance is needed to confirm medium term bottoming. Otherwise, outlook will remain bearish.
USD/CHF Mid-Day Outlook
Daily Pivots: (S1) 1.0071; (P) 1.0089; (R1) 1.0104; More.....
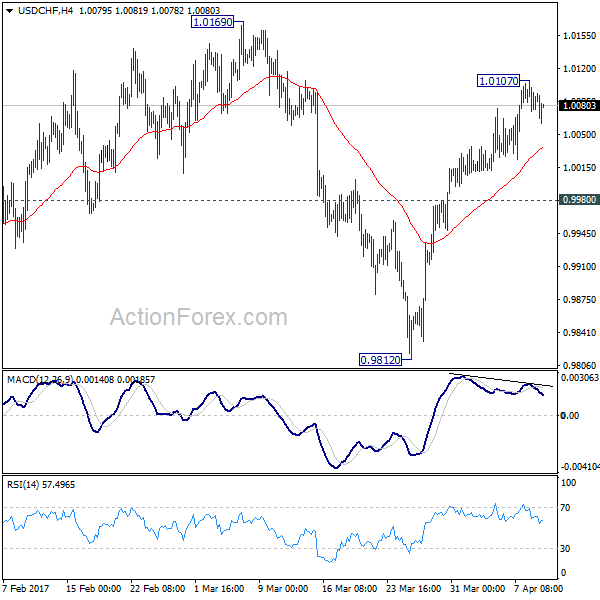
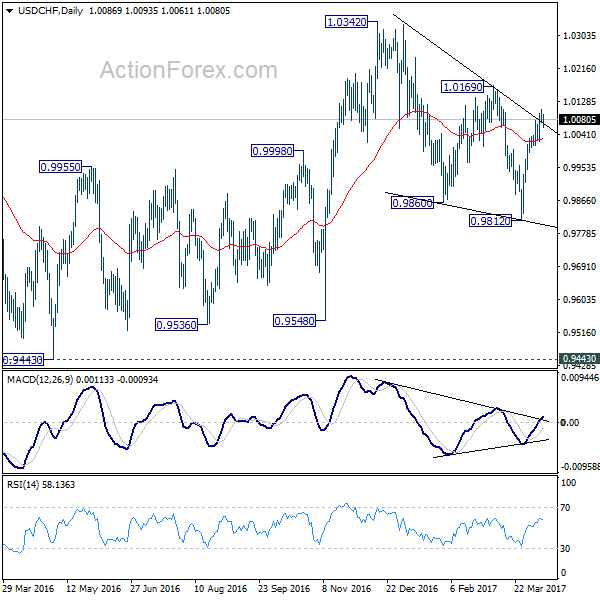
A temporary top is in place at 1.0107 as USD/CHF retreats. Intraday bias is turned neutral for consolidation. Outlook is unchanged that corrective fall from 1.0342 should have finished with three waves down to 0.9812. Hence, downside of retreat should be contained by 0.9980 support and bring rally resumption. Above 1.0107 will target 1.0169 resistance. Decisive break there will confirm this bullish case and target 1.0342 key resistance next. However, below 0.9980 will dampen this bullish case and turn bias back to the downside for 0.9812 low.
In the bigger picture, we're still maintain that firm break of 1.0342 key resistance is needed to confirm underlying bullish momentum in the cross. However, the corrective nature of the fall from 1.0342 to 0.9812 is starting to give the medium term outlook a bullish favor. Hence, in stead of looking for topping signal around 1.0342, we'd now pay closer attention to upside acceleration as USD/CHF approaches this level again.
Trade Idea Update: USD/CHF – Buy at 1.0000
USD/CHF - 1.0080
Original strategy :
Buy at 1.0000, Target: 1.0100, Stop: 0.9965
Position : -
Target : -
Stop : -
New strategy :
Buy at 1.0000, Target: 1.0100, Stop: 0.9965
Position : -
Target : -
Stop : -
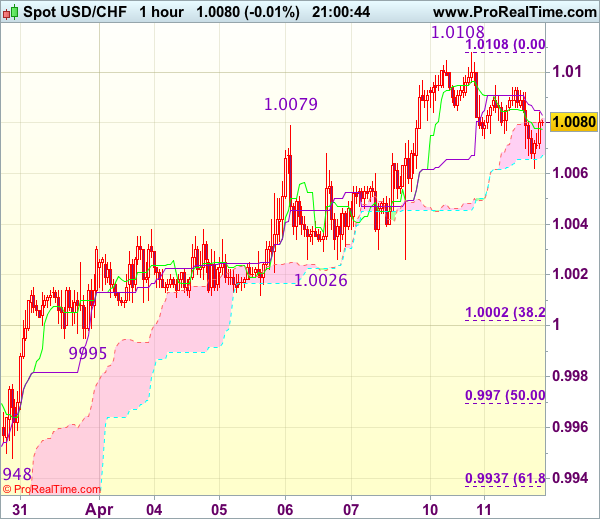
As the greenback has retreated after rising to 1.0108 yesterday, suggesting consolidation below this level would be seen and initial downside risk is for pullback to 1.0050, then towards support at 1.0026, however, reckon 0.9995 support would contain weakness and bring another rise later, above indicated resistance at 1.0108-09 would extend recent upmove from 0.9813 towards 1.0140-45 but loss of upward momentum should prevent sharp move beyond another previous resistance at 1.0171, risk from there has increased for a retreat to take place later.
In view of this, would not chase this rise here and would be prudent to buy dollar on subsequent pullback as support at 0.9995 should limit downside. Below 0.9970 (50% Fibonacci retracement of 0.9831-1.0108) would abort and signal top is formed instead, bring correction to support at 0.9948.
Trade Idea Update: GBP/USD – Sell at 1.2475
GBP/USD - 1.2433
Original strategy :
Sell at 1.2475, Target: 1.2375, Stop: 1.2510
Position : -
Target : -
Stop : -
New strategy :
Sell at 1.2475, Target: 1.2375, Stop: 1.2510
Position : -
Target : -
Stop : -
Cable’s rebound after finding good support around 1.2365-66 has retained our view that further consolidation above this level would be seen and gain to 1.2445-50 cannot be ruled out, however, reckon 1.2475-80 would limit upside and bring another decline later, below said support at 1.2365-66 would extend recent decline from 1.2616 to 1.2350, then towards 1.2325-30 but oversold condition should limit downside and reckon 1.2300 would hold from here.
In view of this, would not chase this fall here and would be prudent to sell cable on further subsequent recovery as 1.2475-80 should limit upside. Only break of resistance at 1.2506 would abort and signal low is formed, bring a stronger rebound to 1.2525-30 first.

Trade Idea Update: EUR/USD – Sell at 1.0665
EUR/USD - 1.0613
Original strategy :
Sell at 1.0665, Target: 1.0565, Stop: 1.0700
Position : -
Target : -
Stop : -
New strategy :
Sell at 1.0665, Target: 1.0565, Stop: 1.0700
Position : -
Target : -
Stop : -
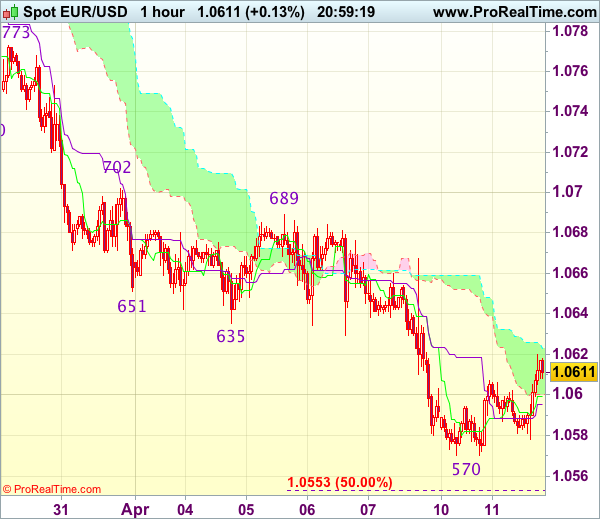
As the single currency has continued trading defensively after recent selloff, suggesting recent decline may resume after consolidation, although corrective bounce to 1.0625-35 cannot be ruled out, however, reckon upside would be limited to 1.0667 resistance (Friday’s high) and bring another decline later, below support at 1.0570 would extend the decline from 1.0906 to 1.0550-55 (50% projection of 1.0906-1.0635 measuring from 1.0689), then 1.0525-30 but near term oversold condition should prevent sharp fall below 1.0500, risk from there is seen for a rebound later.
In view of this, would not chase this fall here and would be prudent to sell dollar on further recovery as 1.0667 resistance should limit upside. Only a firm break above said resistance at 1.0667 would abort and suggest low is formed instead, risk a stronger rebound to 1.0689, then 1.0702.
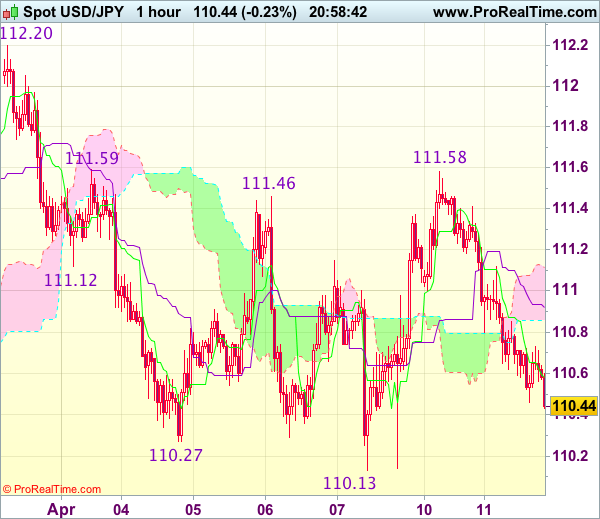
Trade Idea Update: USD/JPY – Hold long entered at 110.60
USD/JPY - 110.43
Original strategy :
Bought at 110.60, Target: 111.60, Stop: 110.25
Position : - Long at 110.60
Target : - 111.60
Stop : - 110.25
New strategy :
Hold long entered at 110.60, Target: 111.60, Stop: 110.25
Position : - Long at 110.60
Target : - 111.60
Stop : - 110.25
Although dollar has remained under pressure after retreating sharp from yesterday’s high of 111.58 and marginal weakness from here cannot be ruled out, reckon 110.25-30 would contain downside and bring another rebound later, above 111.10-15 would suggest the retreat from 111.58 has ended, bring test of 111.58-59 resistance, break there would add credence to our view that further consolidation above recent low at 110.11 would be seen and signal the fall from 112.20 has ended, then a stronger rebound to 111.90-00 would follow but said resistance at 112.20 should hold and choppy trading within 110.11-112.20 would continue.
In view of this, we are holding on to our long position entered at 110.60 but one should exit on such rebound. Below 110.25-30 would risk test of said support at 110.11-13 but only break there would confirm medium term decline has resumed for further subsequent fall to 109.80-85 (1.618 times projection of 112.20-111.12 measuring from 111.59), however, price should hold above 109.50-55 (100% projection of 112.20-110.27 measuring from 111.46).