Sample Category Title
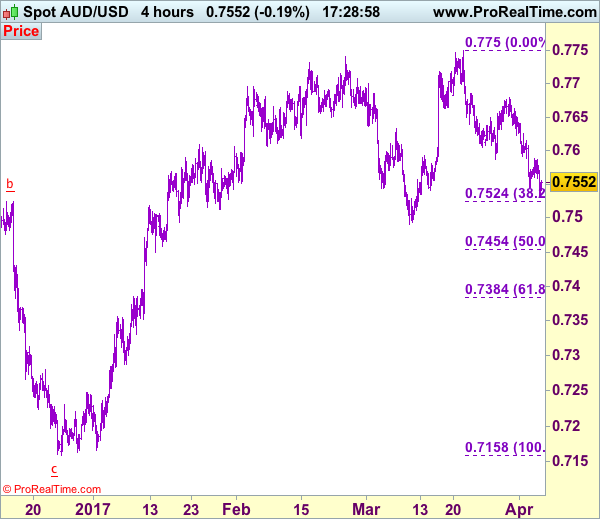
Trade Idea: AUD/USD – Buy at 0.7525
AUD/USD – 0.7552
Recent wave: Wave 5 ended at 1.1081 and major correction has commenced for fall to 0.7000 and then towards 0.6500-10
Trend: Near term up
Original strategy :
Sell at 0.7605, Target: 0.7410, Stop: 0.7665
Position: -
Target: -
Stop: -
New strategy :
Buy at 0.7525, Target: 0.7680, Stop: 0.7465
Position: -
Target: -
Stop:-
Although aussie has fallen again after brief recovery to 0.7588 and near term downside risk remains for the fall from 0.7750 to extend weakness to 0.7520-25 (38.2% Fibonacci retracement of 0.7158-0.7750), loss of near term downward momentum should prevent sharp fall below there and reckon indicated support at 0.7491 would hold, bring rebound later, above said resistance at 0.7588 would suggest a temporary low is possibly formed, bring rebound to 0.7625-30 and later towards resistance at 0.7680-85.
In view of this, we are inclined to buy aussie on next decline. Below said support at 0.7491 would signal the fall from 0.7750 is still in progress for further weakness to 0.7450-55 (50% Fibonacci retracement of 0.7158-0.7750), however, oversold condition should limit downside to 0.7380-85 (61.8% Fibonacci retracement), risk from there is seen for a rebound later.
On the 4-hour chart, the move from 0.8066 is the wave 5 with i: 0.8860, ii: 0.8315, wave iii is an extended move ended at 1.0183, iv: 0.9706 and wave v has ended at 1.1081 (also the top of entire wave 5). The subsequent selloff is the major correction which is unfolding as ABC-X-ABC and 2nd A leg has ended at 0.8848, followed by a-b-c wave B which ended at 0.9758, hence, 2nd C wave is now in progress and indicated downside target at 0.7000 and 0.6950 had been met, so further fall to 0.6710-20 cannot be ruled out.
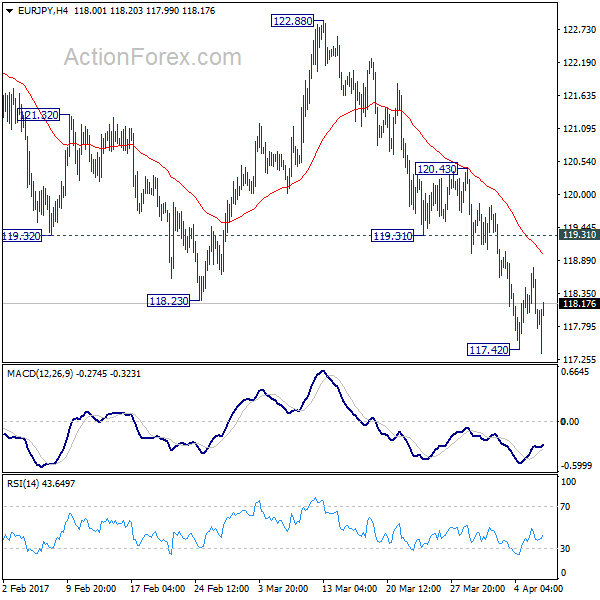
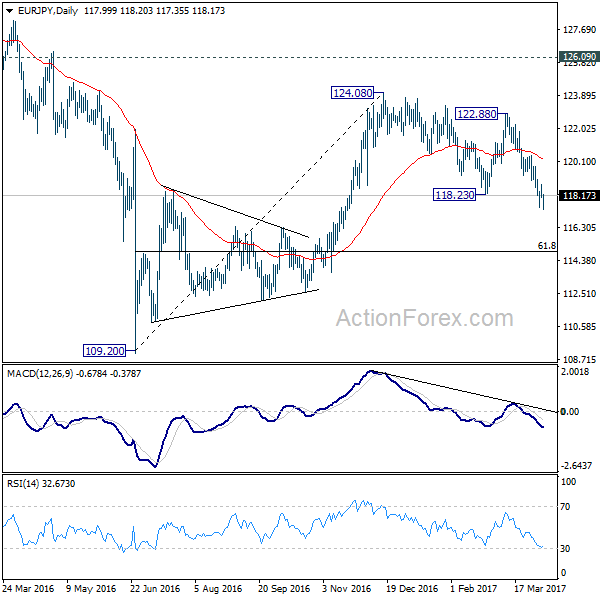
EUR/JPY Daily Outlook
Daily Pivots: (S1) 117.77; (P) 118.27; (R1) 118.54; More...
With 119.31 support turned resistance intact, deeper fall is expected in EUR/JPY. Current development suggests that medium term rise from 109.20 has completed at 124.08 already. Below 117.42 will target 61.8% retracement of 109.20 to 124.08 at 114.88 next. Nonetheless, sustained break of 119.31 will turn focus back to 120.43 resistance instead.
In the bigger picture, the firm break of 38.2% retracement of 109.20 to 124.08 at 118.39 indicates that medium term rise from 109.20 is completed at 124.08. That's well below 126.09 key support turned resistance. Also, EUR/JPY failed to sustain above 55 week EMA. Deeper decline would now be seen back to 109.20 low. Overall, the down trend from 149.76 (2014 high) is not completed yet. Break of 109.20 will resume such down trend towards 94.11 low. In any case, break of 126.09 is needed needed to confirm medium term reversal.
Technical Outlook: FTSE100 – Break Into Daily Cloud Weakens Near-Term Structure
FTSE broke into daily cloud in extension of Wednesday's strong fall (the biggest one-day loss since 21 Mar).
Fresh weakness on strengthening pound neutralized hopes of stronger upside action, signaled by Diamond bottom pattern that usually signals reversal.
Instead, the price penetrated daily cloud top which underpinned the rally since mid-Dec 2016, and re-focus key support at 7179 (27 Mar correction low / bottom of near-term 7179/7315 congestion, also near Fibo 61.8% of 7024/7444 upleg).
Wednesday's long bearish candle weighs on near-term action, with repeated close in daily cloud, needed to maintain bearish pressure.
Sustained break below 7179 trigger would signal continuation of correction from 7444 (01 Mar fresh record high).
Broken daily cloud top and Tenkan-sen line (7141/47 respectively) mark solid barriers which are expected to ideally cap.
Conversely, lift above daily Tenkan-sen would ease immediate bearish pressure and re- focus upper pivots at 7280 and 7311.
Res: 7241, 7247, 7280, 7311
Sup: 7195, 7179, 7123, 7100
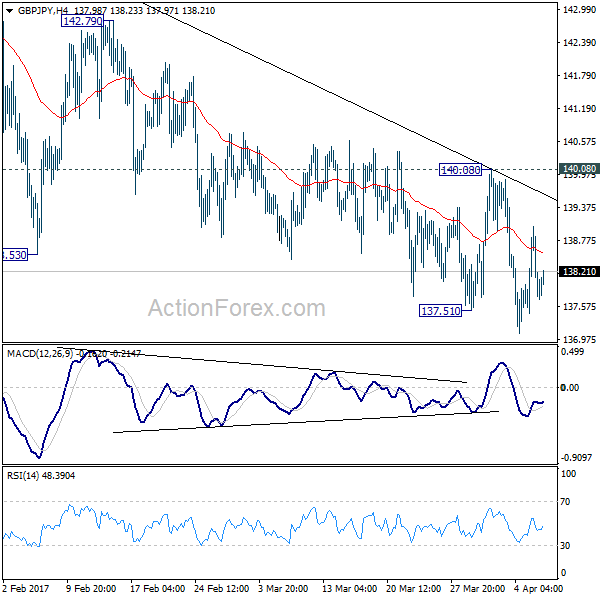
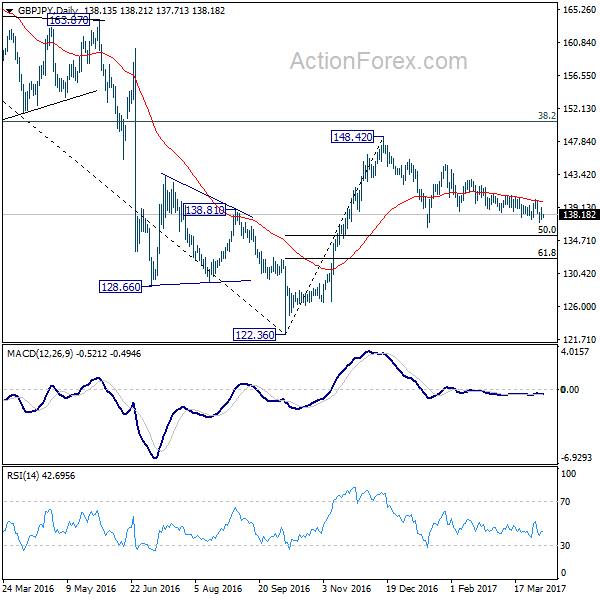
GBP/JPY Daily Outlook
Daily Pivots: (S1) 137.41; (P) 138.22; (R1) 139.00; More...
With 140.08 resistance intact, further fall is expected in GBP/JPY. Decline from 144.77 would target medium term fibonacci level at 135.39. Overall, price action from 148.42 are seen as a consolidation pattern. We'll look for bottoming around 135.39. Meanwhile, break of 140.08 resistance is needed to indicate short term reversal. Otherwise, outlook will remain bearish in case of recovery.
In the bigger picture, price actions from 122.36 medium term bottom are still seen as a corrective pattern. Main focus is on 38.2% retracement of 195.86 to 122.36 at 150.42. Rejection from there will turn the cross into medium term sideway pattern. Or, sustained break of 50% retracement of 122.36 to 148.42 at 135.39 will turn outlook bearish for a test on 122.36 low. Though, sustained break of 150.42 will extend the rebound towards 61.8% retracement of 195.86 to 122.36 at 167.78.
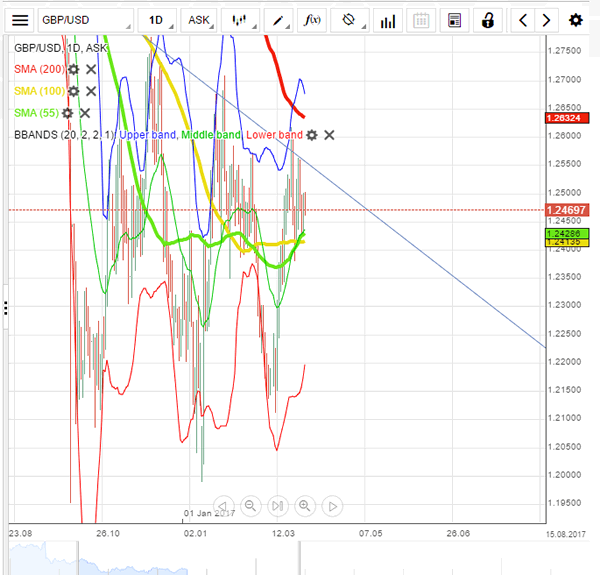
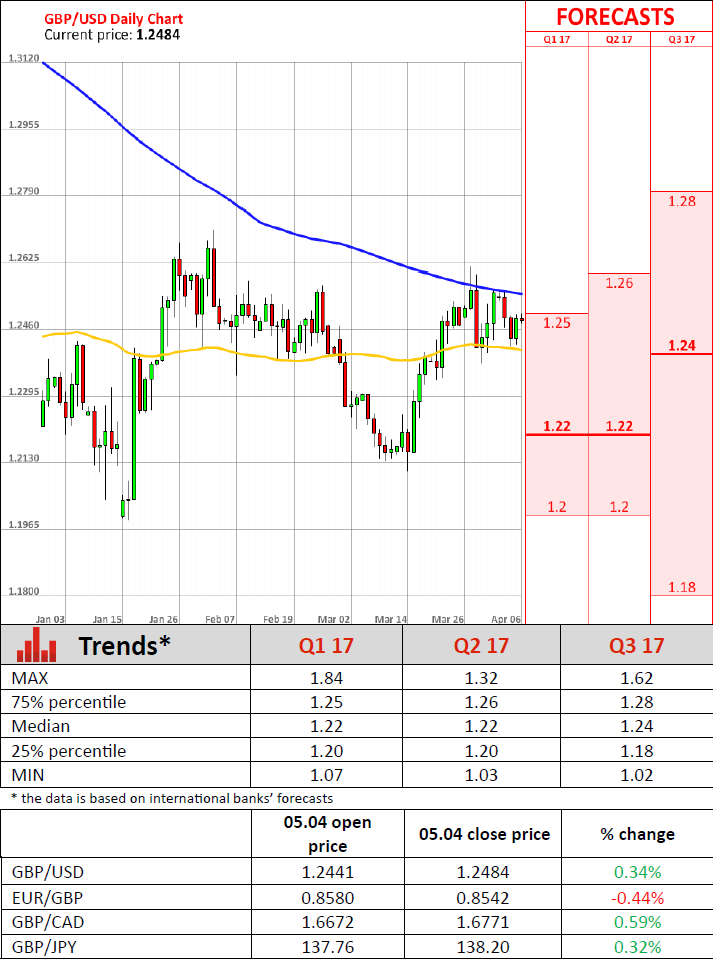
GBP/USD: Attempts To Retake 1.25
'We do not believe the USD will weaken through key technical and psychological levels in the coming month.' – HSBC (based on PoundSterlingLive)
Pair's Outlook
Even though the ADP data surprised to the upside yesterday, the FOMC Minutes weighed on the US Dollar, allowing the Pound to erase most of Tuesday's losses. Another positive development is expected today, with the Cable reclaiming the 1.25 major level. However, there are doubts the exchange rate will be able to stabilise above the 1.2516 mark, namely the weekly PP, as there are no solid market drivers present today. On the other hand, the Buck has a tendency of strengthening the day ahead of the NFP data; therefore, a slide back towards the support cluster circa 1.2425 is not out of the question.
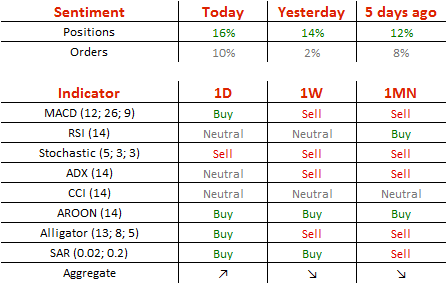
Traders' Sentiment
Traders' sentiment remains bullish, now with 58% of all open positions being long (previously 57%). At the same time, the share of purchase orders inched up from 51 to 55%.
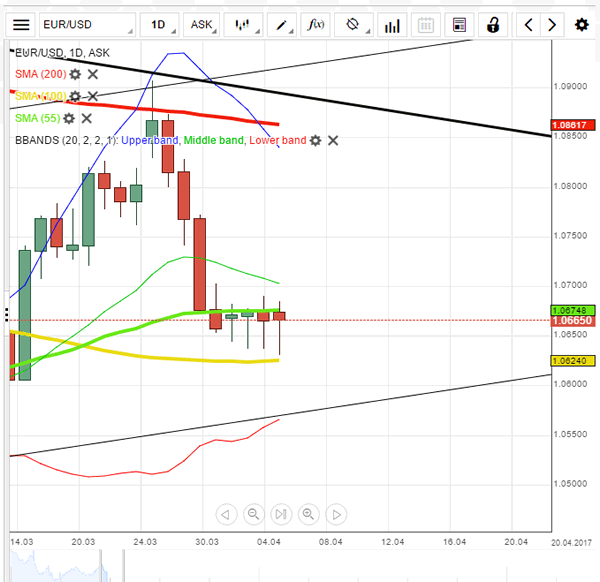
EUR/USD: Trades In Established Range
'The FOMC minutes were clear that officials are contemplating beginning to address the balance sheet.' – March Chandler, Brown Brothers Harriman (based on investing.com)
Pair's Outlook
On Thursday morning the common European currency traded against the US Dollar below the resistance cluster, which it faced previously. The currency exchange rate has been trading in the same range since April 2, as it is squeezed in between the resistance put up by the 55-day SMA at 1.0674, together with the monthly PP at 1.0685, and the support of the 23.60% Fibonacci retracement level, which is located at the 1.0639 level. The pair is set to continue the fluctuations between the two mentioned levels until a fundamental event sets the pairs future course.
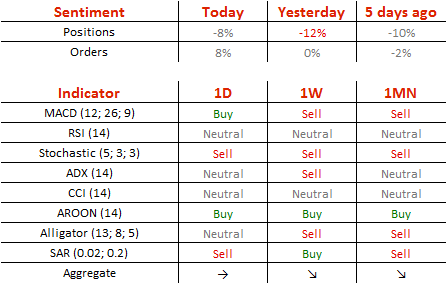
Traders' Sentiment
SWFX traders remain bearish on the pair, as 54% of open positions are short. However, 54% of trader set up orders are to buy the Euro.
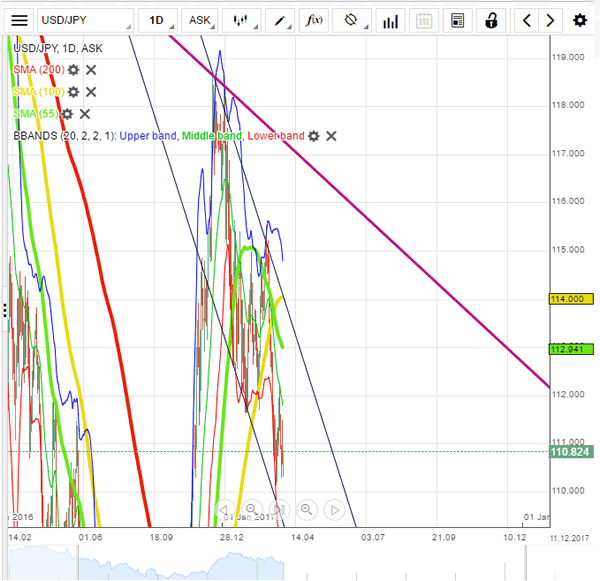
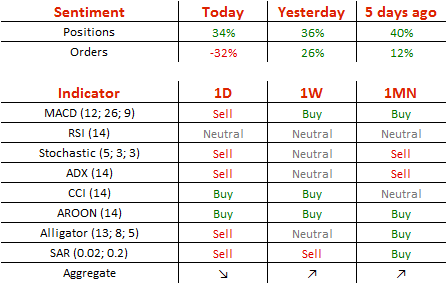
USD/JPY: Stuck Around 110.75
'The foreign exchange market's main focus remains whether or not Trump can carry out his policies, and whether the U.S. economy will stay strong enough for the Fed to stick to the path of rate hikes.' – Sony Financial Holdings (based on Business Recorder)
Pair's Outlook
The USD/JPY currency pair weakened for the fourth time in a row yesterday, unable to maintain trade in the green zone. According to technical studies, another leg down should take place, however, that might not be the case. The weekly S1 is providing immediate support at 110.27, while the 110.50 level is providing additional psychological support, which altogether could help the Greenback to post a mild recovery. Nevertheless, gains are unlikely to exceed 50 pips, as the weekly PP represents the upper border at 111.23. The pair is expected to remain within this trading range, namely between the weekly S1 and PP.
Traders' Sentiment
Although not as strong as yesterday, but market sentiment remains bullish at 67%. The portion of sell orders surged from 37 to 66%.
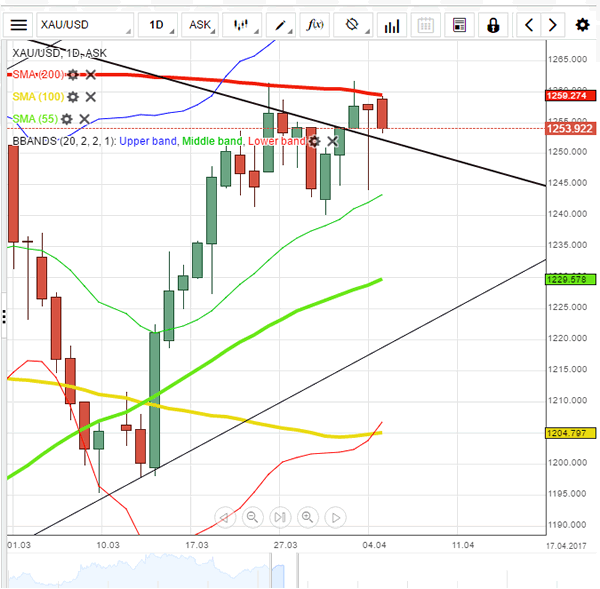
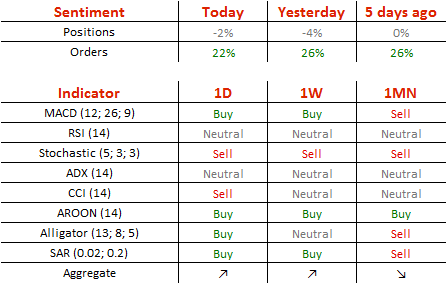
XAUUSD: Struggles Above 1,250 Mark
'It is kind of looking like gold is running out of steam in the short term.' – JJeffrey Halley, OANDA (based on Reuters)
Pair's Outlook
During the early hours of Thursday's trading session the yellow metal's price made another attempt to break higher. However, after a successful passing of the 200-day SMA the commodity price did not manage to reach the weekly R1, which is located at the 1,259.70 level. After the attempt the metal's price began a decline back below the mentioned levels of significance. It is likely that the bullion will retreat down to the support levels, which are located near the 1,250 mark. There it is most likely going to find support, as it did the same exact thing on Wednesday.
Traders' Sentiment
Traders are neutral bearish on Thursday, as 51% of open positions are short. Meanwhile, 61% of trader set up orders are to buy.
UK Services PMI Rises To Three-Month High
'The survey data indicate that UK business activity growth regained some momentum after having slipped to a five-month low in February, but the upturn fails to change the picture of an economy that slowed in the first quarter.' - Chris Williamson, IHS Markit
The PMI for the British services sector surprised many experts, who did not expect any significant change in March. According to IHS Markit, the PMI soared to 55.0 while analysts forecasted only a minor increase to 53.5. Thus, the PMI remained above the no-change value for the eighth consecutive month. This result showed that activity in the British services sector rebounded from five-month lows registered in the previous month. In March, business activity and new work creation grew at the fastest pace this year, so far. According to Markit, it was attributable to greater customers' demand and favourable economic conditions, such as the weak Pound. In fact, especially high demand on British services was recorded in the United States. The overall sentiment about business prospects among the surveyed companies remained positive. Thus, half of the respondents believed that their business activity would improve in the year-ahead. However, some companies continued to complain about the Brexit-related anxiety, which precluded investment inflows. Moreover, average prices charged by service providers increased at the highest rate since 2008, as input costs surged markedly in the recent months. In addition, experts also recorded the weakest job creation since August 2016.
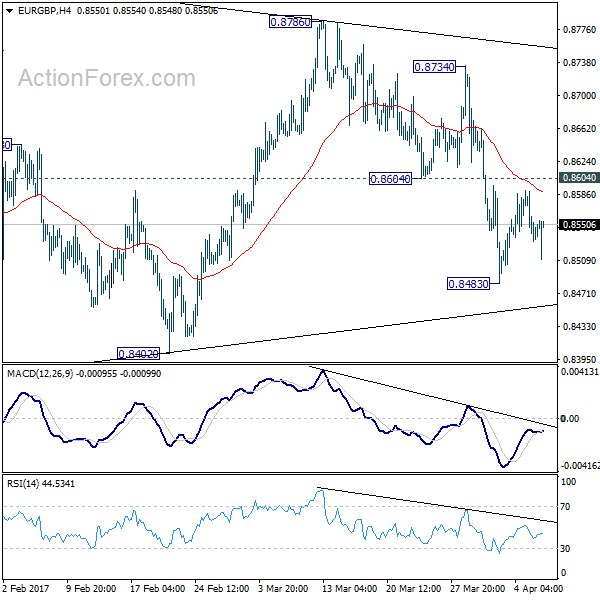
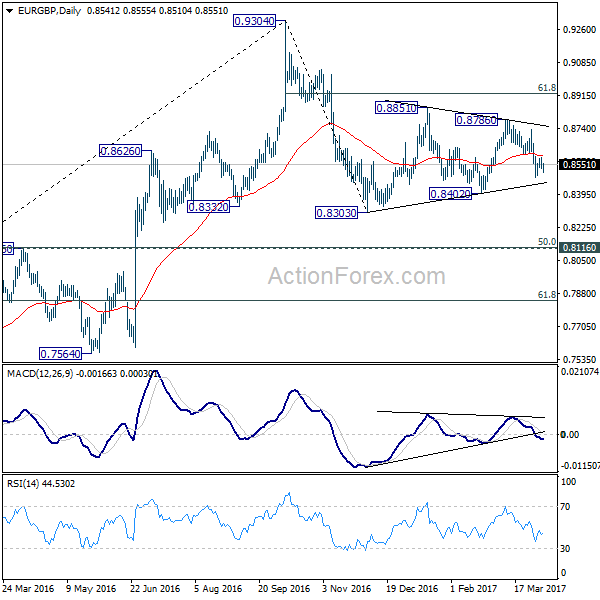
EUR/GBP Daily Outlook
Daily Pivots: (S1) 0.8517; (P) 0.8554; (R1) 0.8576; More...
EUR/GBP is staying in consolidation above 0.8483 and intraday bias stays neutral first. There is no change in the view that price actions from 0.8303 are a consolidation pattern. And, it's the second leg of the correction from 0.9304. Below 0.8430 will target 0.8402. Break of 0.8402 will resume the fall from 0.9304 to 0.8116/20 cluster support, where the correction should end. On the upside, above 0.8604 minor resistance will bring another recovery before fall from 0.9304 resumes.
In the bigger picture, price actions from 0.9304 are viewed as a medium term corrective pattern. Such decline is likely ready to resume and should make a new low below 0.8303. At this point, we'd expect strong support from 0.8116 cluster support (50% retracement of 0.6935 to 0.9304 at 0.8120) to contain downside. Break of 0.9304 will pave the way to 0.9799 (2008 high). However, sustained break of 0.8116 could bring deeper decline to next key support level at 0.7564 before the correction completes.