Sample Category Title
Spot Gold’s Consolidation Phase Poised To Continue
Key Points:
- Near-term slip is forecasted if the current resistance level holds firm.
- Technical bias is near-term bearish but long-term bullish.
- Fundamentals should inspire a rally after the forecasted tumble.
Gold is fast approaching a critical resistance level which could mean we have a few torrid weeks ahead of us. Specifically, on the one hand, the metal's underlying bullish sentiment remains intact which should see it push higher. However, on the other hand, gold is battling against a deteriorating technical bias which might necessitate a slip to the downside in the coming days. As a result, we may need to take a closer look at the metal to get a clearer picture of what is going on.
Firstly, we need to understand whether the bears or the bulls are likely to be in command of the metal in the near-term. At present, the bias seems to be in favour of the bears for a number of reasons. For one, gold prices are battling against a fairly robust zone of resistance that has previously remained unbroken. In addition to this, stochastics are overbought and the MACD is on the cusp of having a bearish signal line crossover.
The main technical arguments against near-term bearishness come from two key readings. Namely, the Parabolic SAR and the moving average bias which are both still rather bullish. However, these are unlikely to be able to counteract a swing against the metal. In the Parabolic SAR's case, the indicator is very close to inverting and, indeed, recent price action almost did manage to cause such a switch in bias. As for the moving averages, these are more indicative of long-term bullishness and, therefore, are unlikely to present a major impediment to the forecasted slip.
Overall, we expect that selling pressure should see the pair move back to the 1228.24 handle prior to the downside of the pennant capping losses. A breakout past this point is not expected which is due, in part, to the presence of the 50.0% Fibonacci retracement level. Although, the 100 day EMA is likely to intersect the trend line at around this price which will further add to support. From a more fundamental perspective, losses should be limited to this level as gold's underlying bullish sentiment remains intact. Said sentiment stems largely from increasing uncertainty in the market place, evidenced by the VIX whose average reading has been creeping steadily higher over the past few months.
As a result of this mixed sentiment, we would expect to see a rather sizable recovery for gold once it has tested the ascending trend line. This recovery should then extend back up to the current zone of resistance which will be intersecting the long-term descending trend line, meaning, either another reversal to the downside or a break out will be on the way fairly soon after. Unfortunately, we will have to take a look at the metal closer to this juncture before we hazard a guess at which is the more likely outcome.
Ultimately, keep an eye on gold as it has both upside and downside potential on offer moving ahead. As mentioned, the initial plunge and subsequent rally should result from a mix of countervailing technical and fundamental forces which could see the 1228.24 mark tested within a week or so. However, monitor both the developing Brexit story and the ever-present influence of Trump as they are sure to continue to impact the metal's performance as well.
NZDJPY: Is An Ending Diagonal About To Complete?
Key Points:
- Kiwi Dollar depreciating strongly against the Japanese Yen.
- RSI Oscillator close to oversold levels.
- Watch for a bounce to breakout of the bearish channel in the days ahead.
The past few months have been relatively rough for the pair as the Kiwi Dollar has traded within a strongly bearish channel that has taken it from a high around 83.50 all the way down to price actions current level at 76.90. However, although things might presently be looking relatively bleak for the pair, it should be noted that there are some technical indicators presenting an interesting case for a short term breakout.
In particular, the RSI Oscillator is currently plumbing oversold levels which implies that we are likely to see, either a short term reversal, or at the minimum a period of moderation. There also appears to be another iteration of an ending diagonal evident on the 4-hr chart which would seems to suggest that a breakout could be afoot over the next few sessions. Subsequently, there are quite a few technical factors suggesting that, at the very least, we may see some moderation in the days ahead.
However, there are still plenty of fundamental bears waiting in the wings given the Yen’s current status as a “safe haven” currency. In addition, the New Zealand Retail Sales figures are also due out early next week which is forecast to contract by around 0.6% m/m. Subsequently, there could be a few negative surprises awaiting the Kiwi Dollar in the coming days.
Regardless, the presence of another ending diagonal, along with RSI nearing oversold levels, would seem to suggest that we could be in the early stages of seeing a short term breakout. Subsequently, the most likely scenario is one where price action rallies to breach to the top of the descending trend line around the 77.50 mark before commencing a run towards the first major resistance point at 78.50. However, it would be prudent to wait for a confirmation candle to close above the trend line before considering any form of entry.
Ultimately, the deep depreciation of the Kiwi Dollar can only go so far before we see some mean reversion in play. At this stage, price action is already depressed enough that a rebound is highly likely, especially given the technical indicators. Subsequently, watch for a bounce to the long side over the next few sessions.
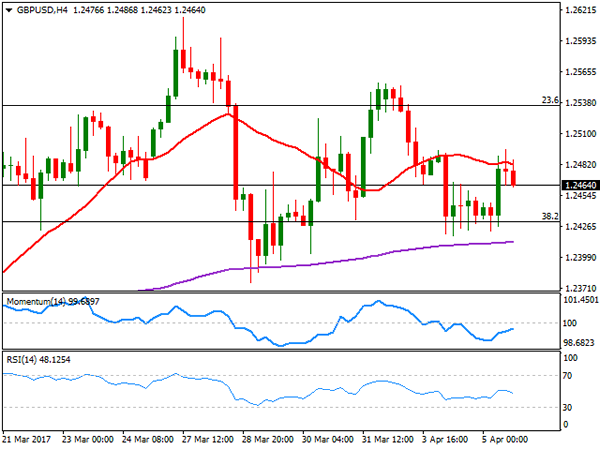
Daily Technical Analysis: GBP/USD Zigzag Challenges 1.25 Resistance Level
Currency pair GBP/USD
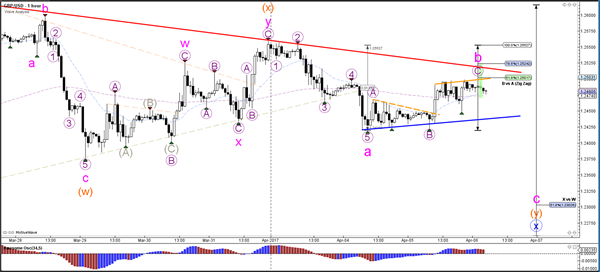
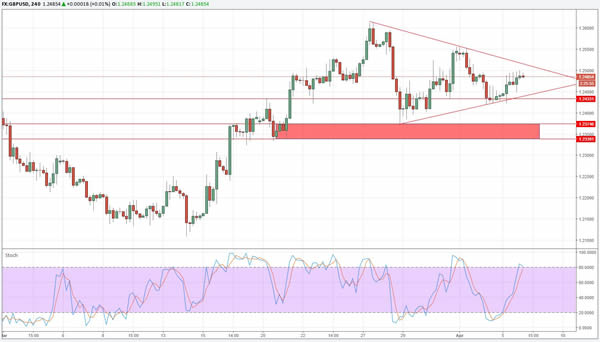
The GBP/USD is building a contracting triangle chart pattern (red/blue lines). A break above resistance (red) could see price complete wave E (green). A break below support (blue) could see price challenge the 61.8% Fibonacci level of wave X vs W (blue).
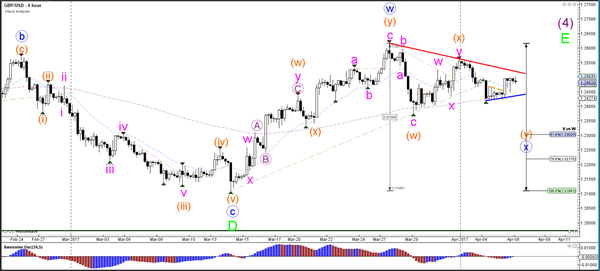
The GBP/USD is probably still in a larger ABC zigzag (pink) within wave X (blue) as long as price does not break the resistance (red) trend line. Price is also at an even 1.25 resistance level. A break below support (blue) could spark the wave C (pink) part of the expected bearish zigzag.
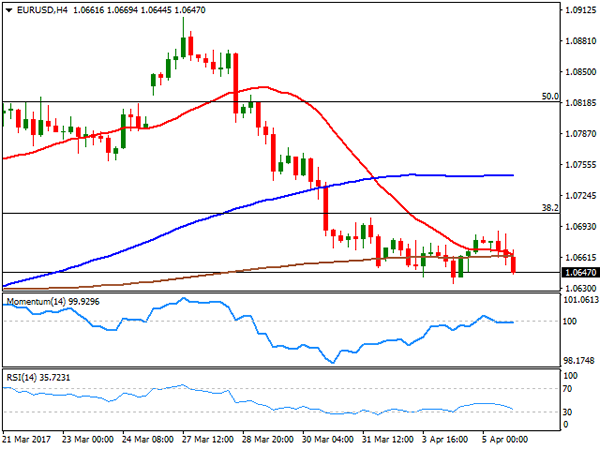
Currency pair EUR/USD
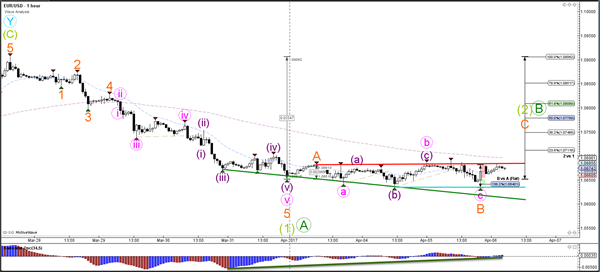
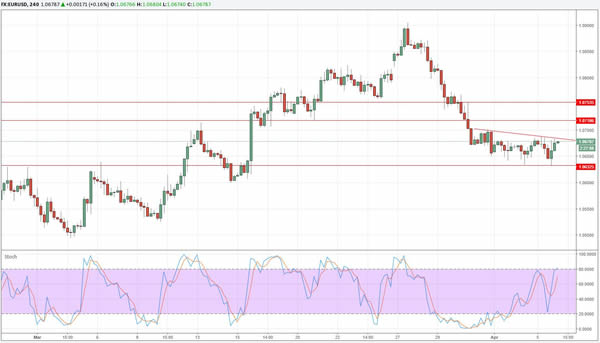
The EUR/USD continues to move sideways between support (light blue) and resistance (red). A break above resistance could see price retrace back to the Fibonacci levels of wave 2 vs 1 (light green) or wave B green) whereas a break below support still has other support levels nearby (blue trend lines).
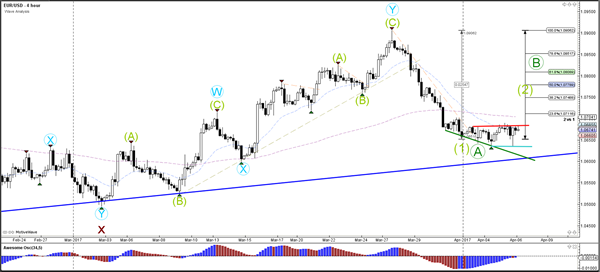
The EUR/USD also continues to show a double divergence between the bottoms of price and the oscillator (green lines), which could spark a retracement. The wave count could still be in a wave ABC (orange) because it did not break below the 138.2% Fibonacci level of wave B vs A (orange).
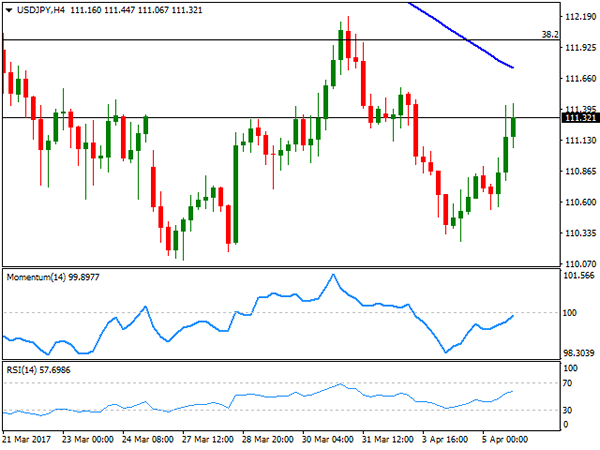
Currency pair USD/JPY
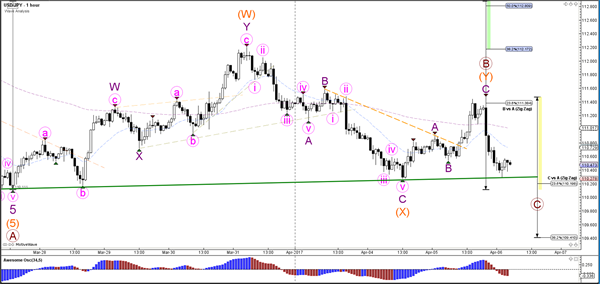
The USD/JPY could have completed the WXY (orange) correction of wave B (brown). A break below support (green) could see price complete wave C (brown) at the 50% Fibonacci level of wave 4 vs 3 (purple).
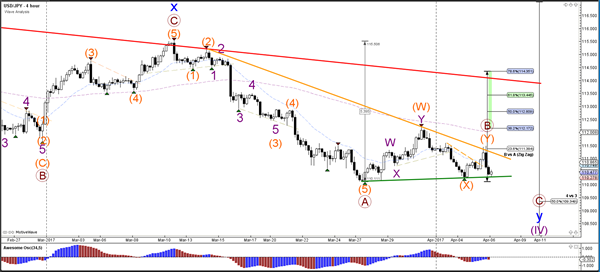
The USD/JPY is at a major trend line (green) again. A bearish breakout could indicate a wave C (brown) continuation whereas a bullish bounce above 111 and 111.50 could expand wave B (brown) to higher Fibonacci levels.
Daily Technical Outlook And Review: EUR/USD, GBP/USD, USD/JPY, AUD/USD, XAU/USD,EUR/JPY
EUR/USD
EUR/USD is approaching trendline resistance and a break above would confirm the double bottom pattern at 1.0630. However, the currency pair could struggle to rally, since solid resistance lies at 1.0720 and 1.0750.
Only a break above 1.0750 would signal that there might be potential for a larger recovery in EUR/USD.
GBP/USD
GBP/USD is consolidating within a triangle pattern. However, with plenty of data releases and other events in the upcoming 48 hours, a breakout seems imminent. Since the short-term trend in GBP/USD is positive, a break above 1.25 seems more likely.
This could then pave the way for a move towards 1.26, but immediate resistance is noted at 1.2550. Should the currency pair come under pressure, watch the 1.2420/30 area for key support.
USD/JPY
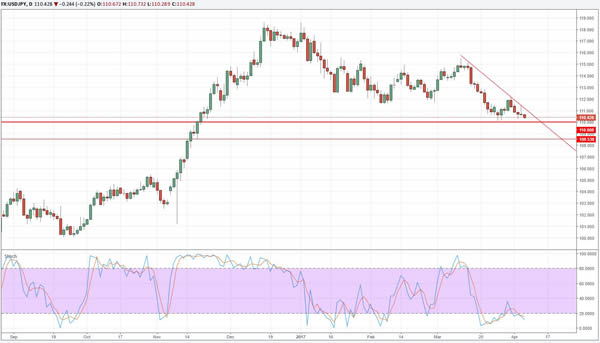
USD/JPY is moving towards 110 and a break below that level seems increasingly likely. The charts suggest that this would then pave the way for a move to at least 108.50.
While the currency pair is starting to look a bit oversold, there is still potential for a larger decline should 110 support break.
AUD/USD
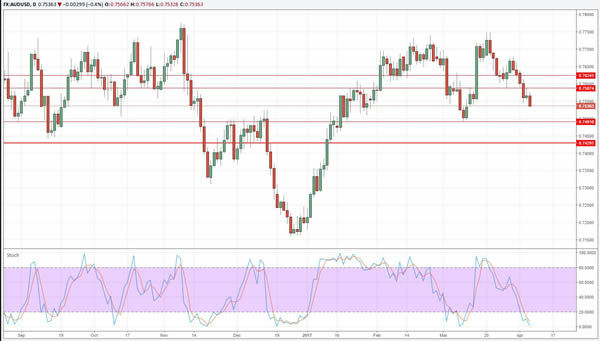
The momentum in AUD/USD is increasing and the currency pair is approaching key support at 0.7490. The Aussie Dollar is likely to consolidate there for a while.
However, the short-term outlook for AUD/USD is negative and selling rallies the preferred strategy. Look for decent resistance at 0.7550 and 0.7585/90. Should the currency pair break below 0.7490 support, immediate support is then seen 0.7430, but it would likely extend losses further.
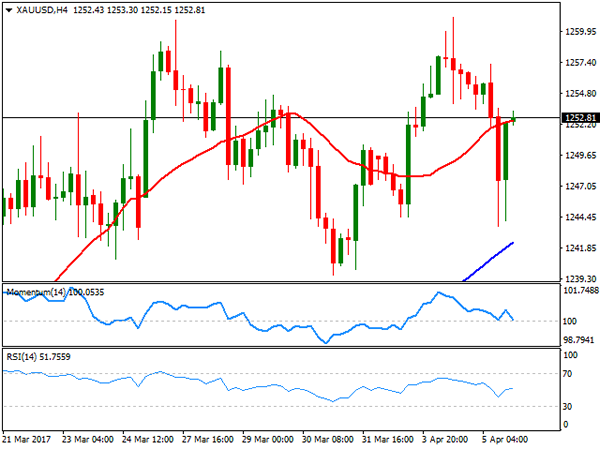
XAUUSD
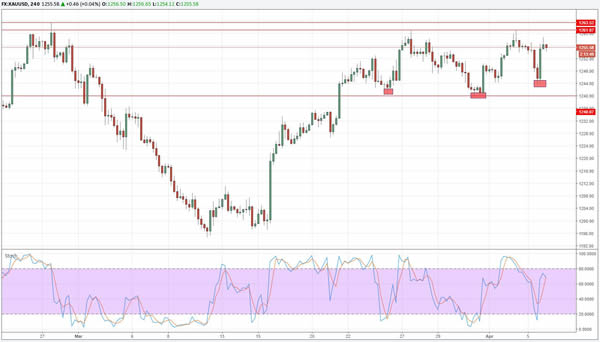
Gold fell to 1244 in yesterday's trading session, but the strong bounce from there once again confirms that the metal is still in demand. Resistance between 1261 and 1263 is still a tough one to crack, but a breakout seems increasingly likely.
A move above 1263 would then suggest that the rally could continue to 1300 in the near-term.
EUR/JPY
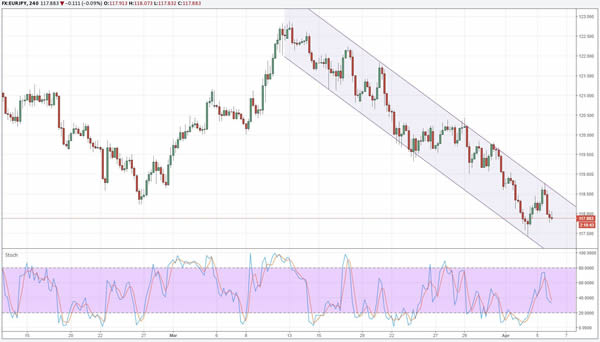
EUR/JPY is trading within a descending channel and the outlook remains bearish following the break of 118 support.
Selling rallies is the preferred strategy. Watch for retests of the upper channel line, as well as 118.50 and 118.75.
European Open Briefing: Asian Stock Markets Declined
Global Markets:
- Asian stock markets: Nikkei down 1.40 %, Shanghai Composite gained 0.10 %, Hang Seng fell 0.55 %, ASX 200 declined 0.65 %
- Commodities: Gold at $1256 (+0.60 %), Silver at $18.24 (+0.30 %), WTI Oil at $50.85 (-0.60 %), Brent Oil at $54.10 (-0.55 %)
- Rates: US 10 year yield at 2.34, UK 10 year yield at 1.10, German 10 year yield at 0.25
News & Data:
- Chinese Caixin Services PMI Mar: 52.1 (prev 52.6)
- Hong Kong Manufacturing PMI Mar: 49.9 (prev 49.6)
- PBoC Fixes USDCNY Reference Rate At 6.8930 (prev fix 6.8906 prev close 6.8975)
- Asia stocks slip, investors on edge for Trump-Xi meeting – RTRS
- Dollar sags on Xi-Trump summit nerves, geopolitical worries – RTRS
Markets Update:
Asian stock markets declined as risk appetite remains low. The market is waiting for the meeting between US President Trump and Chinese President Xi Jinping. Investors are hoping that Trump may moderate his tone and seek better relations with China.
In FX, it remains quiet. The FOMC meeting minutes did not reveal much new. Traders are now waiting for tomorrow's NFP release. The Dollar has strengthened slightly this week, although it declined against safe haven currencies such as the Japanese Yen.
USD/JPY is approaching the 110 level. A break below would be significant from a technical perspective and suggest, that the decline will extend to at least 108.50.
Upcoming Events:
- 08:00 GMT – ECB President Draghi speaks
- 08:15 GMT – Swiss CPI
- 12:30 GMT – ECB Meeting Minutes
- 13:30 GMT – US Initial Jobless Claims
- 14:30 GMT – FOMC Member Williams speaks
- 17:40 GMT – ECB Member Praet speaks
- 18:15 GMT – ECB Member Constancio speaks
Elliott Wave View: EURJPY Continue Lower
Short term Elliott Wave view in EURJPY suggests that cycle from 3/12 peak (122.89) is unfolding as a double three Elliott wave structure where Minor wave W ended at 119.28 and Minor wave X ended at 120.45. Minor wave Y is in progress and the internal is unfolding also as a double three Elliott wave structure where Minute wave ((w)) ended at 117.38 and Minute wave ((x)) bounce is proposed complete at 118.78. Down from 118.78, if pair can see 1 more minor low, the decline can be defined as 5 waves impulse and the 5 waves move should complete Subminutte wave a, then it should bounce in Subminutte wave b to correct the cycle from 118.78 high before pair turns lower again. We don’t like buying the proposed bounce and expect sellers to appear once Subminutte wave b is complete in 3, 7, or 11 swing provided that pivot at 4/5 high (118.78) stays intact in the first degree.
EURJPY 1 hour Elliott Wave Chart
Foreign Exchange Market Commentary: EUR/USD, USD/JPY, GBP/USD, GOLD, WTI CRUDE, DJIA, FTSE 100, DAX
EUR/USD
A re-surge in market's confidence on the US economy, following the release of a much better-than-expected ADP survey, pushed the greenback higher across the board, although majors held within familiar ranges. The EUR/USD pair fell down to 1.0634 and closed the day a couple of pips above it, with the common currency weighed by slightly worse-than-expected Markit Services PMIs for the EU. Despite growth in the sector for the whole region was confirmed near six-year highs, initial estimates for March were revised lower, with the index printing 56.0, down from the flash reading of 56.5. The composite PMI for the EU, ended up at 56.4 from 56.7.
The dollar gained traction after the ADP survey showed that the private sector added 263K jobs in March, beating expectations of 187K, although February reading was downwardly revised to 245K, still way above average. The final services PMIs in the US also suffered downward revisions, with the Markit index at 52.8 and the ISM Non-manufacturing PMI down to 55.2. These lasts, were barely enough to halt dollar's advance, albeit Wall Street kept rallying. FOMC Minutes released in the US afternoon, showed that the Fed favors a plan to start shrinking its balance sheet later this year, prompting the greenback initially higher across the board, although the movements were quickly reverted.
Market's reaction indicates that speculative interest is eagerly waiting for a reason to buy the greenback, at least against the EUR. Despite the pair was unable to leave its tight weekly range, the risk remains towards the downside, given that in the 4 hours chart, the price was unable to settle above a bearish 20 SMA, whilst the RSI indicator resumed its decline, now heading south around 35. The momentum indicator, however, remains attached to its 100 level, lacking directional strength. The key support is 1.0620 as the pair needs to break it to be able to extend its decline down to 1.0565.
Support levels: 1.0620 1.0590 1.0565
Resistance levels: 1.0675 1.0710 1.0745
USD/JPY
The USD/JPY pair trimmed most of its weekly losses and settled near its daily high of 111.44, with the yen easing amid improving market's mood. Asian shares advanced, following the lead of Wall Street, and following improved Japanese data as the Nikkei PMI surged to 52.9 in March its highest in almost two years. The manufacturing PMI also showed expansion in the month, printing 52.4, indicating firm demand for goods and services. The pair jumped to the mentioned high following the release of the US ADP survey, spending the rest of the day consolidating nearby. Nevertheless, and from a technical point of view, the upward potential remains limited according to technical readings in the 4 hours chart, as the intraday advance stalled well below a bearish 100 SMA, whilst the Momentum indicator was unable to recover above its 100 level, as the RSI indicator lost upward strength around neutral levels. The pair has an immediate resistance at 111.60, and a stronger one around 112.00, this last expected to cap advances on Thursday ahead of Friday's NFP release.
Support levels: 110.95 110.50 110.10
Resistance levels: 111.60 112.00 112.50
GBP/USD
The GBP/USD pair topped at 1.2496, with the Pound attracting intraday buying interest after the release of a better-than-expected services PMI for March, as the Markit index printed 55.0, up from 53.3 in February. The pair, however, was unable to regain the 1.2500 level, retreating from the mentioned high after the release of the US ADP report, to settle around 1.2460. The UK macroeconomic calendar has nothing to offer this Thursday, although things will get more interesting on Friday with fresh data including manufacturing and industrial production, the trade balance and the NIESR GDP estimate. From a technical point of view, the pair maintains a neutral-to-bearish bias, as in the 4 hours chart, the pair was unable to surpass a horizontal 20 SMA around 1.2490, while technical indicators hold within bearish territory, but with no clear directional strength. The same chart shows that the pair bottomed multiple times over the last few days in the 1.2420/30 region, confirming that a break below 1.2410 is required for a downward extension that can extend down to 1.2330.
Support levels: 1.2450 1.2410 1.2370
Resistance levels: 1.2490 1.2540 1.2585
GOLD
Gold prices traded in the red for most of the day, on improving risk sentiment following Wall Street's Tuesday advance. Spot traded as low as $1,243.67 a troy ounce, but bounced back in the US afternoon and settled around 1,252.40, buoyed on bargain hunting after the commodity tested a major technical support. The bright metal gained, in spite of a stronger dollar, confirming that speculative interest is bullish on the metal. The daily chart, shows that the price bounced sharply after testing the 200 DMA, whilst a bullish 20 SMA stands right below the largest. Technical indicators in the mentioned time frame within positive territory, reflecting the inability of the commodity to break higher rather than suggesting downward exhaustion. In the 4 hours chart, the price settled a few cents above its 20 SMA, while the intraday decline stalled above a sharply bullish 20 SMA. In the same chart, technical indicators hold within positive territory, but with no clear directional strength, as the RSI lost upward strength around 53, whilst the Momentum indicator heads lower right above 100.
Support levels: 1,249.45 1.243.60 0 1,230.00
Resistance levels: 1,258.30 1,263.80 1,272.80
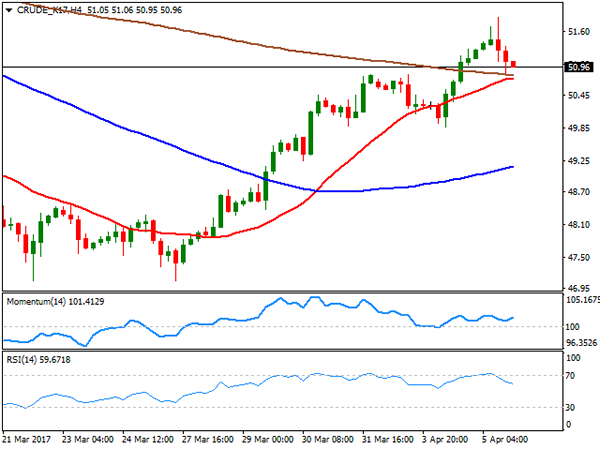
WTI CRUDE
West Texas Intermediate crude oil futures rallied up to $51.86 a barrel backed by the American Petroleum Institute report released late Tuesday, that showed that crude inventories fell by 1.3 million barrels in the week ending March 31st. The commodity however, pulled back and settled around $50.96 a barrel, as the EIA weekly report showed an unexpected build of 1.6 million barrels, denting hopes of a balanced market. Daily basis, the index is midway between bullish 100 and 200 SMAs with the shortest capping the upside around 52.20, and with technical indicators having lost directional strength, but holding within positive territory. Shorter term, the 4 hours chart shows that the price pulled back to its 20 and 200 SMAs, both converging at 50.80, while the Momentum indicator is aiming to bounce from its 100 level and the RSI turned south around 58. The decline could accelerate on a break below 50.80, but it will take a slide below 49.90 to confirm further declines ahead.
Support levels: 50.80 50.30 49.90
Resistance levels: 51.65 52.20 52.90
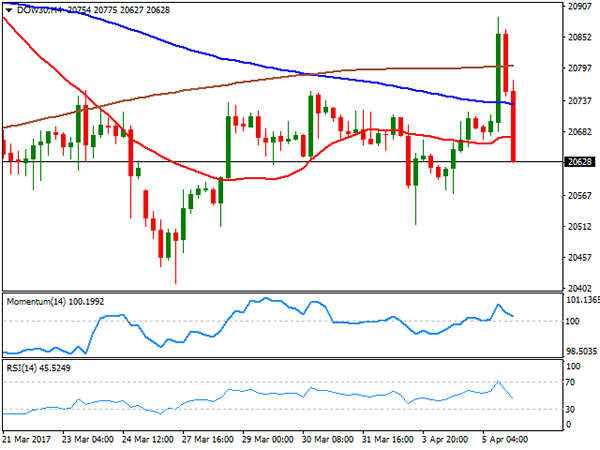
DJIA
Wall Street opened with a strong tone, with the DJIA posting a three-digit gain before the release of FOMC Minutes. Indexes suffered a sharp reversal afterwards, as the minutes showed that most officials backed a policy change that would begin shrinking the central bank’s $4.5 trillion balance sheet later this year, seen by analyst as an option to rising rates. Furthermore, the document showed that some officials expressed their concerns about equity prices being "quite high." The Dow Jones Industrial Average shed 41 points, and settled at 20,648.15, while the Nasdaq Composite lost 0.58%, to 5,864.48. The S&P closed at 2,352.95, down by 7 points. Most members were down within the Dow, with Cisco Systems being the worst performer, down 1.17%, followed by JPMorgan Chase that shed 1.15%. The best performer was El du Pont that managed to gain 0.84%. The daily chart shows that the index failed to sustain gains beyond a bullish 20 DMA, ending the day below it, whilst technical indicators head lower within negative territory, aiming for fresh weekly lows. In the 4 hours chart, the index settled above all of its moving averages that anyway continue to lack directional strength, whist technical indicators turned sharply lower, with the RSI currently at 46, anticipating some additional declines ahead.
Support levels: 20,616 20,562 20,515
Resistance levels: 20,705 20,751 20,790
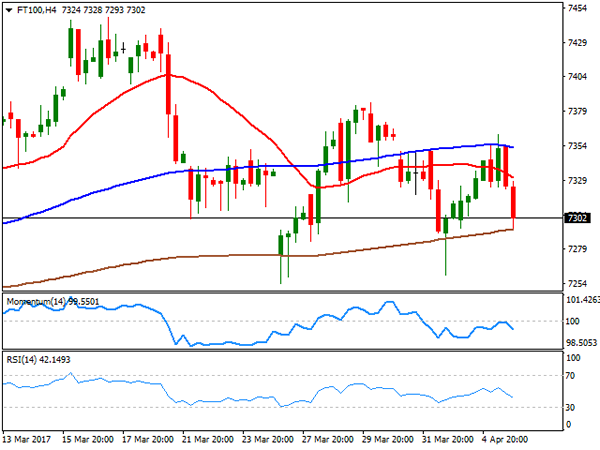
FTSE 100
The FTSE 100 added roughly 10 points and settled at 7,331.68, lifted by an advance and mining and energy-related equities, as oil surged to a fresh 1-month high during the London session. The biggest gainer was Whitbread up 2.95%, while BHP Billiton added 1.75% and Antofagasta gained 1.55%. The biggest loser was insurer Old Mutual D down 4.38%, followed by Croda International that shed 3.6% after it received a downgrade from Credit Suisse. The index is currently trading a couple of points below 7,300, and the daily chart shows that an early advance was rejected by selling interest aligned around its 20 DMA , whilst technical indicators head further lower within negative territory, pointing for a continued decline. In the 4 hours chart, the index faltered around its 100 SMA, and now pressures the 200 SMA, whilst technical indicators retreated from their mid-lines, maintaining their bearish slopes into the Asian opening, in line with the longer term perspective.
Support levels: 7,294 7,254 7,210
Resistance levels: 7,349 7,387 7,415
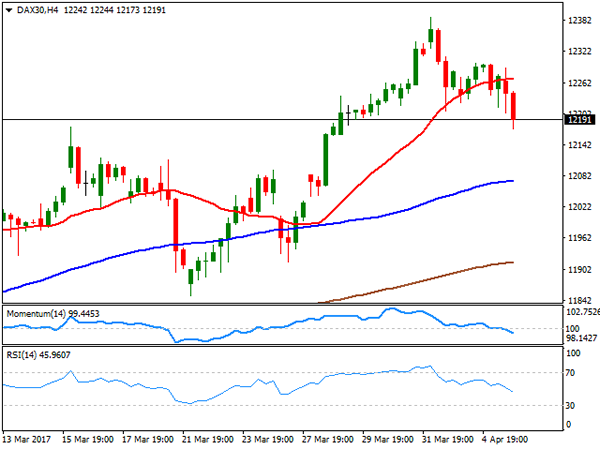
DAX
The German DAX closed the day at 12,217.54, down 64 points or 0.53%, with major European indexes ending the day mixed. The German benchmark was dragged lower by automakers, as the sector was the worst performer. Continental topped losers' list down by 1.63%, followed by Daimler AG that shed 1.49%. Banks were the best performers after optimism returned, with Commerzbank adding 2.21% and Deutsche Bank ending the day 0.67% higher. The index fell further in after-hours trading, holding around 12,180 ahead of the Asian opening, as Wall Street suffered a sudden u-turn after in the last hour of trading on following the release of FOMC Minutes. The daily chart shows that the technical indicators gained downward momentum, still holding within positive territory, whilst a bullish 20 DMA offers a critical support at 12,094 now. In the 4 hours chart, the index broke below its 20 SMA for the first time in a week, with the moving average now horizontal, and technical indicators heading sharply lower within negative territory, supporting additional declines ahead.
Support levels: 12,137 12,096 12,052
Resistance levels: 12,206 12,245 12,290
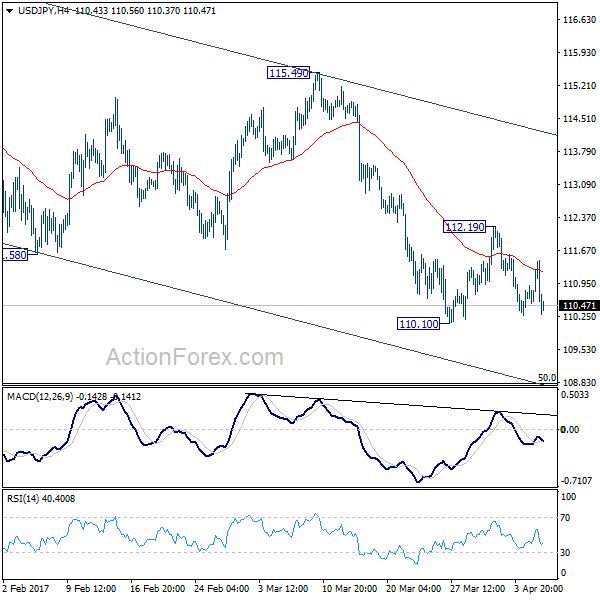
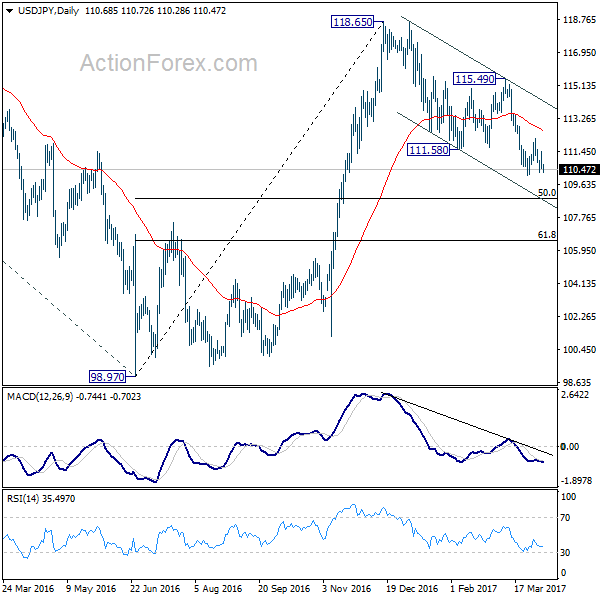
USD/JPY Daily Outlook
Daily Pivots: (S1) 110.33; (P) 110.89; (R1) 111.25; More....
Intraday bias in USD/JPY remains neutral as consolidation continues between 110.10/112.19. On the downside, break of 110.10 will resume the whole corrective decline from 118.65 and target 50% retracement of 98.97 to 118.65 at 108.81. On the upside, however, break of 112.19 resistance will indicate short term reversal and turn bias back to the upside for 115.49 resistance.
In the bigger picture, price actions from 125.85 high are seen as a corrective pattern. The impulsive structure of the rise from 98.97 suggests that the correction is completed and larger up trend is resuming. Decisive break of 125.85 will confirm and target 61.8% projection of 75.56 to 125.85 from 98.97 at 130.04 and then 135.20 long term resistance. Nonetheless, sustained trading below 55 week EMA (now at 111.16) will extend the consolidation from 125.85 with another fall through 98.97 before completion.
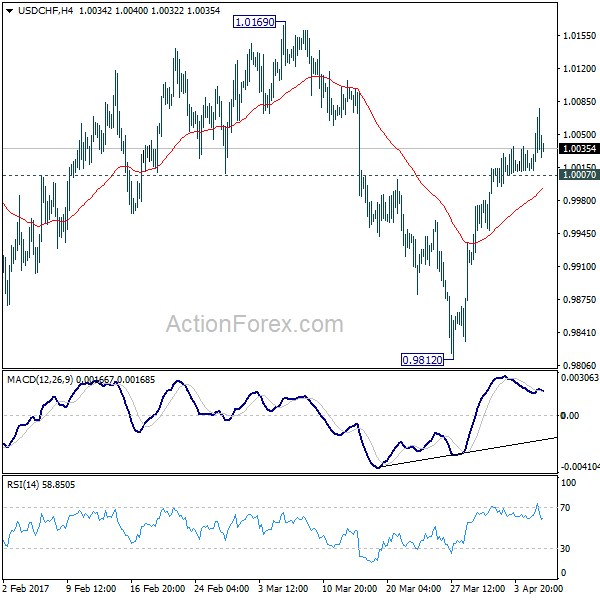
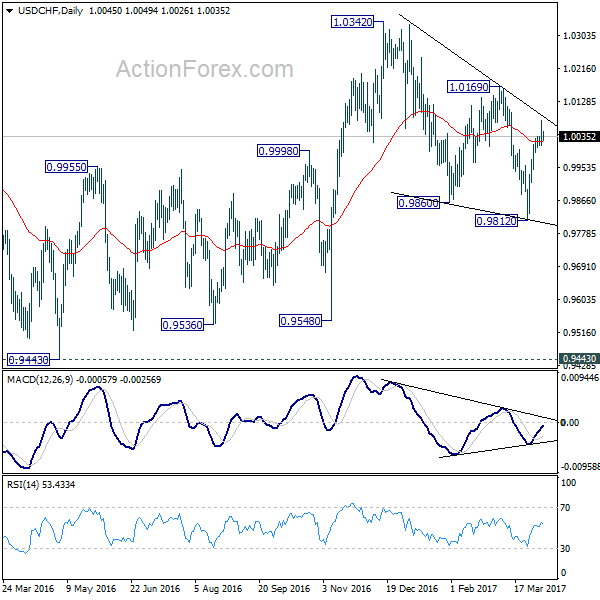
USD/CHF Daily Outlook
Daily Pivots: (S1) 1.0011; (P) 1.0044; (R1) 1.0081; More.....
With 1.0007 minor support intact, intraday bias remains on the upside. Rise from 0.9812 should target 1.0169 resistance first. As noted before, corrective decline fall from 1.0342 should have finished with three waves down to 0.9812 already. Break of 1.0169 should confirm this bullish case and target a test on 1.0342 high. On the downside, below 1.0007 minor support will turn bias neutral and bring retreat before staging another rally.
In the bigger picture, USD/CHF is staying in medium term sideway pattern between 0.9443/1.0342. In any case, decisive break of 1.0342 resistance is needed to confirm underlying strength. Otherwise, we'll stay neutral in the pair first. In case of another fall, we'd expect strong support from 0.9443/9548 support zone.
GBP/USD Daily Outlook
Daily Pivots: (S1) 1.2438; (P) 1.2468; (R1) 1.2514; More...
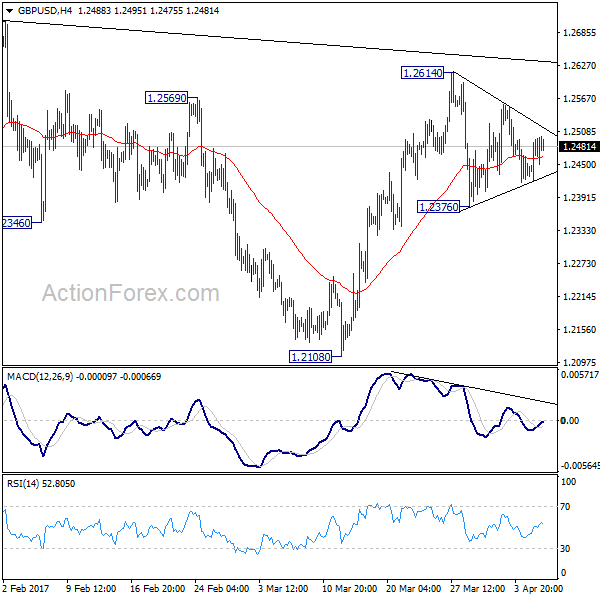
Intraday bias in GBP/USD stays neutral as range trading continues inside 1.2376/2614. Overall, price actions from 1.1946 are viewed as a consolidation pattern pattern. On the downside, break of 1.2376 will turn bias to the downside for 1.2108 support. Decisive break there will be an early sign of larger down trend resumption. On the upside, break of 1.2614 will extend the rise from 1.2108. But upside should be limited by 1.2705/2774 resistance zone to bring larger down trend resumption eventually.
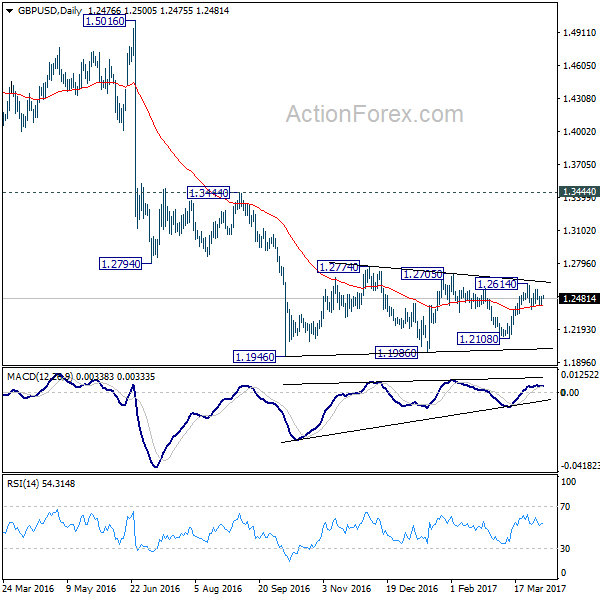
In the bigger picture, fall from 1.7190 is seen as part of the down trend from 2.1161. There is no sign of medium term reversal yet. Sustained trading below 61.8% projection of 2.1161 to 1.3503 from 1.7190 at 1.2457 will target 100% projection at 0.9532. Overall, break of 1.3444 resistance is needed to confirm medium term bottoming. Otherwise, outlook will remain bearish.