Sample Category Title
AUDUSD Well Positioned To Rally This Week
Key Points:
- Technical bias remains bullish despite a rather torrid week.
- Descending trend line could now be challenged moving ahead.
- RBA in focus as the Cash Rate is set to be announced.
The AUDUSDwas all over the place last week which leaves its outlook for the week ahead somewhat unclear. As a result, it is worthwhile taking a look at both what caused last week's performance and what is on the agenda as we move ahead. Furthermore, we can look to the technicals to get a better picture of what to expect as we press on.
Starting with last week's performance, the AUD was initially rallying reasonably strongly but soon had these gains taken away by better than expected US data. Specifically, as was the case for most pairs, the uptick in the US Final GDP figure to 2.1% caused a bit of stir and a sharp return in sentiment for the USD on Thursday. However, this trend extended into Friday's session for the AUDUSD as the Australian Private Sector Credit figure disappointed at only 0.3% which offset any shortcomings in the US Personal Spending and Personal Income data. Overall, this saw the pair close the week basically where it opened it.
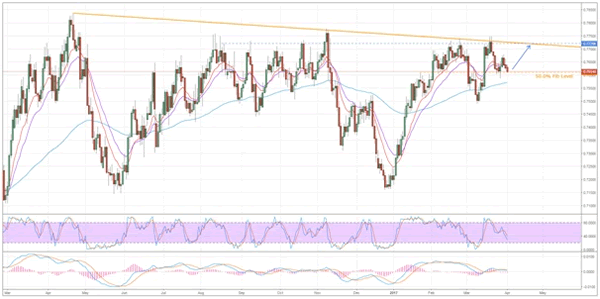
On the technical front, the AUD remained relatively bullish which could now leave it open to netting some modest gains this week. Of course, upsides will be limited by the descending trend line but a number of other instruments are hinting that challenging this line could actually be on the cards. For one, the moving averages are still firmly bullish, a bias also shared with the Parabolic SAR. Moreover, the RSI and Stochastic Oscillators are both neutral which gives the pair plenty of room to rally without fear of moving into overbought territory.
As for what lies ahead in the fundamental news, there is a bevy of data on offer which could lead to a rather volatile week for the Aussie Dollar. What's more, this volatility will largely spike early on as the RBA's Cash Rate decision is due out Tuesday alongside the Australian Trade Balance. Presently, expectations are that the rate is held steady at 1.50% as the central bank will be loath to put any further upward pressure on AUD and hamstring exporters. As a result, the rhetoric accompanying the announcement may generate more movement than the rate choice itself so keep an eye on the RBA's Lowe.
Ultimately, we expect to see some more bullishness on the horizon for the AUD but, as mentioned, not too much. Specifically, the combination of the overarching bullish technical bias and the increased focus on the pair, given the RBA's Cash Rate announcement, could see the descending trend line challenged within the next week or so. However, we don't expect to see this challenge result in a breakout even with some decent fundamental support.
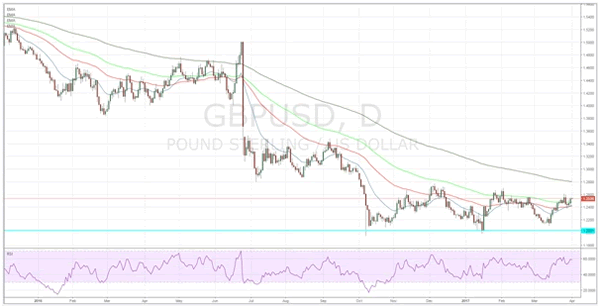
Cable Buoyant As Speculation Grows Of Rate Hikes
Key Points:
- Cable buoyant as market looks past Brexit risk.
- Inflationary pressures rising with the UK.
- Watch for a break of resistance around 1.2569.
The Cable had a relatively historic week with the formal triggering of the Article 50 Brexit provisions causing some volatility for the pair. However, the pair recovered fairly quickly as the market appears to be looking past the Brexit and towards the currently strong inflation figures and the chance of near term rate hikes from the Bank of England. Subsequently, given the looming NFP result, it makes sense to review last week’s event, and what could potentially lay on the horizon for the venerable Cable.
Last week was a historic moment for the Cable as UK Prime Minister May formally triggered the Article 50 exit provisions to start the Brexit process. Although this was largely expected, what was a surprise was the EU’s position that no negotiations on trade will occur until separation procedures had begun and no agreement on trade would be concluded until a full exit had occurred. Subsequently, the Cable was initially under pressure but this quickly reversed because it would appear that the market is largely looking beyond the Brexit risk and is instead focusing upon the strong UK inflation and the increased chance of a rate hike from the Bank of England. Subsequently, the Cable actually managed to finish the week around 50 pips higher at 1.2551.
Looking ahead, the pair is in for a busy week with the primary focus likely to fall upon the UK Manufacturing and Services PMI figures which are forecast at 55.1, and 53.5 respectively. It’s highly likely that those figures will prove to be relatively robust given the strength evident within the UK economy of late. In addition, the U.S. Non-Farm Payroll figures are also due out, late in the week, with most forecasts placing the print somewhere around the 180k mark. However, this is likely to be the hardest figure to forecast, so don’t put too much stock in the market forecasts. The U.S. labour market has been under pressure of late so we could potentially be in for a slightly weaker result than expected. Regardless, both the UK PMI’s and U.S. NFP figures will cause plenty of swings and volatility for the pair in the week ahead.
From a technical perspective, the Cable’s price action continues in a sideways, consolidative fashion and is yet to deliver a clear trend in either direction. The current pattern argues for an extension of the consolidative phase which is also supported by the relatively flat RSI Oscillator. The medium term is largely weighted to the upside but price action is likely to remain trending sideways in the week ahead which means our bias remains neutral. Support is currently in place for the pair at 1.2376, 1.2299, and 1.2197. Resistance exists on the upside at 1.2569, 1.2615, and 1.2705.
Ultimately, the current UK economic conditions appear to be the strongest driver of the Cable’s recent rally. The Bank of England is likely to be increasingly under pressure to hike the official bank rate if inflation continues to creep higher. Subsequently, the Cable is likely to remain buoyant in the week ahead but watch for a sentiment swing back towards the greenback in the event of any jawboning from the Fed’s Janet Yellen.
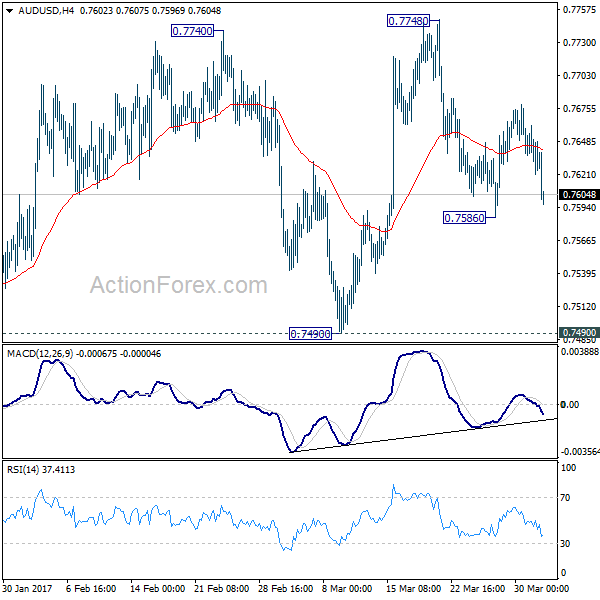
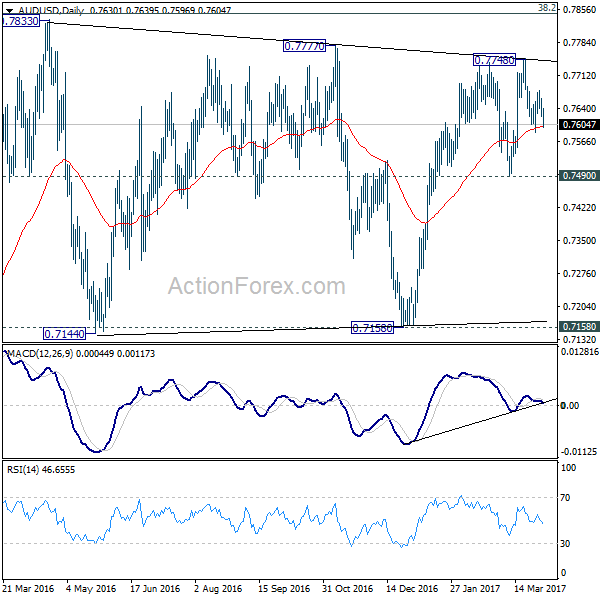
AUD/USD Daily Outlook
Daily Pivots: (S1) 0.7611; (P) 0.7637; (R1) 0.7653; More...
AUD/USD dips notably today but stays above 0.7586 temporary low. Intraday bias remains neutral first. On the downside, break of 0.7586 will turn bias back to the downside for 0.7490 support. Firm break there will confirm completion of rise from 0.7158. In such case, near term outlook will be turned bearish for 0.7158 support next. On the upside, break of 0.7748 will extend the rally from 0.7158. In that case, we'd expect strong resistance from long term retracement level at 0.7849 to limit upside.
In the bigger picture, we're still treating price actions from 0.6826 low as a correction. And, as long as 38.2% retracement of 0.9504 to 0.6826 at 0.7849 holds, long term down trend from 1.1079 is expected to resume sooner or later. Break of 0.6826 low will target 0.6008 key support level. However, firm break of 0.7849 will indicate that rise from 0.6826 is developing into a medium term rebound, rather than a sideway pattern. In such case, stronger rise should be seen to 55 month EMA (now at 0.8165) and above.
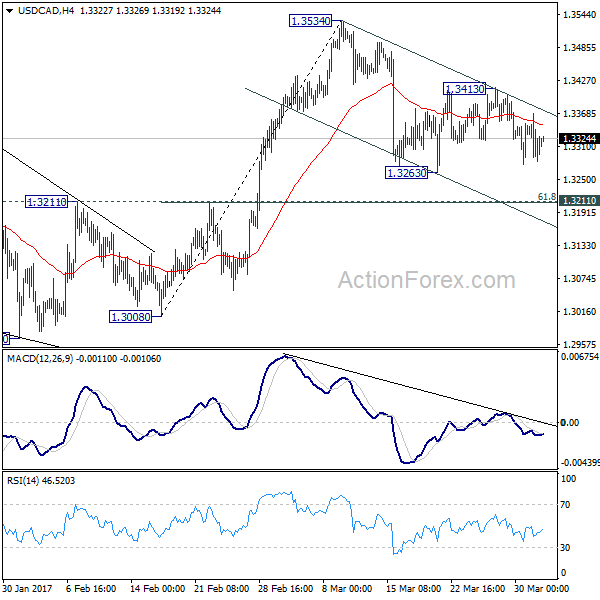
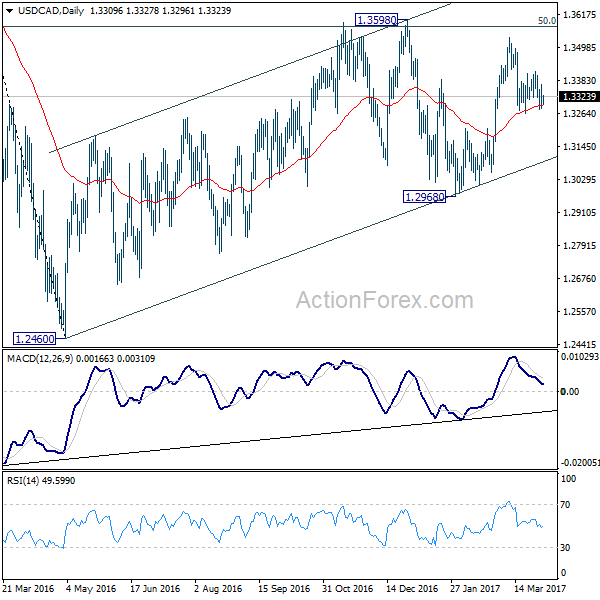
USD/CAD Daily Outlook
Daily Pivots: (S1) 1.3279; (P) 1.3323; (R1) 1.3362; More....
Intraday bias in USD/CAD remains neutral for the moment. Outlook is unchanged that fall from 1.3534 is seen as a correction. below 1.3263 will bring deeper fall. But we'd expect strong support from 1.3211 cluster level (61.8% retracement of 1.3008 to 1.3534 at 1.3209) to contain downside and bring rebound. On the upside, break of 1.3413 will argue that such correction is completed and turn bias back to the upside for 1.3534 and above.
In the bigger picture, price actions from 1.4689 medium term top are seen as a correction pattern. The first leg has completed at 1.2460. The second leg from 1.2460 is likely still in progress and could target 61.8% retracement of 1.4689 to 1.2460 at 1.3838. We'd look for reversal signal there to start the third leg. Break of 1.2968 will argue that the third leg has already started and should at least bring at retest of 1.2460 low. However, sustained trading above 1.3838 would pave the way to retest 1.4689 high.
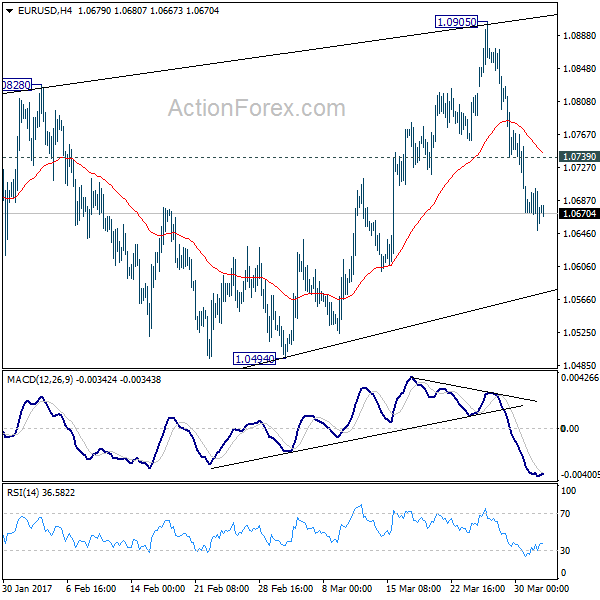
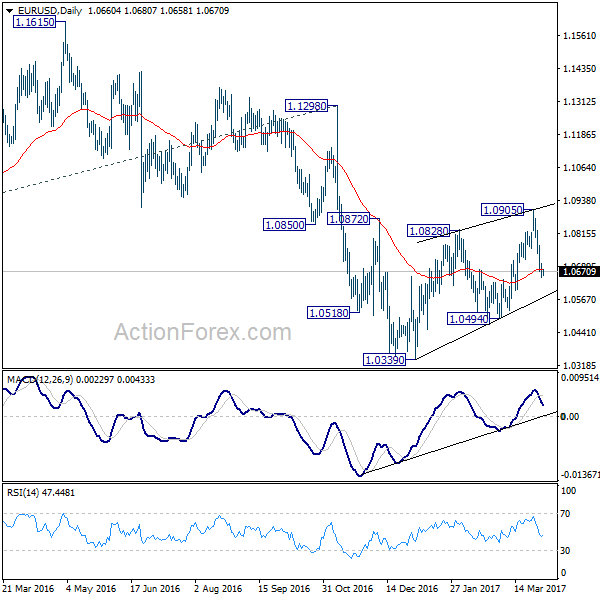
EUR/USD Daily Outlook
Daily Pivots: (S1) 1.0632; (P) 1.0666 (R1) 1.0687; More.....
Intraday bias in EUR/USD remains on the downside for the moment. As noted before, corrective rise from 1.0339 is completed and larger down trend is possibly ready to resume. Break of 1.0494 should confirm this bearish case and target 1.0339 low and below. Break of 1.0339 will confirm down trend resumption and target parity next. On the upside, above 1.0739 minor resistance will delay the bearish case and turn focus back to 1.0905 resistance instead.
In the bigger picture, as long as 1.1298 key resistance holds, whole down trend from 1.6039 (2008 high) is still expected to continue. Break of 1.0339 low will send EUR/USD through parity to 61.8% projection of 1.3993 to 1.0461 from 1.1298 at 0.9115. However, considering bullish convergence condition in weekly MACD, break of 1.1298 will indicate term reversal. this would also be supported by sustained trading above 55 week EMA.
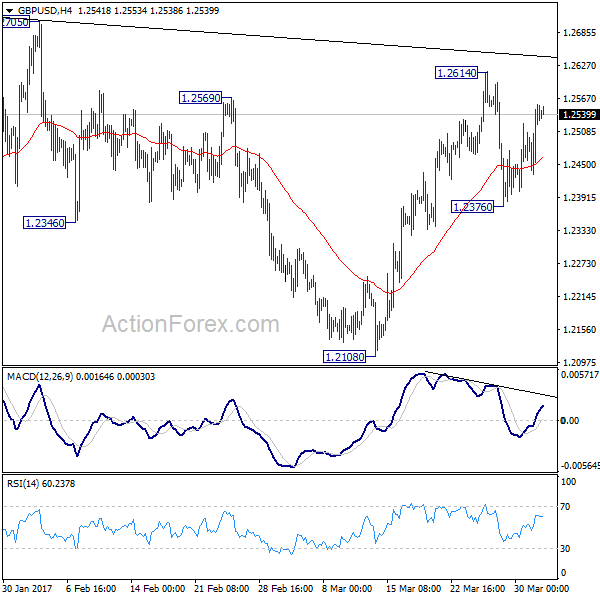
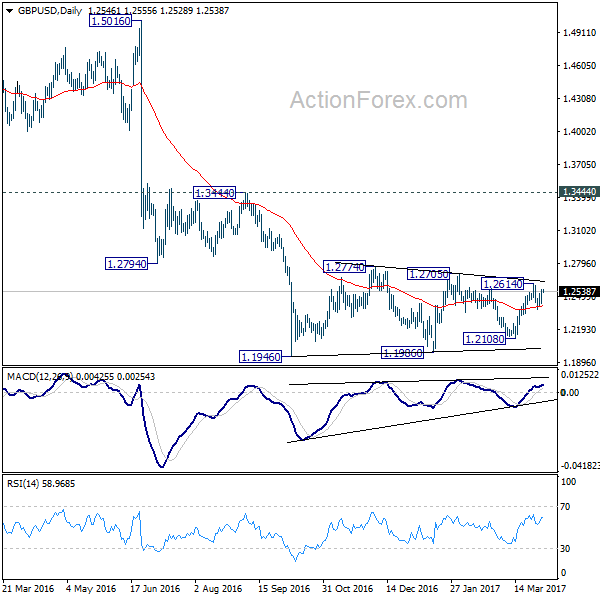
GBP/USD Daily Outlook
Daily Pivots: (S1) 1.2466; (P) 1.2512; (R1) 1.2590; More...
Intraday bias in GBP/USD remains neutral for the moment. On the upside, break of 1.2614 will extend the rise from 1.2108. Overall, price actions from 1.1946 are viewed as a consolidation pattern pattern. Upside should be limited by 1.2705/2774 resistance zone to bring larger down trend resumption eventually. On the downside, below 1.2376 will target 1.2108 support next. Break there will be an early sign of larger down trend resumption.
In the bigger picture, fall from 1.7190 is seen as part of the down trend from 2.1161. There is no sign of medium term reversal yet. Sustained trading below 61.8% projection of 2.1161 to 1.3503 from 1.7190 at 1.2457 will target 100% projection at 0.9532. Overall, break of 1.3444 resistance is needed to confirm medium term bottoming. Otherwise, outlook will remain bearish.
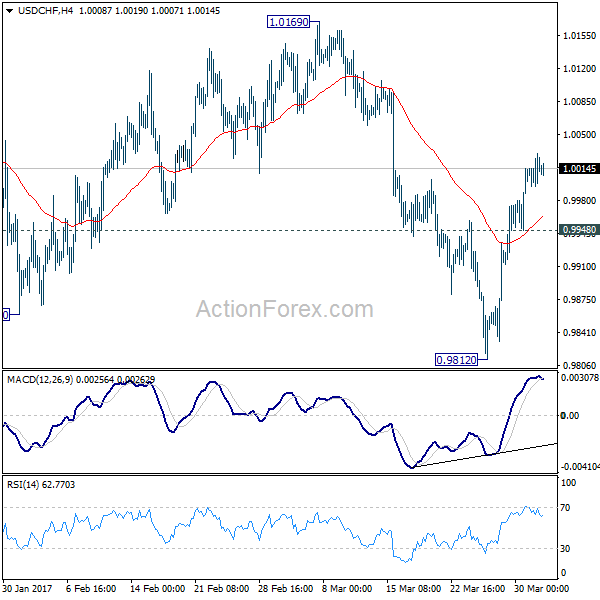
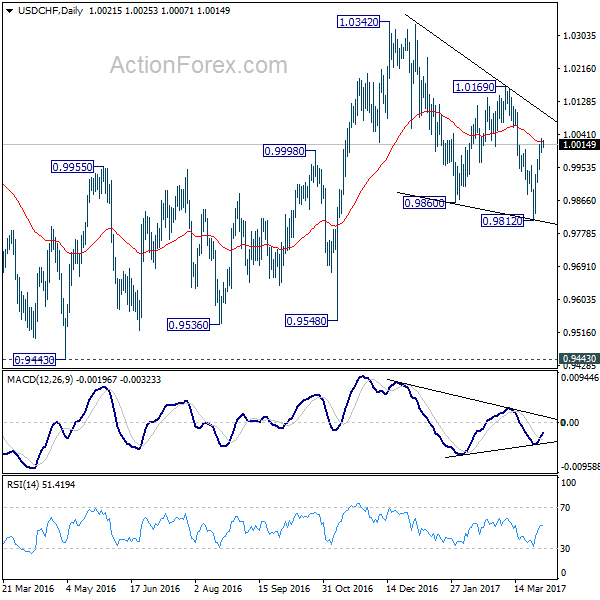
USD/CHF Daily Outlook
Daily Pivots: (S1) 1.0004; (P) 1.0016; (R1) 1.0039; More.....
Intraday bias in USD/CHF remains on the upside for the moment. Corrective decline from 1.0342 could have completed at 0.9812 already. Sustained trading above 55 day EMA (now at 1.0022) will affirm this bullish case. Break of 1.0169 resistance will confirm and target a test on 1.0342 high. On the downside, however, below 0.9948 minor support will turn bias back to the downside for 0.9812 instead.
In the bigger picture, USD/CHF is staying in medium term sideway pattern between 0.9443/1.0342. In any case, decisive break of 1.0342 resistance is needed to confirm underlying strength. Otherwise, we'll stay neutral in the pair first. In case of another fall, we'd expect strong support from 0.9443/9548 support zone.
AUD/USD: Australian Retail Sales Surprisingly Dropped In February
For the 24 hours to 23:00 GMT, the AUD declined 0.07% against the USD and closed at 0.7638 on Friday.
LME Copper prices declined 0.2% or $11.0/MT to $5849.0/MT. Aluminium prices declined 0.4% or $8.5/MT to $1946.5/MT.
In the Asian session, at GMT0300, the pair is trading at 0.7611, with the AUD trading 0.35% lower against the USD from Friday’s close, after Australia’s seasonally adjusted retail sales unexpectedly fell 0.1% MoM in February, defying market expectations for a rise of 0.3% and following a rise of 0.4% in the previous month.
Additionally, the nation’s AIG performance of manufacturing index eased to a level of 57.5 in March, compared to a reading of 59.3 in the prior month. On the other hand, the nation’s seasonally adjusted building approvals recorded an unexpected rise of 8.3% on a monthly basis in February, against market consensus for a drop of 1.0% and following a revised rise of 2.2% in the previous month.
The pair is expected to find support at 0.7591, and a fall through could take it to the next support level of 0.7572. The pair is expected to find its first resistance at 0.7646, and a rise through could take it to the next resistance level of 0.7682.
The currency pair is trading below its 20 Hr and 50 Hr moving averages.

EUR/USD: Euro-Zone’s Consumer Price Inflation Rose Less Than Expected In March
For the 24 hours to 23:00 GMT, the EUR declined 0.14% against the USD and closed at 1.0669 on Friday, after the release of disappointing inflation data from the Euro-zone.
The preliminary consumer price index (CPI) advanced less-than-anticipated by 1.5% on an annual basis in March, offering some respite to the European Central Bank as it faces pressure to wind down its massive monetary stimulus programme. Markets expected the region's CPI to rise 1.8%, following a gain of 2.0% in the prior month.
Separately, Germany's seasonally adjusted unemployment rate unexpectedly dropped to a new record low level of 5.8% in March, while investors had envisaged the unemployment rate to remain steady at 5.9%. Further, the nation's retail sales rebounded 1.8% MoM in February, surpassing market expectations for an increase of 0.7% and posting its strongest increase since August 2014. In the prior month, retail sales had dropped by a revised 1.0%.
In the US, macroeconomic data indicated that personal spending edged up 0.1% in February, undershooting market expectations for a rise of 0.2%. In the prior month, personal spending had recorded a rise of 0.2%. The nation's personal income recorded a rise of 0.4% in February, at par with market expectations and after registering a revised rise of 0.5% in the previous month. Meanwhile, the nation's final Reuters/Michigan consumer sentiment index was revised down to a level of 96.9 in March, compared to a level of 97.6, registered in the flash estimate. The index had recorded a reading of 96.3 in the previous month.
Separately, several Federal Reserve (Fed) officials indicated that they expect interest rate increases this year, but each portrayed a cautious tone about the US economy.
In the Asian session, at GMT0300, the pair is trading at 1.0678, with the EUR trading 0.08% higher against the USD from Friday's close.
The pair is expected to find support at 1.0651, and a fall through could take it to the next support level of 1.0623. The pair is expected to find its first resistance at 1.0704, and a rise through could take it to the next resistance level of 1.0729.
Going ahead, investors will look forward to the Euro-zone's unemployment rate for February and the final reading of the Markit manufacturing PMI across the Eurozone for March, all slated to release in a few hours. Additionally, the US ISM as well as the final Markit manufacturing PMI's for March and construction spending data for February, scheduled to release later in the day, will be on investors radar.
The currency pair is showing convergence with its 20 Hr moving average and trading below its 50 Hr moving average.

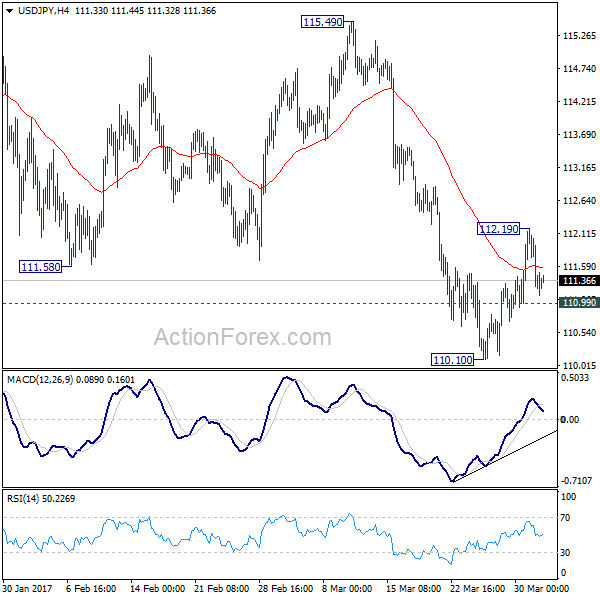
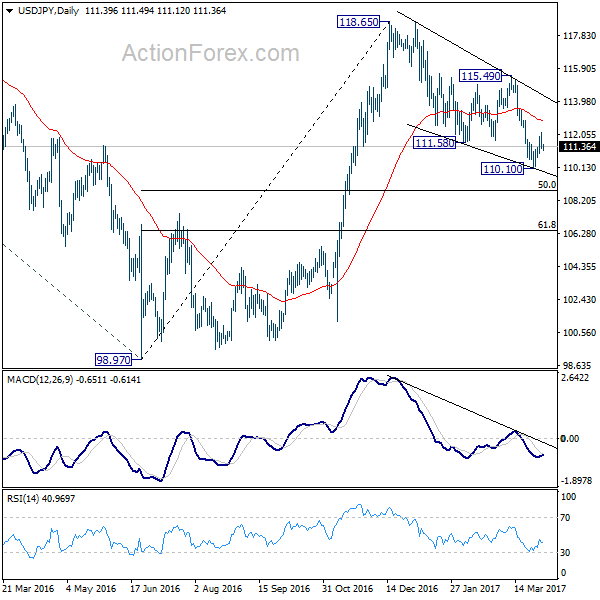
USD/JPY Daily Outlook
Daily Pivots: (S1) 111.02; (P) 111.60; (R1) 111.98; More....
Intraday bias in USD/JPY remains neutral for the moment. On the upside, break of 112.19 temporary will turn bias back to the upside for 115.49 resistance. Decisive break there should confirm completion of the correction from 118.65. In that case, further rise should be seen to 118.65 and above to resume the rally from 98.97. On the downside, though, below 110.99 minor support will turn bias back to the downside for 110.10 and break will extend the corrective fall from 118.65.
In the bigger picture, price actions from 125.85 high are seen as a corrective pattern. The impulsive structure of the rise from 98.97 suggests that the correction is completed and larger up trend is resuming. Decisive break of 125.85 will confirm and target 61.8% projection of 75.56 to 125.85 from 98.97 at 130.04 and then 135.20 long term resistance. Nonetheless, sustained trading below 55 week EMA (now at 111.16) will extend the consolidation from 125.85 with another fall through 98.97 before completion.