Sample Category Title
Fed Hikes At March Policy Meeting, Both Headline Consume Prices And Retail Sales Rise 0.1% In February
'We have seen the economy progress over the last several months in exactly the way we anticipated'. - Janet Yellen, Federal Reserve
As analysts expected, the US Federal Reserve raised interest rates at its March monetary policy meeting on Wednesday amid rising inflation, solid economic growth and the strong labour market. The Central bank lifted its overnight interest rate by 25 basis points to a range of 0.75% to 1.00%. This was the necessary step to get the Bank's monetary policy back to a normal footing. The Fed Chair Janet Yellen said in a statement that the economy performed strong over the last couple of months, in line with policymakers' forecasts. The Fed also confirmed its intention to raise rates at least two more times this year, if the economy remains on the track. Fed officials noted that inflation was close to the Bank's target of 2% and corporate investment rebounded after a few months of weakness. Analysts suggest that interest rates are unlikely to return to a neutral level until the end of 2019. Moreover, some analysts see a faster pace of increases in 2017. Earlier on the day, the Bureau of Labour Statistics reported consumer prices rose 0.1% last month, following January's gains of 0.6% and surpassing analysts' expectations for a 0.0% reading. Meanwhile, core inflation advanced 0.2%, slightly down from a 0.3% climb seen in January but in line with forecasts. Other data released showed retail sales and core retail sales rose 0.1% and 0.2%, respectively.
USDJPY – Strong Bearish Bias After Dovish Fed
The pair came under strong pressure after dovish Fed on Wednesday and extended losses in early Thursday, probing below 113.00 support.
Sharp reversal after multiple failures to break above daily cloud, turned near-term picture into full bearish mode, with long red candle that was left on Wednesday, signaling reversal and weighing strongly on the market.
Fresh weakness cracked 113.13 support (Fibo 61.8% of 111.67/115.49 upleg) with close below it to generate another bearish signal for extension towards next target at 112.57 (Fibo 76.4%).
Broken daily Kijun-sen offers initial resistance at 113.58, with thickening daily cloud (cloud base lies at 114.17 today), maintaining strong pressure and expected to cap upticks.
Res: 113.58' 114.07' 114.17' 114.87
Sup: 113.13' 112.89' 112.57' 112.00
GBPUSD – Overall Picture Remains Bearish Despite Yesterday’s Strong Rally
Yesterday's strong rally that spiked to 1.2306 sidelined immediate downside pressure and signaled near-term base at 1.2140 zone, where multiple downside rejections were seen in recent days.
However, overall picture remains negative as daily studies are in the negative territory and MA's in bearish setup.
This suggests that selling upticks scenario is still in play, as the pair cracked pivot at 1.2300 but failed to clearly break it (the rally stalled just under falling 20SMA, currently at 1.2315).
Lower pivot lies at 1.2210 (daily Tenkan-sen) and return below it would signal renewed attempt lower for final close below 1.2155 trigger (Fibo 76.4% of 1.1986/1.2704 rally).
On the other side, sustained break above 1.2343 (daily Kijun-sen) would signal extended recovery towards daily Ichimoku cloud (spanned between 1.2379 and 1.2435).
Res: 1.2308' 1.2315' 1.2343' 1.2379
Sup: 1.2249' 1.2231' 1.2210' 1.2183
EUR/GBP Elliott Wave Analysis
EUR/GBP – 0.8739
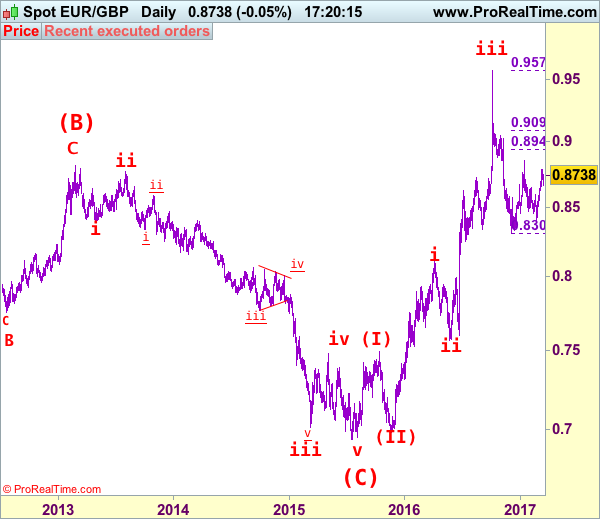
EUR/GBP – The major (A)(B)(C)-(X)-(A)(B)(C) correction from 0.9805 is unfolding and 2nd (A) has possibly ended at 0.6936.
As the single currency has eased after meeting resistance at 0.8788, suggesting minor consolidation below this level would be seen and pullback to 0.8650-60 cannot be ruled out, however, reckon downside would be limited to 0.8630 and renewed buying interest should emerge around 0.8600, bring another rise later. Above said resistance at 0.8788 would extend the rebound from 0.8403 towards indicated resistance at 0.8857 which is likely to hold from here.
Our latest preferred count is that the wave V of a 5-wave series from 0.5682 ended at 0.9805 earlier and major from there has possibly ended at 0.8067 as A-B-C-X-A-B-C. We are keeping our view that the entire correction from 0.9805 has possibly ended at 0.7756 and as labeled as the attached daily chart and impulsive move from 0.9084 has ended at 0.7756 as a 5-waver which marked either the (C) wave or the A leg of (C), a daily close above resistance at 0.8831 would suggest (C) leg has ended and headway towards 0.9084.
On the downside, whilst pullback to 0.8650-60 cannot be ruled out, reckon downside would be limited to 0.8600 and bring another rise later. Below 0.8545-50 would defer and suggest top is formed instead, and risk weakness to 0.8500-10 but break there is needed to provide confirmation and suggest the rebound from 0.8403 has ended.
Recommendation: Buy at 0.8600 for 0.8750 with stop below 0.8500.
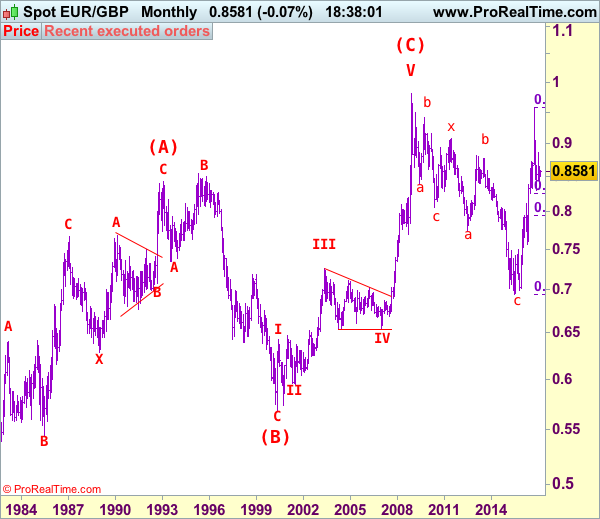
Euro's long term uptrend started in Feb 1981 at 0.5039 and is unfolding as a (A)-(B)-(C) move with (A): 0.8433 (Feb 1993), (B): 0.5682 (May 2000) and impulsive wave (C) should have ended at 0.9805 with wave III ended at 0.7254 (May 2003), triangle wave IV at 0.6536 (23 Jan 2007) and wave V as well as wave (C) has ended at 0.9805.
We are keeping an alternate count that only wave III ended at 0.9805 and the correction from there is the wave IV and may extend weakness to 0.7700, however, it is necessary to see a daily close above resistance at 0.9143 would change this to be the preferred count.
USD/CAD Elliott Wave Analysis
USD/CAD – 1.3507
USD/CAD – Wave v ended at 0.9407 and a-b-c correction may extend gain to 1.4700
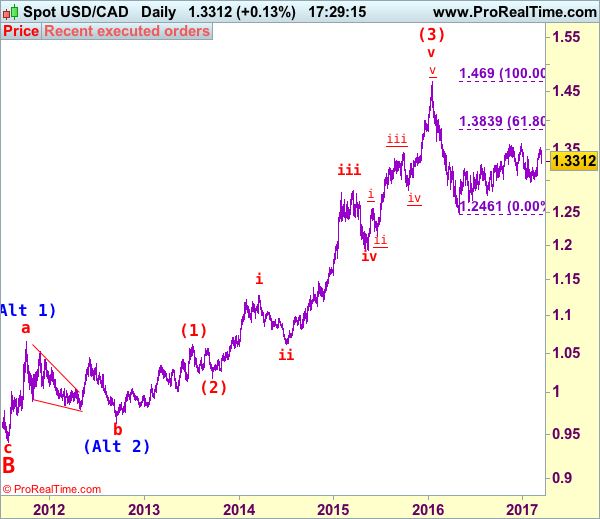
As the greenback has retreated after surging to 1.3535 late last week, suggesting minor consolidation below this level would be seen and pullback to 1.3395-00 cannot be ruled out, however, reckon downside would be limited to 1.3370-75 and bring another rise later. A break of said resistance at 1.3535 would signal the rise from 1.2969 is still in progress for retest of 1.3599 top, once this level is penetrated, this would confirm the erratic rise from 1.2461 low has resumed for a stronger correction of early decline from 1.4690 (2016 high) to 1.3700 and later towards 1.3790-00, however, reckon upside would be limited to 1.3835-40 (61.8% Fibonacci retracement of 1.4690-1.2461) and bring retreat later.
We are keeping our view that the wave b from 1.0657 (a leg top) has possibly ended at 0.9633 with (a): 0.9800, wave (b): 1.0447 and wave c at 0.9633, the subsequent rise from there is now treated as wave c exceeded indicated upside target at 1.3770-80 and 1.4000 and wave (3) has possibly ended at 1.4690 and wave (4) correction has commenced for retracement back to 1.2832 support, then 1.2410-20.
On the daily chart, our latest preferred count remains that the A of (B) rally from 0.9059 low (7 Nov 2007) unfolded into an impulsive wave with i: 0.9059-1.0380, ii ended at 0.9819, iii at 1.3019 followed by triangle wave iv at 1.2026 , then wave v formed a top at 1.3066 and also ended the wave A. The wave B is unfolding as an double three a-b-c-x-a-b-c and is sub-divided as a: 1.2192, b: 1.2716 and wave c at 1.0784, followed by wave x at 1.1725, another set of a-b-c unfolded with 2nd a at 0.9931, 2nd b at 1.0674. the 2nd c has possibly ended at 0.9407, therefore, consolidation with upside bias is seen for major correction, indicated target at 1.3900 had been met and gain to 1.4700 would follow.
On the downside, whilst pullback to 1.3395-00 cannot be ruled out, reckon downside would be limited to 1.3370-75 and bring another upmove to aforesaid upside targets. Below 1.3290-00 would defer and suggest a temporary top is formed, bring correction to 1.3275-80 and then test of previous resistance at 1.3210-12 (now support). Only below this level would suggest the rebound from 1.2969 has ended and prolong choppy trading, bring weakness to 1.3100 but downside should be limited to 1.3056 support, bring rebound later.
Recommendation: Buy at 1.3380 for 1.3580 with stop below 1.3280.
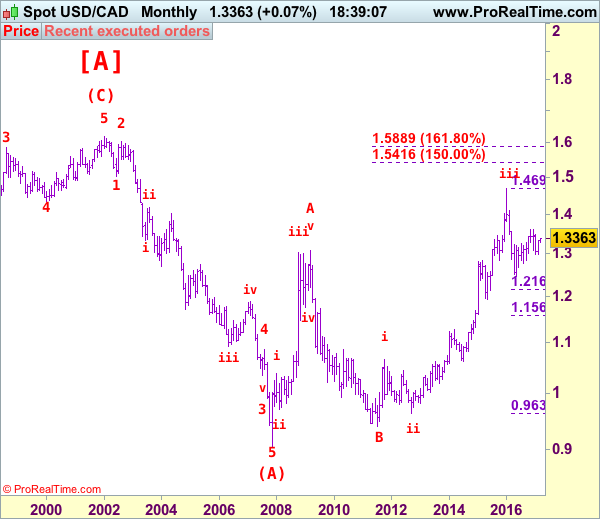
Longer term - The selloff from 1.6194 (21 Jan 2002) to 0.9059 (07 Nov 2007) is viewed as (A) wave which is a 5-waver as labeled on the monthly chart as below, the subsequently rally is labeled as (B) with impulsive A leg of (B) ended at 1.3066, wave B of (B) is unfolding which has either ended at 0.9407 or would extend one more fall but downside should be limited to 0.9200 and 0.9000 should hold.
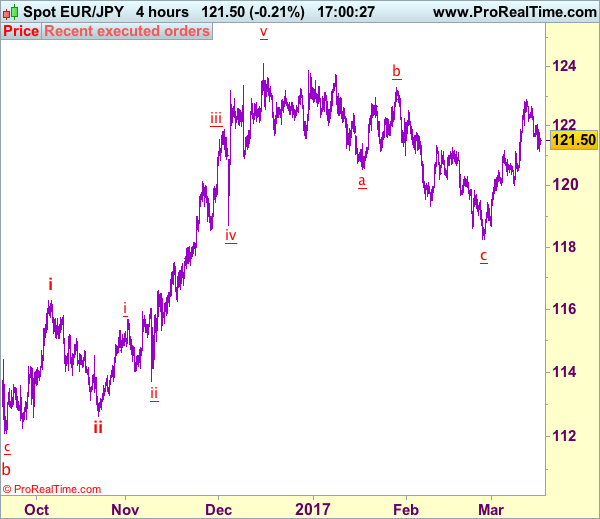
Trade Idea: EUR/JPY – Buy at 121.30
EUR/JPY - 121.51
Recent wave: wave v of (C) ended at 94.12 and major correction in wave A has ended at 149.79
Trend: Near term up
Original strategy:
Exit long entered at 121.80,
Position: - Long at 121.80
Target: -
Stop: -
New strategy :
Buy at 121.30, Target: 123.30, Stop: 120.70
Position: -
Target: -
Stop:-
Although the single currency slipped again today, as this move from 122.89 is viewed as retracement of recent upmove, reckon downside would be limited to 121.10-15 and bring rebound later, above resistance at 122.06 would suggest low is possibly formed, bring test of previous support at 122.14 but break of latter level is needed to add credence to this view, bring another test of said resistance at 122.89, above there would revive bullishness and extend recent rise from 118.24 to 123.30-35. Looking ahead, a sustained breach above this level is needed to retain bullishness and signal early erratic fall from 124.10 top has ended at 118.24, bring further rise to 123.85-90 first.
In view of this, we are looking to reinstate long on dips. Below 120.90-00 would defer and risk correction of recent upmove to 120.45-50 but downside should be limited and price should stay well above support at 120.02 and bring another rise later.
Our latest preferred count is that wave (ii) is ABC-X-ABC which ended at 123.33 and wave (iii) is unfolding with wave iii ended at 100.77, followed by wave iv at 111.57 and wave v as well as the wave (iii) has ended at 97.04, followed by wave (iv) at 111.43 and wave (v) has ended at 94.12 which is also the end of the larger degree v, this also implied the major wave (C) has also ended there, hence major correction has commenced from there with (A) leg unfolding in its lower degree wave c which has possibly ended at 145.69. Under this count, A-B-C wave (B) has commenced with A leg ended at 136.23, wave B at 143.79 and wave C has possibly ended at 149.79.
Our larger degree count is that the decline from 139.26 is wave (C) and is sub-divided into a diagonal triangle i-ii-iii-iv-v with wave i - 105.44, wave ii- 123.33, wave iii - 97.03, wave iv - 111.43, followed by the final wave v as well as the end of wave (C) at 94.12, this also mark the bottom of larger degree wave B. Under this count, major rise in wave C has commenced as an impulsive wave with minor wave III ended at 145.69, wave V is still in progress for further gain to 150.00. Having said that, this so-called wave V could well be the first leg of larger degree 5-waver wave C and this wave C should bring at least a retest of wave A top at 169.97 (July 2008).
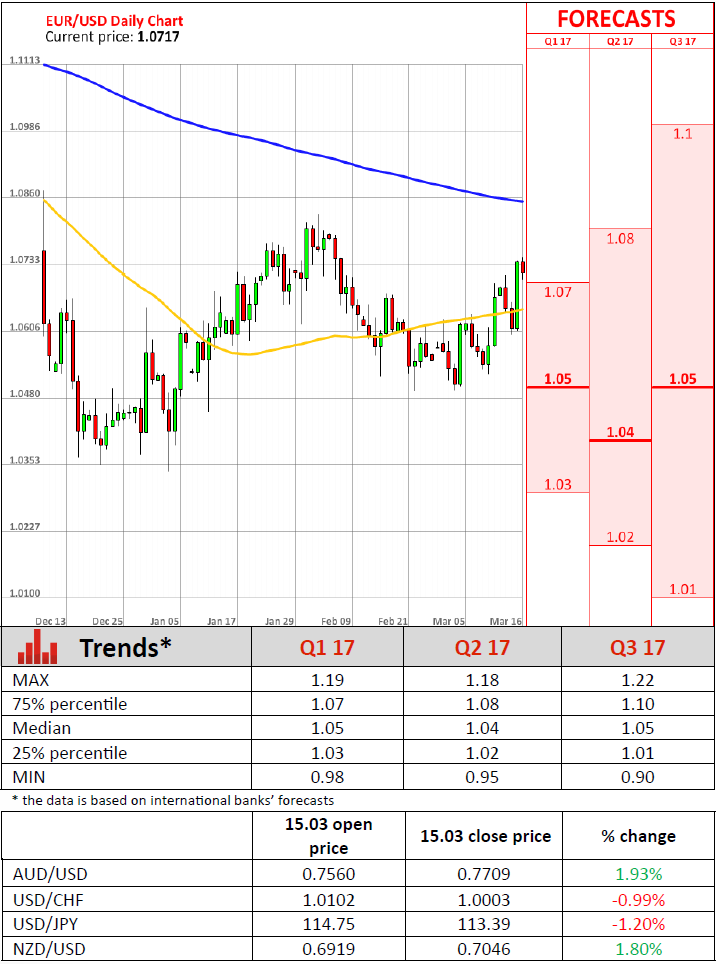
EURUSD – Strong Bullish Sentiment To Persist Above Daily Cloud
The Euro is holding steady above 1.0700 handle in early Thursday, following strong rally after Fed hiked rates but delivered dovish comments about future steps. Firm break and close above key barriers at 1.0653 (100 SMA / daily cloud top) and 1.0700 (Fibo 61.8% pivot) is seen as strong bullish signal for further advance. The pair hit one month high at 1.0745 so far, just ahead of next target at 1.0748 (Fibo 76.4%). Corrective easing could be expected on overbought conditions of 4-hour studies, with initial support at 1.0700 and more significant daily cloud top support (currently at 1.0680). Extended dips should not exceed 1.0650 (100 SMA) in order to keep bullish structure intact. Break above 1.0748 would expose 1.0800 and key short-term barrier at 1.0827 (2017 high, posted on 02 Feb).
Res: 1.0748, 1.0800, 1.0827, 1.0872
Sup: 1.0700, 1.0680, 1.0650, 1.0634
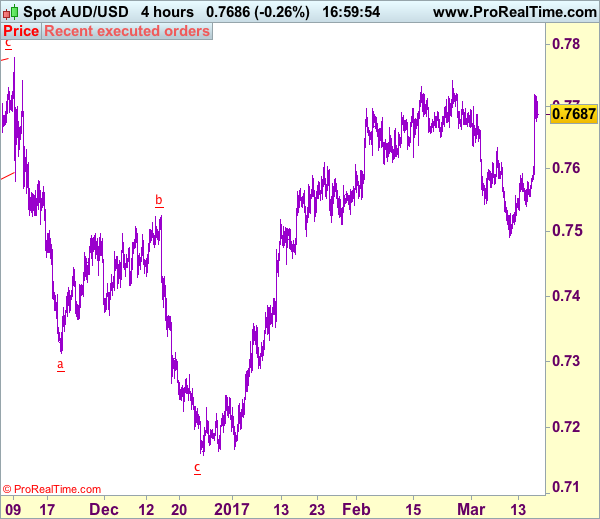
Trade Idea: AUD/USD – Buy at 0.7650
AUD/USD – 0.7687
Recent wave: Wave 5 ended at 1.1081 and major correction has commenced for fall to 0.7000 and then towards 0.6500-10
Trend: Near term up
New strategy :
Buy at 0.7640, Target: 0.7775, Stop: 0.7580
Position: -
Target: -
Stop:-
As aussie has surged after brief pullback, adding credence to our view that low has been formed at 0.7491 and mild upside bias remains for the rise from 0.7491 low to extend further gain to 0.7741 resistance, break there would signal early upmove has resumed for headway towards last year’s high at 0.7778 which is likely to hold on first testing. Looking ahead, a break of this level would retain bullishness and extend medium term upmove to 0.7840-50 but price should falter below 0.7900.
In view of this, we are looking to buy aussie on dips as 0.7640-50 should limit downside and bring another rise later. Only below previous resistance at 0.7592 would abort and signal top is formed instead, then further choppy trading would take place and risk is seen for pullback to 0.7530-40 but said support at 0.7491 should remain intact.
On the 4-hour chart, the move from 0.8066 is the wave 5 with i: 0.8860, ii: 0.8315, wave iii is an extended move ended at 1.0183, iv: 0.9706 and wave v has ended at 1.1081 (also the top of entire wave 5). The subsequent selloff is the major correction which is unfolding as ABC-X-ABC and 2nd A leg has ended at 0.8848, followed by a-b-c wave B which ended at 0.9758, hence, 2nd C wave is now in progress and indicated downside target at 0.7000 and 0.6950 had been met, so further fall to 0.6710-20 cannot be ruled out.
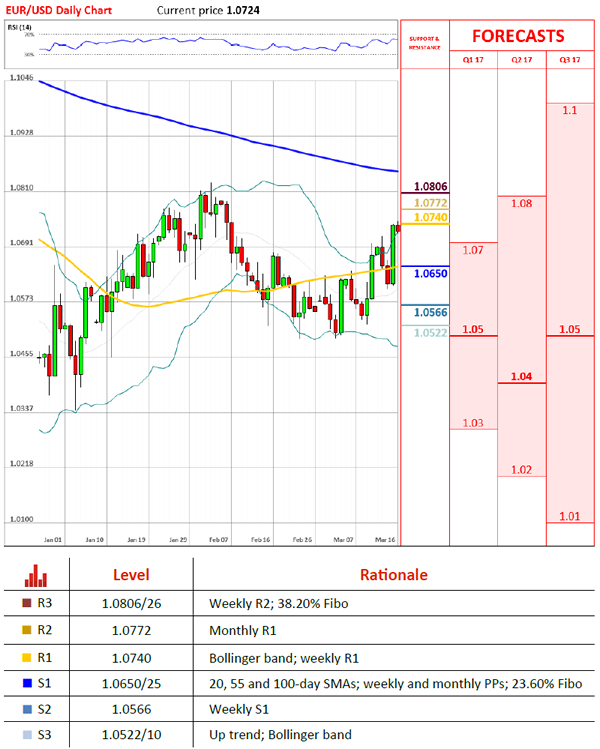
EUR/USD Trades Below 1.0750 Mark
'The Fed's outlook hasn't changed much from where they were in December, but the markets had gone overboard with rate hike expectations.' – Norihiro Fujito, Mitsubishi UFJ Morgan Stanley Securities Co. (based on Bloomberg)
Pair's Outlook
During the early hours of Thursday's trading session the common European currency was consolidating against the US Dollar, as the rate moved slightly lower. First of all it has to be noted that the pair jumped on the Federal Reserve rate announcement, breaking a strong resistance cluster, which kept the pair lower previously. Moreover, the currency exchange rate broke the resistance of a long term descending channel. The jump stopped at the weekly R1, which is located at the 1.0740 level. In face of this resistance the pair bounced off and began to consolidation. It is most likely that the rate will fall throughout the day before setting a new course in the near future.
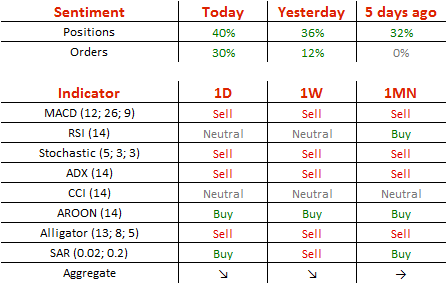
Traders' Sentiment
SWFX traders are bearish on the pair, as 56% of open positions are short. Meanwhile, 64% of trader set up orders are to sell the Euro.
GBP/USD In Limbo Around 1.23
'Data, politics and widening yield spreads should override rising short positioning as GBP/USD slides towards 1.20, if not 1.1850, even though broader range trading is likely to remain.' – Westpac (based on FXStreet)
Pair's Outlook
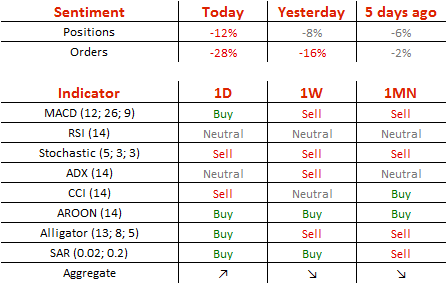
The psychological 1.2150 mark once again successfully provided strong support, causing the Cable to rebound and put the 1.23 major level to the test yesterday. However, the pair was reluctant to maintain trade above 1.23, suggesting that a bearish correction could occur today. The BoE's meeting results could be negative for the Pound today, in which case most of yesterdays gains risk getting erased. Technical indicators are also in favour of the bearish scenario; on the other hand, the Sterling is seen taking another step towards the down-trend at 1.2450 if the BoE is hawkish today. We maintain a relatively positive outlook, with the trend-line expected to be reconfirmed in the near future.
Traders' Sentiment
There are 70% of traders holding long positions today (previously 68%), while the share of purchase orders inched up 56 to 65%.