Sample Category Title
US Dollar Sinks After Rate Increase To 1%
Currency pair EUR/USD
Investors and traders were looking for a direction from the Federal Reserve (Fed) yesterday regarding the potential path of interest rate hikes during 2017. The Fed indicated that it expects 3 rate hikes during 2017, which seems to match expectations of the market.
Despite the interest rate increase from 0.75% to 1%, the US Dollar declined against other major currencies. The rate increase seemed to have already been priced. Another contributing factor was the lack of an even stronger hawkish tone (more rate hikes) in the meeting minutes from the Fed.
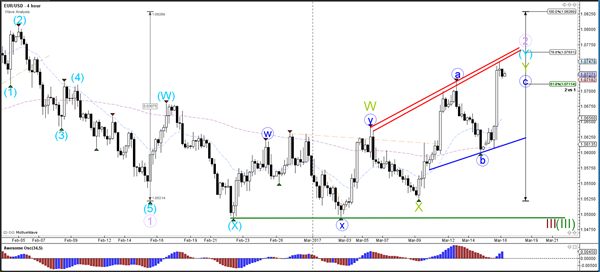
The EUR/USD found support after the Fed news event, which has been labelled as a wave B (blue) in a larger ABC (blue) correction. The wave 2 (purple) is now approaching a key 78.6% Fibonacci resistance level. A break above the 100% level remains the invalidation point for the larger daily bearish trend.

Currency pair GBP/USD
The GBP/USD also showed a bullish bounce just as the EUR/USD. Price has now reached a potential resistance zone with Fibs and a trend line (orange). A break above the 61.8% makes a wave 4 (blue) unlikely.
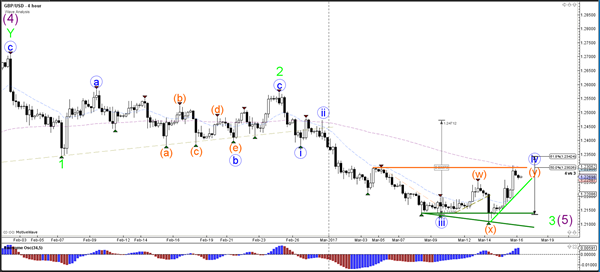
The GBP/USD broke above resistance (dotted red) and invalidated yesterday's wave 4. A larger ABC (pink) zigzag seems to be taking place. A break below the support lines (blue/green) could indicate a bearish breakout but for the moment one more push higher is possible within wave 4-5 (purple).

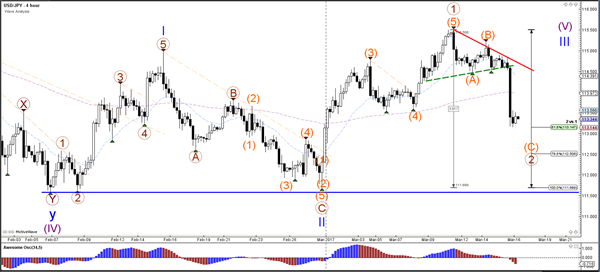
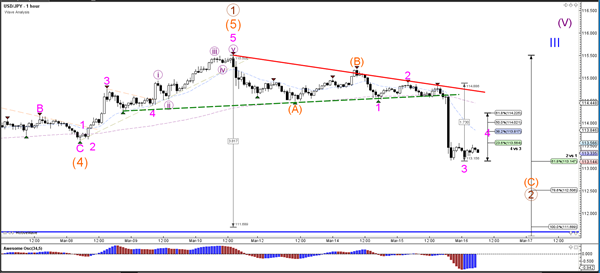
Currency pair USD/JPY
The USD/JPY seems to have completed a wave 4 (purple) at a shallow Fibonacci level from the daily-weekly charts, which makes a larger uptrend more likely. The uptrend stays intact if price manages to stay above the 100% Fibonacci level of wave 2 (blue/brown).
The USD/JPY broke below the support trend line (dotted green) and expanded the bearish correction.
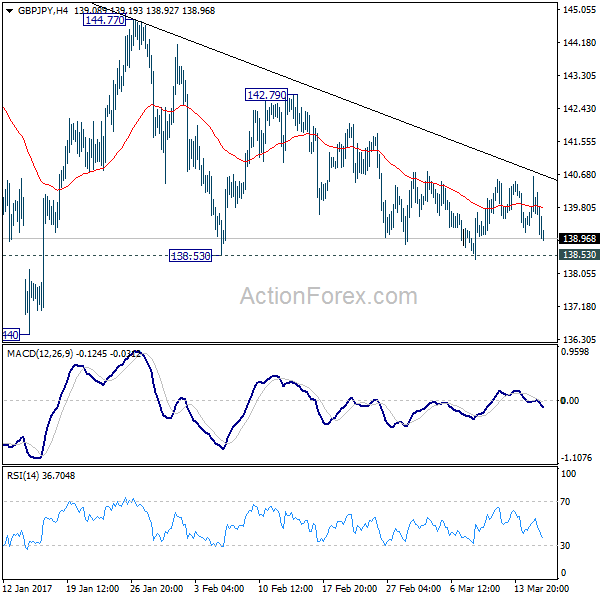
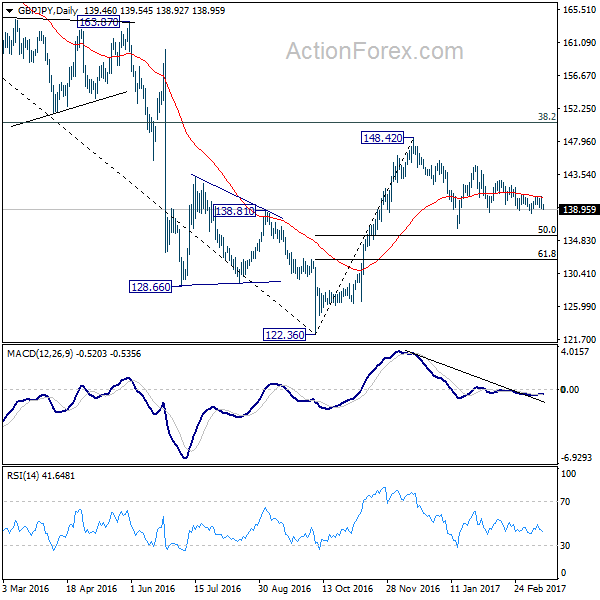
GBP/JPY Daily Outlook
Daily Pivots: (S1) 138.73; (P) 139.67; (R1) 140.25; More...
Intraday bias in GBP/JPY remains neutral for the moment as it's bounded in choppy trading inside range of 138.53/142.79. Price actions from 148.42 are viewed as a consolidation pattern. On the downside, break of 138.53 support will bring deeper decline to 136.44 support and possibly below. However, we'd expect strong support at 50% retracement of 122.36 to 148.42 at 135.39 to bring rebound. On the upside, above 142.79 will turn bias back to the upside for 144.77 and above.
In the bigger picture, price actions from 122.36 medium term bottom are still seen as a corrective pattern. Main focus is on 38.2% retracement of 195.86 to 122.36 at 150.42. Rejection from there will turn the cross into medium term sideway pattern with a test on 122.36 low next. Though, sustained break of 150.42 will extend the rebound towards 61.8% retracement at 167.78.
EUR/JPY Daily Outlook
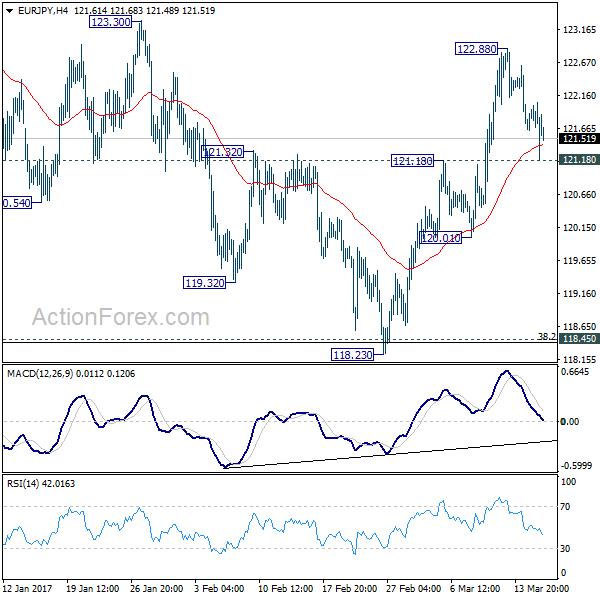
Daily Pivots: (S1) 121.22; (P) 121.64; (R1) 122.07; More...
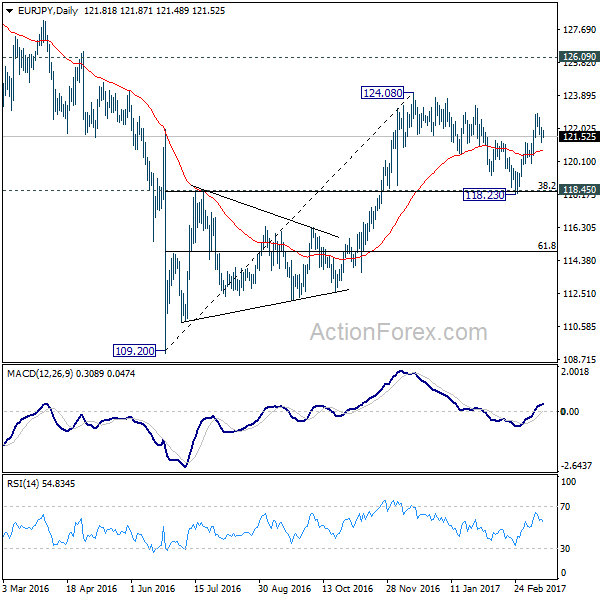
Intraday bias in EUR/JPY remains neutral as consolidation from 122.88 temporary top continues. Such consolidation could extend further. But downside should be contained by 121.18 resistance turned support and bring another rally. Above 122.88 will target 124.08. Decisive break there will extend larger rise from 109.20 and target 126.09 key resistance next. However, firm break of 121.18 will likely extend the whole corrective pattern fro 124.08 with another falling leg towards 118.23 low again.
In the bigger picture, current development suggests that medium term rise from 109.20 is still in progress. Focus is now on 126.09 key resistance level. Sustained break will confirm completion of the whole decline from 149.76. And rise from 109.20 is of the same degree as the fall from 149.76. In such case, further rally would be seen to 104.04 resistance and possibly above before topping. Meanwhile, rejection from 126.09 will extend the fall from 149.76 through 109.209 low.
EUR/GBP Daily Outlook
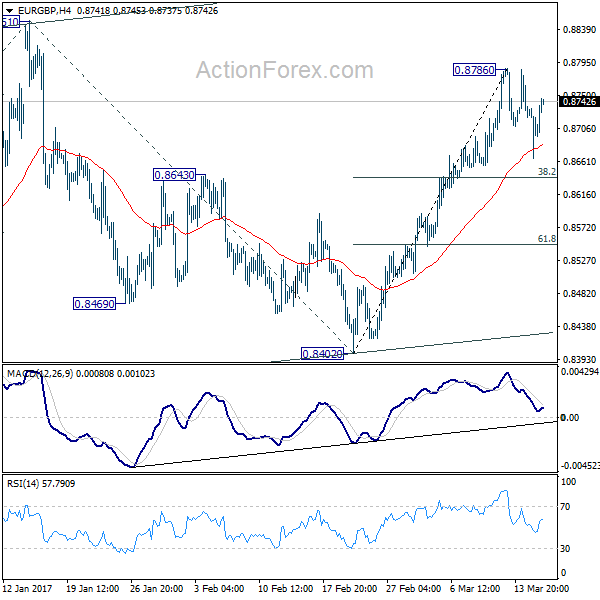
Daily Pivots: (S1) 0.8686; (P) 0.8711; (R1) 0.8757; More...
Intraday bias in EUR/GBP remains neutral as consolidation from 0.8786 continues. Deeper retreat cannot be ruled out. But downside should be contained by 38.2% retracement of 0.8402 to 0.8786 at 38.2% retracement of 0.8402 to 0.8786 at 0.8639 and bring another rise. Above 0.8786 will target 0.8851 resistance and above. However, price actions from 0.8303 are seen as the second leg of the corrective pattern from 0.9304. Hence, we'd expect strong resistance from 100% projection of 0.8303 to 0.8851 from 0.8402 at 0.8950 to limit upside.
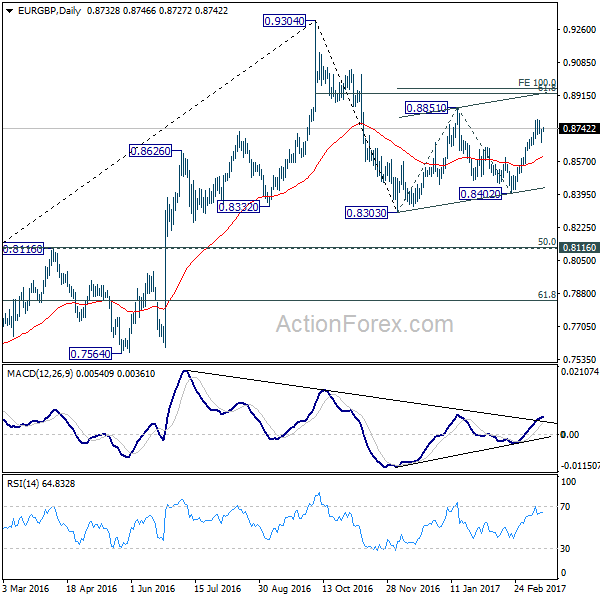
In the bigger picture, price actions from 0.9304 are viewed as a medium term corrective pattern. Deeper fall cannot be ruled out yet. But we'd expect strong support from 0.8116 cluster support (50% retracement of 0.6935 to 0.9304 at 0.8120) to contain downside. Overall, the corrective pattern would take some time to complete before long term up trend resumes at a later stage. Break of 0.9304 will pave the way to 0.9799 (2008 high).
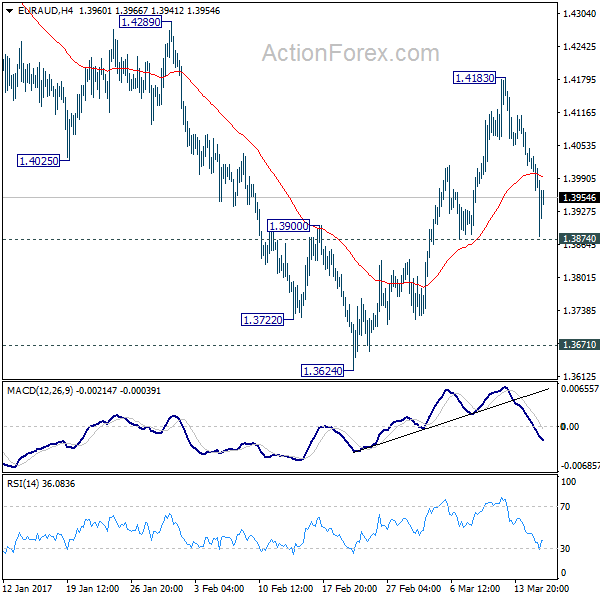
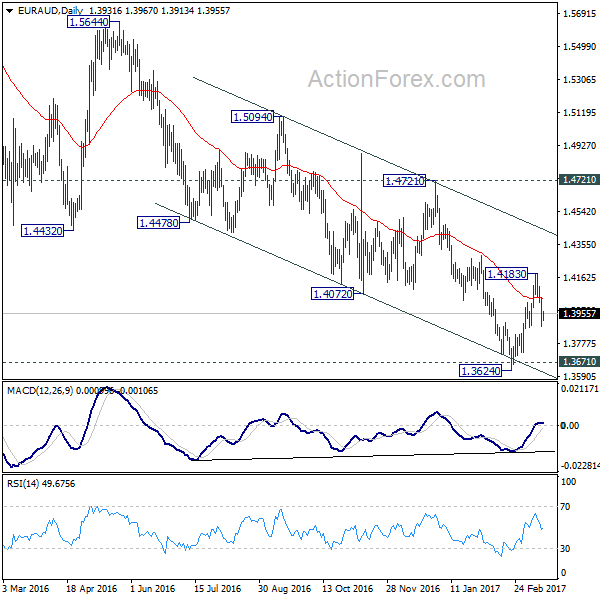
EUR/AUD Daily Outlook
Daily Pivots: (S1) 1.3849; (P) 1.3949; (R1) 1.4017; More...
EUR/AUD's pull back from 1.4183 extended lower but it's still holding on to 1.3874 support. Intraday bias remains neutral first. At this point, we're still favoring the case of medium term trend reversal defending key support level at 1.3671, on bullish convergence condition in daily MACD. Above 1.4183 will turn bias back to the upside for 1.4289 resistance. Sustained break there will affirm our bullish view and target 1.4721 key resistance next. However, break of 1.3874 will dampen our view and turn bias to the downside for 1.3624 low.
In the bigger picture, price actions from 1.6587 medium term top are viewed as a corrective pattern. We'd expect strong support from 1.3671 key level to contain downside and bring rebound. Up trend from 1.1602 should not be finished and will resume later. Break of 1.4721 resistance will indicate completion of such correction and turn outlook bullish for retesting 1.6587 high. However, sustained break of 1.3671 will invalidate our bullish view and would turn focus back to 1.1602 long term bottom.
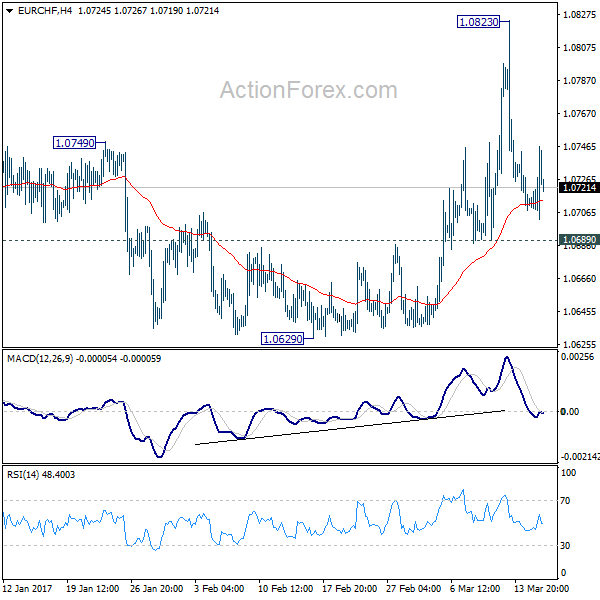
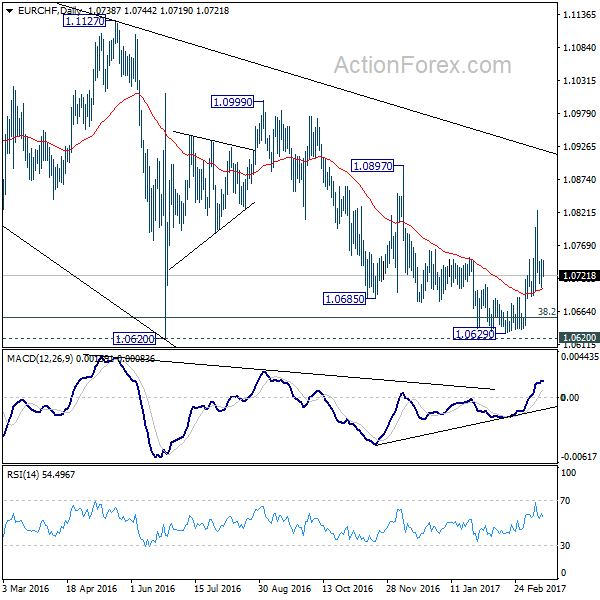
EUR/CHF Daily Outlook
Daily Pivots: (S1) 1.0713; (P) 1.0723; (R1) 1.0745; More...
Intraday bias in EUR/CHF remains neutral for the moment. With 1.0689 minor support intact, we continue to favor the case of trend reversal, on bullish convergence condition in daily MACD, after defending 1.0620 key support level. That is, correction from 1.1198 could have completed. Above 1.0823 will target 1.0897 resistance next. However, break of 1.0689 support will dampen our view and turn focus back to 1.0629 low again.
In the bigger picture, the decline from 1.1198 is seen as a corrective move. Decisive break of 1.0897 resistance should confirm that it's completed. And in that case, larger up trend is resuming for another high above 1.1198. Meanwhile, sustained trading below 38.2% retracement of 0.9771 to 1.1198 at 1.0653 will target 50% retracement at 1.0485.
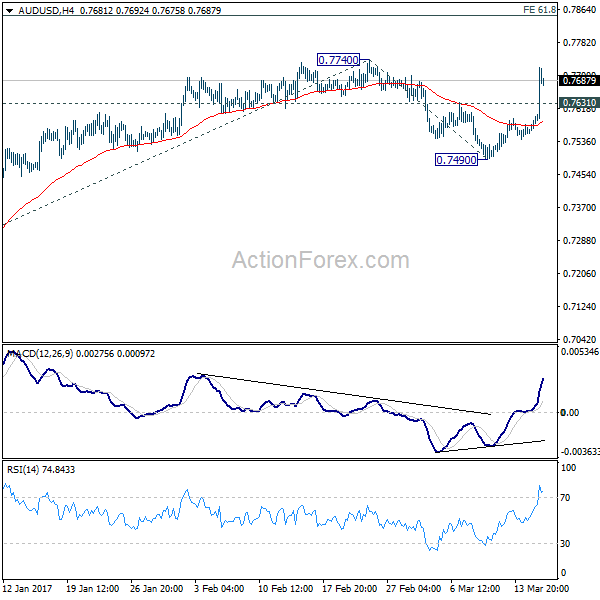
AUD/USD Daily Outlook
Daily Pivots: (S1) 0.7603; (P) 0.7661; (R1) 0.7767; More...
AUD/USD's strong rebound and break of 0.7631 resistance indicates that the pull back from 0.7740 is completed. The development indicates that rise from 0.7158 is likely resuming. Intraday bias is back on the upside for 0.7740 resistance first. Decisive break there will target 61.8% projection of 0.7158 to 0.7740 from 0.7490 at 0.7850 next. That coincides with key long term retracement level at 0.7849. On the downside, outlook will stay bullish now as long as 0.7490 support holds, in case of retreat.
In the bigger picture, we're still treating price actions from 0.6826 low as a correction. And, as long as 38.2% retracement of 0.9504 to 0.6826 at 0.7849 holds, long term down trend from 1.1079 is expected to resume sooner or later. Break of 0.6826 low will target 0.6008 key support level. However, firm break of 0.7849 will indicate that rise from 0.6826 is developing into a medium term rebound, rather than a sideway pattern. In such case, stronger rise should be seek to 55 month EMA (now at 0.8185) and above.
EURGBP Prepares To Take A Tumble
Key Points:
- Price action trading within a descending wedge.
- RSI Oscillator close to overbought levels.
- Watch for a breakdown towards the bottom of the wedge in the coming days.
The last few weeks have been relatively interesting for the EURGBP as the pair has continued to remain bullish as the UK seemingly grappled with budget planning issues ahead of the Brexit. However, despite the pair’s relative ascendency price action is now coming close to a key reversal zone that could see the pair trending lower in the coming days.
Taking a look at the charts provides some interesting clues to the EURGBP’s direction in the coming days. Presently, price action is caught in a wedge style formation that has seemingly capped its recent movements. However, it’s a descending wedge and the highs are subsequently becoming lower thereby increasing the downside pressure. In addition, the RSI Oscillator has trended higher and is now closing in on oversold territory indicating that a directional change could be coming.
Also, the diverging economic status of the Eurozone and the UK is now becoming clearer as the market digests the pending risks of a Brexit. The latest data seems to imply that the majority of the downside risk over the medium term is actually on the European side and that the UK may actually not experience a recession, despite the recent scare mongering of the anti-Brexit crowd. Subsequently, the Pound is likely to see some resurgence, albeit on a fundamental basis, against the Euro in the coming months.
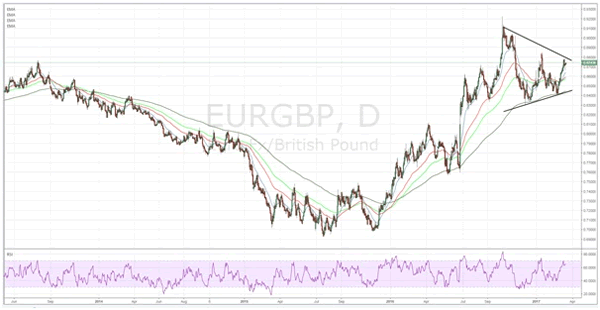
Ultimately, the short term is likely to mean a downside move for the pair given the descending wedge and the oversold RSI Oscillator. The most likely scenario would involve price action pulling back from its current level, around the 0.8742 mark, back towards the bottom of the current wedge at 0.8450. However, given the depth of the recent appreciation, a deeper breakdown below the wedge could yield a move back towards the0.82 handle. Subsequently, there are plenty of benefits to the short positioning for this pair in the near term.
Silver’s Post-FOMC Gains Could Be Eroded Moving Forward
Key Points:
- Despite gains, silver hasn't shaken its technical bias.
- 100 day EMA remains bearish.
- Strongerhawkish tone from Yellen could help to encourage a downtrend.
Silver risks losing its post-FOMC gains in the coming session if it can't shake off some of its bearish technical bias. Specifically, unlike gold, the metal needs to convincingly push through that 100 day EMA and invert its Parabolic SAR before we can begin to have any degree of certainty that yesterday's freshly-made ground isn't going to be ceded.
The first technical reading suggestive of a near-term decline is that aforementioned 100 day moving average. Quite clearly, silver prices have had some difficulty pushing beyond the 100 day EMA which comes as little surprise given the broadly bearish bias of the 12 and 20 day measures. As a result of this, market participants will be viewing the current zone of resistance as a near-term impasse which could herald a subsequent reversal.
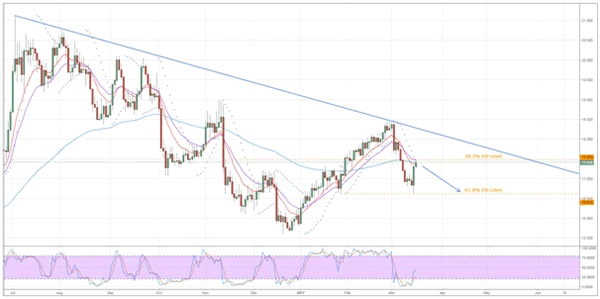
Indeed, further losses would be in line with silver's Parabolic SAR bias which remains stubbornly bearish. Whilst it is true that the reading is on the very cusp of inverting, the metal seems to be struggling to recruit enough support to make that final surge above the 38.2% Fibonacci level. However, unless this retracement is breached, chances of seeing that bias shift remain fairly slim.
What's more, moving in step with the long-term bearish trend line is now looking more than reasonable given a conspicuous lack of support from the stochastic oscillator. Until the prior session, the highly oversold reading had been largely responsible for militating against downside risks. Now however, the oscillator is firmly neutral which leaves the bears rather well positioned to erode some of the recent gains.
Ultimately, if we do see a decline take hold again, losses could extend back to the 16.62 mark and beyond. Although, the presence of the 61.8% Fibonacci level around this price will likely provide a near-term cap on losses. Furthermore, the fundamental environment will be highly important as the metal moves towards this point so keep an eye on the news feed, especially for any hint of a slightly more hawkish tone from Yellen.
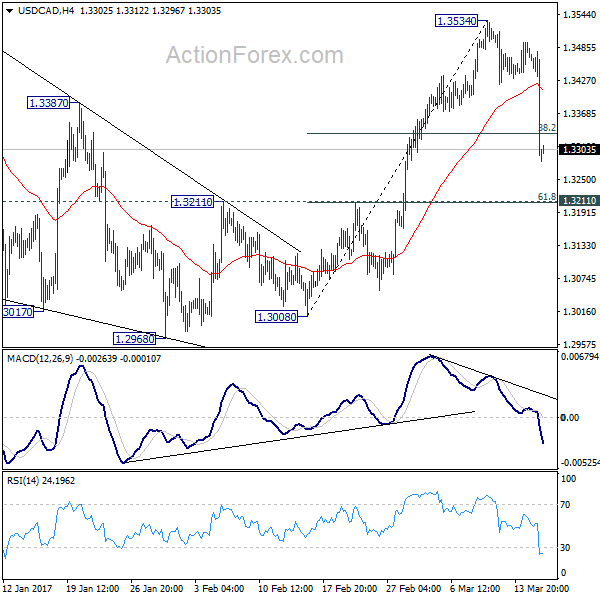
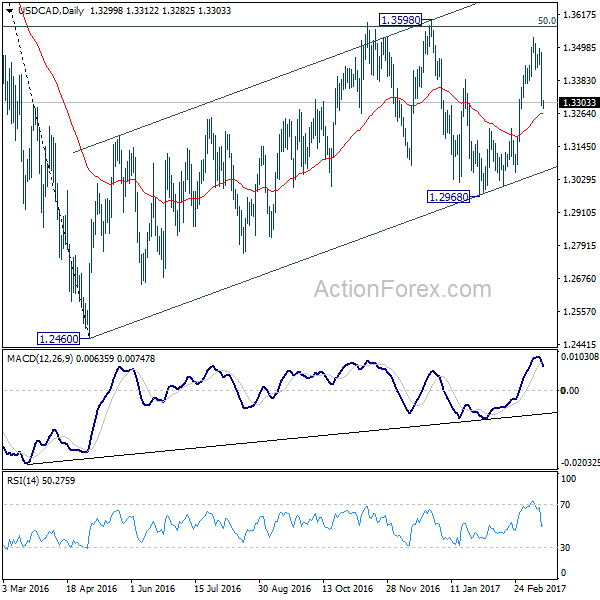
USD/CAD Daily Outlook
Daily Pivots: (S1) 1.3238; (P) 1.3360; (R1) 1.3426; More...
USD/CAD's pull back from 1.3534 accelerates to as low as 1.3282 so far. The strong break of 38.2% retracement of 1.3008 to 1.3534 at 1.3333 indicates deeper decline is underway. We'd expect strong support at 1.3211 cluster level (61.8% retracement at 1.3209) to contain downside and bring rebound. At this point, we'd still expect larger rise from 1.2460 to extend through 1.3598 resistance. However, sustained break of 1.3211 will dampen this view and target 1.2968 key support level next.
In the bigger picture, price actions from 1.4689 medium term top are seen as a correction pattern. The first leg has completed at 1.2460. The second leg, started from 1.2460, is likely still in progress and could target 61.8% retracement of 1.4689 to 1.2460 at 1.3838. We'd look for reversal signal there to start the third leg. Break of 1.2968 wold at least bring at retest of 1.2460 low. However, sustained trading above 1.3838 would pave the way to retest 1.4689 high.