Sample Category Title
Daily Technical Outlook And Review
A note on lower timeframe confirming price action...
Waiting for lower timeframe confirmation is our main tool to confirm strength within higher timeframe zones, and has really been the key to our trading success. It takes a little time to understand the subtle nuances, however, as each trade is never the same, but once you master the rhythm so to speak, you will be saved from countless unnecessary losing trades. The following is a list of what we look for:
- A break/retest of supply or demand dependent on which way you're trading.
- A trendline break/retest.
- Buying/selling tails ... essentially we look for a cluster of very obvious spikes off of lower timeframe support and resistance levels within the higher timeframe zone.
- Candlestick patterns. We tend to only stick with pin bars and engulfing bars as these have proven to be the most effective.
EUR/USD
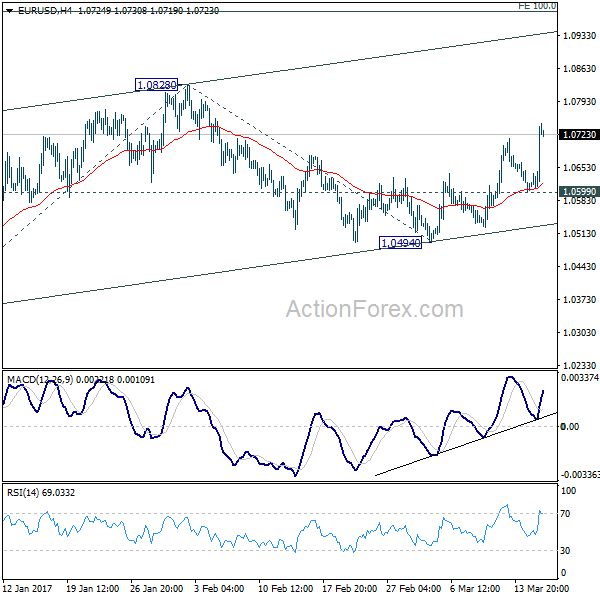
Following the FOMC's decision to raise interest rates by 25bps, the US dollar plummeted lower and the EUR aggressively advanced. While this is not the ‘expected' reaction to such an outcome, we believe the market wanted somewhat more of a hawkish response from the Fed Chair, which did not transpire. Furthermore, we feel the dollar was further weakened by the ‘dot plot' scenario that has showed little change since December.
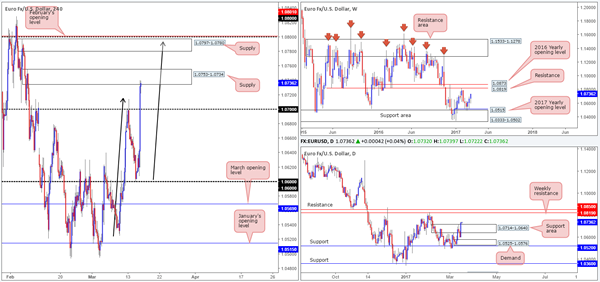
Thanks largely to yesterday's rally, weekly bulls look to be on course to connect with the weekly resistance at 1.0819, followed closely by the 2016 yearly opening level at 1.0873. Looking down to the daily candles, price ran through the top edge of daily supply at 1.0714-1.0640 (now acting support area) yesterday, and now looks free to challenge the above noted weekly resistance and nearby daily resistance at 1.0850.
While the higher timeframes suggest further buying may be on the cards, H4 action is currently seen teasing the underside of a H4 supply zone coming in at 1.0753-1.0734. A break above this hurdle could lead to a continuation move north up to the H4 supply at 1.0797-1.0780, which happens to be shadowed closely by Feb's opening level at 1.0801 and the 1.08 handle.
Our suggestions: Despite higher-timeframe direction pointing to a move north, we are not going to be buying into a H4 supply zone! A break above this area, however, would likely call for a move north up to the next H4 supply at 1.0797-1.0780. A short from here is a little more appealing given that it fuses closely with Feb's opening level at 1.0801, the 1.08 handle and a possible H4 AB=CD (black arrows) bearish formation taken from the low 1.0525. However, there's still a good chance that this H4 supply zone area will be faked considering that the weekly resistance is sited just above at 1.0819. Therefore, we would need to see the fakeout before looking to short here as this could prove to be a monster trade!
Data points to consider: US housing data, Philly Fed manufacturing index report as well as the US jobless claims figure are all scheduled for release at 12.30pm GMT.
Levels to watch/live orders:
- Buys: Flat (stop loss: N/A).
- Sells: 1.0797-1.0780 ([wait for price to fake above this area to 1.0819 before considering shorts] stop loss: ideally beyond the fakeout candle).
GBP/USD
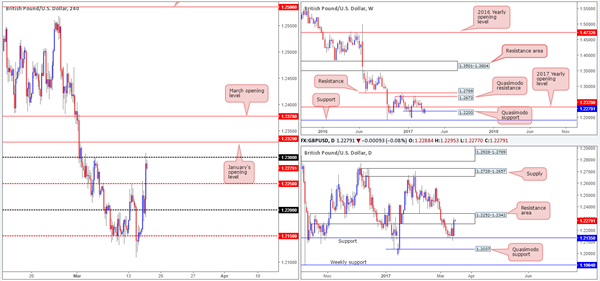
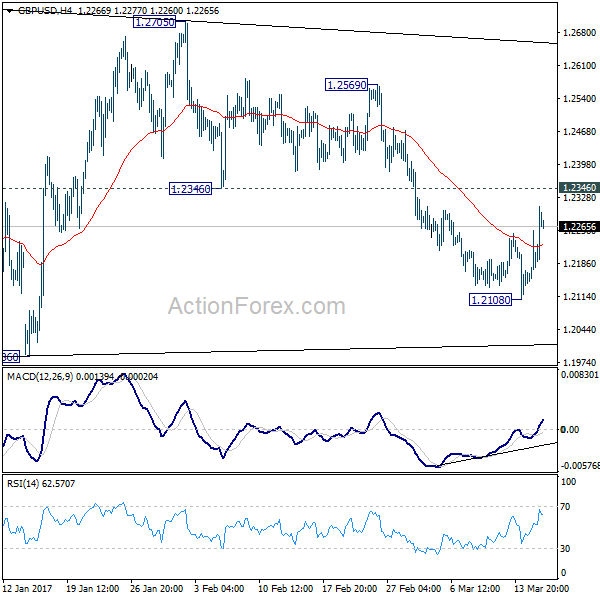
Across the board we saw the US dollar fall sharply yesterday following the FOMC's decision to raise interest rates by 25bps. This, as you can see, boosted the GBP's appeal. The pair ran through offers at 1.2250 and tested the 1.23 handle going into the closing bell. However, we believe that this rally will likely generate little follow-through today. This notion is supported by the following factors:
- Just beyond 1.23 is the 2017 yearly opening level at 1.2329.
- Encasing this yearly level is a daily resistance area pegged at 1.2252-1.2342.
- H4 trendline resistance taken from the low 1.2214.
- Overall, this market is entrenched within a clear downtrend at present.
Despite the above points, we would really like to see the H4 candles interact with the 2017 yearly opening base line before we look to consider selling this market.
Our suggestions: Keep an eye out for price to challenge 1.2329. Should this come to fruition, our desk would think about selling from here on the condition that a lower-timeframe sell signal forms (see the top of this report). Ideally, we would look for price to close below 1.23 as this would be enough to justify reducing risk to breakeven.
Data points to consider: Bank of England monetary policy announcements at 12pm. US housing data, Philly Fed manufacturing index report as well as the US jobless claims figure are all scheduled for release at 12.30pm GMT.
Levels to watch/live orders:
- Buys: Flat (stop loss: N/A).
- Sells: 1.2329 region ([waiting for a lower-timeframe confirming signal to form is advised] stop loss: dependent on where one confirms this level).
AUD/USD
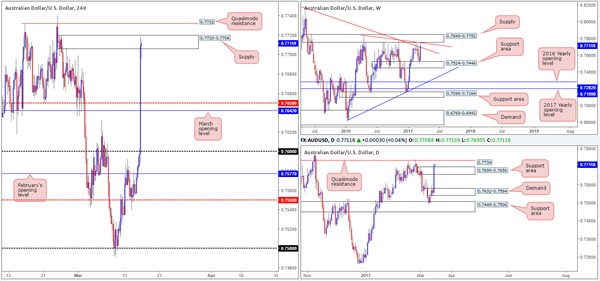
The commodity currency gravitated north against its US counterpart yesterday after the FOMC decided to raise interest rates by 25bps. From the weekly scale we can see that price is currently back shaking hands with the weekly trendline resistance stretched from the high 0.8163. In the event that the bulls continue to press forward here, the next upside objective can be seen at 0.7849-0.7752: a weekly supply that merges nicely with another weekly trendline resistance taken from the high 0.7835. Down on the daily chart, yesterday's candle smashed its way through the daily supply at 0.7699-0.7656, and is now seen retesting the top edge of this area as support. Assuming that the bulls remain in the driving seat here, our expectation is for price to connect with the nearby daily Quasimodo resistance at 0.7734.
Jumping across to the H4 candles, the pair is seen trading within the walls of a H4 supply at 0.7720-0.7706. Although the bears have made an attempt to push things lower from here, we feel this base is on the verge of giving way which could see the candles approach the H4 Quasimodo resistance at 0.7732.
Our suggestions: Quite simply, we are looking to short from the current H4 Quasimodo resistance level today. Not only does this base converge closely with the daily Quasimodo resistance line at 0.7734, it's also positioned around the weekly structures mentioned above. We would, dependent on the time of day, likely look to go in aggressive at 0.7732 and place stops above the apex high at 0.7740. However, do be aware that we have Australian employment figures due soon!
Data points to consider: Aussie employment figures at 12.30am. US housing data, Philly Fed manufacturing index report as well as the US jobless claims figure are all scheduled for release at 12.30pm GMT.
Levels to watch/live orders:
- Buys: Flat (stop loss: N/A).
- Sells: 0.7732 (Stop loss: 0.7742).
USD/JPY
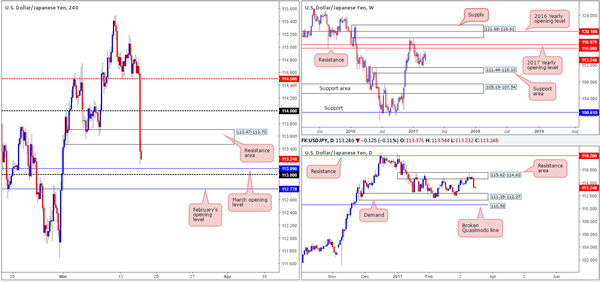
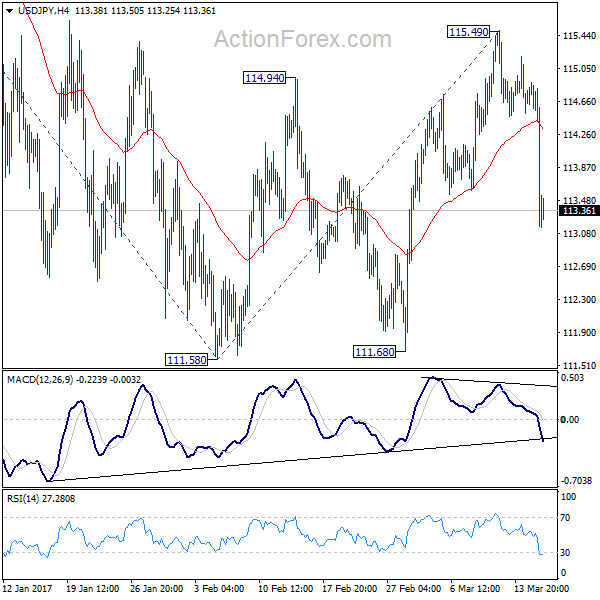
Yesterday's FOMC decision to hike rates by 25bps sent the US dollar screaming lower. The H4 mid-way support at 114.50, the 114 handle and the H4 demand base at 113.47-113.70 (now acting resistance) were collectively taken out during the bearish assault! With March's opening level at 113.09, followed closely by the 113 handle and February's opening level at 112.70 (112.70/113.09) now in view, where do we go from here?
Both the weekly and daily charts indicate room to extended lower this week, with the closest support structure not seen in view until 111.35-112.37: a daily demand zone which sits around the top edge of a weekly support area drawn from 111.44-110.10. As such, there is a possibility that the H4 112.70/113.09 zone may suffer a breach as price may want to tag the top edge of the current daily demand at 112.37. Does this mean we should ignore 112.70/113.09 altogether? Certainly not!
Our suggestions: Wait for price to cross paths with 112.70/113.09 and only look to go long only if a reasonably sized H4 bullish rotation candle presents itself from within the zone. This, of course, will by no means guarantee that price will advance, but what it will do is show buyer intent within a high-probability buy zone.
Data points to consider: US housing data, Philly Fed manufacturing index report as well as the US jobless claims figure are all scheduled for release at 12.30pm. Bank of Japan monetary policy announcements (tentative) GMT.
Levels to watch/live orders:
- Buys: 112.70/113.09 ([waiting for a reasonably sized H4 bull candle to form is advised before pulling the trigger] stop loss: ideally beyond the trigger candle).
- Sells: Flat (stop loss: N/A).
USD/CAD
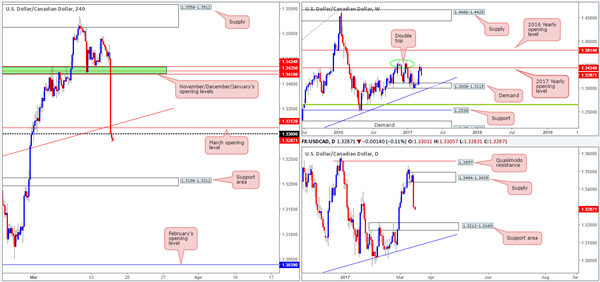
Recent events show that the FOMC's decision to hike rates by 25bps sent the US dollar aggressively lower against the Canadian dollar. As can be seen from the H4 chart, the pair concluded trade by closing beyond March's opening base line at 1.3312, the round number 1.33 and a H4 trendline support taken from the high 1.3171. To our way of seeing things, as long as the bears defend the recently broken H4 levels as resistance, there is little structure seen in this market until we reach the H4 support area coming in at 1.3196-1.3212 (fixed within a daily support area at 1.3212-1.3169).
Our suggestions: Based on the above points, our prime focus today will be on looking for shorting opportunities on any retest seen between 1.3312/1.33. Should the retest occur and a reasonably sized H4 bearish candle presents itself, we will be all over this, targeting the aforementioned H4 support area.
Data points to consider: US housing data, Philly Fed manufacturing index report as well as the US jobless claims figure are all scheduled for release at 12.30pm GMT.
Levels to watch/live orders:
- Buys: Flat (stop loss: N/A).
- Sells: 1.3312/1.33 ([waiting for a reasonably sized H4 bear candle to form is advised before pulling the trigger] stop loss: ideally beyond the trigger candle).
USD/CHF
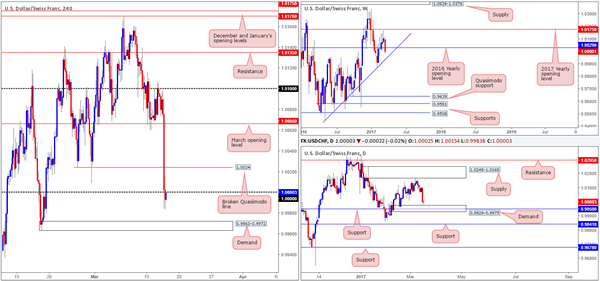
With the US dollar taking a hit yesterday on the back of FOMC actions, the H4 candles are now seen trading a tad beyond parity (1.0000) as we write. The next downside hurdle on this scale comes in around the H4 demand area drawn from 0.9963-0.9972. Also noteworthy is the daily chart. Price is currently hovering just ahead of a daily demand barrier chalked in at 0.9929-0.9975, which happens to intersect with not only a daily support level seen at 0.9950, but also a weekly trendline support etched from the low 0.9443.
Our suggestions: Owing to the confluence seen within the above noted daily demand area; we have a keen interest in the aforementioned H4 demand area today given that it's located within the walls of the said daily demand. However, seeing as how there's a fairly good chance that price could fake beyond this H4 zone into the depths of the daily demand, we would strongly recommend waiting for a reasonably sized H4 bullish candle to take shape before executing a trade.
Data points to consider: US housing data, Philly Fed manufacturing index report as well as the US jobless claims figure are all scheduled for release at 12.30pm.Swiss National Bank monetary policy announcements at 8.30am GMT.
Levels to watch/live orders:
- Buys: 0.9963-0.9972 ([waiting for a reasonably sized H4 bull candle to form is advised before pulling the trigger] stop loss: ideally beyond the trigger candle).
- Sells: Flat (stop loss: N/A).
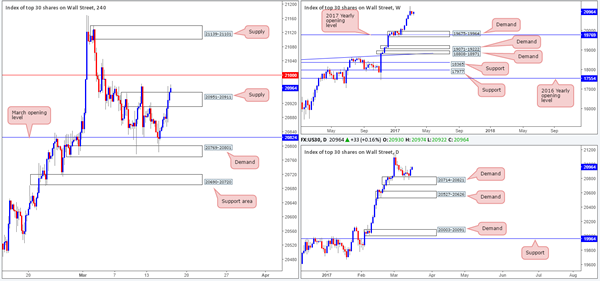
DOW 30
After the Fed raised its benchmark interest rate 25bps yesterday we saw the US equity market extend Tuesday's bounce from the H4 demand area at 20769-20801, and eventually spike above H4 supply coming in at 20951-20911. Although both the weekly and daily charts show little resistance on the horizon, we cannot afford to buy this market just yet. Once, or indeed if, the 21000 H4 resistance is conquered, we will then have a relatively free run up until the H4 supply zone picked at 21139-21101.
Our suggestions: Quite simply, watch for a H4 close to print beyond the 21000 mark today. In the event that this comes into view, and price retests 21000 as support and prints a reasonably sized H4 bull candle, we would consider entering long from here, targeting the aforementioned H4 supply and possibly beyond.
Data points to consider: US housing data, Philly Fed manufacturing index report as well as the US jobless claims figure are all scheduled for release at 12.30pm GMT.
Levels to watch/live orders:
- Buys: Watch for price to engulf 21000 and then look to trade any retest seen thereafter ([waiting for a reasonably sized H4 bull candle to form following the retest is advised before pulling the trigger] stop loss: ideally beyond the trigger candle).
- Sells: Flat (stop loss: N/A).
GOLD
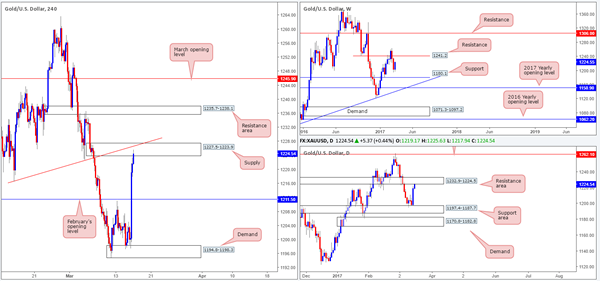
Shortly after the FOMC announced its decision to raise interest rates by 25bps, the dollar fell and by extension dragged the price of gold higher. This, as you can see, has brought the yellow metal up to within the jaws of a rather interesting H4 supply zone penciled in at 1227.5-1223.9. Not only is there a converging H4 trendline resistance etched from the low 1216.5, there's also a daily resistance area bolstering this base at 1232.9-1224.5. Despite weekly action not showing any resistance until we reach the 1241.2 neighborhood, there's a relatively sound chance that price will decline in value from the current H4 supply area sometime today.
Our suggestions: While there is a possibility that the H4 candles may ignore this H4 zone today and head for the above noted weekly resistance barrier, we feel a sell trade from the said H4 supply can still be considered valid if a reasonably sized H4 bearish candle forms.
Levels to watch/live orders:
- Buys: Flat (stop loss: N/A).
- Sells: 1227.5-1223.9 ([waiting for a reasonably sized H4 bear candle to form is advised before pulling the trigger] stop loss: ideally beyond the trigger candle).
USD/JPY Daily Outlook
Daily Pivots: (S1) 112.72; (P) 113.80; (R1) 114.44; More...
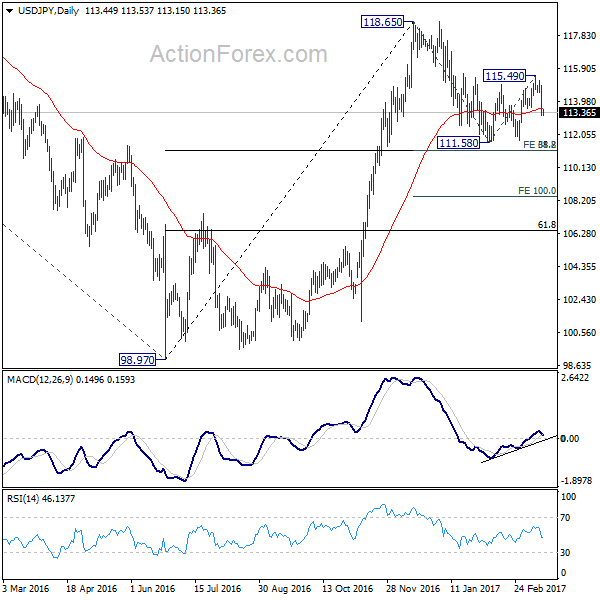
USD/JPY's sharp decline and break of 113.60 support invalidated our view of reversal. Instead, the development suggests that consolidation pattern from 111.58 has completed with three waves to 115.49. Intraday bias is now turned back to the downside for 111.58 first. Break of 111.58 will extend the correction from 118.65 and would target 61.8% projection of 118.65 to 111.58 from 115.49 at 111.12. That coincides with 38.2% retracement of 98.97 to 118.65 at 111.13. We'd tentatively expect strong support from there to bring rebound. But firm break there will target 100% projection at 108.42. On the upside, outlook will stays bearish as long as 115.49 holds, in case of recovery.
In the bigger picture, price actions from 125.85 high are seen as a corrective pattern. The impulsive structure of the rise from 98.97 suggests that the correction is completed and larger up trend is resuming. Decisive break of 125.85 will confirm and target 61.8% projection of 75.56 to 125.85 from 98.97 at 130.04 and then 135.20 long term resistance. Rejection from 125.85 and below will extend the consolidation with another falling leg before up trend resumption.
European Open Briefing
Global Markets:
- Asian stock markets: Nikkei up 0.20 %, Shanghai Composite gained 0.65 %, Hang Seng rose 1.25 %, ASX 200 declined 0.10 %
- Commodities: Gold at $1125 (+2.00 %), Silver at $17.46 (+3.15 %), WTI Oil at $49.15 (+0.60 %), Brent Oil at $52.15 (+0.65 %)
- Rates: US 10 year yield at 2.50, UK 10 year yield at 1.21, German 10 year yield at 0.41
News & Data:
- New Zealand GDP (QoQ) (Q4) 0.40% (est 0.60%, prev 0.80%)
- New Zealand GDP (YoY) (Q4) 2.70% (est 3.10%, prev 3.30%)
- Australia Employment Change (Feb): -6.4k (est 16.0K, prev 13.7K)
- Australia Unemployment Rate (Feb): 5.90% (est 5.70%, prev 5.70%)
- Australia Full-Time Employment Change (Feb): +27.1k (prev -44.5K)
- Australia Part-Time Employment Change (Feb): -33.5k (prev 58.2K)
- Australia Participation Rate (Feb): 64.60% (est 64.60%, prev 64.60%)
- Australia MI Inflation Expectations (Mar): 4.0% (prev 4.10%)
- PBOC sets USD/CNY mid-point today at 6.8862 (vs. yesterday at 6.9115)
Bank of Japan Rate Decision:
- BOJ keeps monetary policy steady
- Maintains short-term interest rate target at -0.1 %
- Maintains 10-year JGB yield target around 0 %
- Decision on yield curve control made by 7-2 vote
Markets Update:
The US Dollar weakened overnight following the Fed rate decision. The central bank hiked rates by 25 bps, as expected, but remained cautious overall and did not signal clearly when the next hike could come.
The USD weakened most against the Japanese Yen. USD/JPY declined to a low of 113.15 in Asia, down more than 200 pips from this week’s high. The outlook has turned bearish now, and a test of 122 seems likely in the near-term.
The Euro rallied above 1.07 and the positive sentiment is likely to persist today. The outcome of the Dutch election is positive both for the Euro and the European stock markets.
The Australian and New Zealand Dollar gained after the Fed announcement as well, but lost some momentum in Asia. Australia’s employment data disappointed the market, which led to a pullback to 0.7675 in the AUD/USD. Prior to that, New Zealand’s GDP figures missed expectations as well, putting the NZD slightly under pressure.
Upcoming Events:
- 08:30 GMT – SNB Rate Decision
- 08:30 GMT – SNB Statement
- 10:00 GMT – Euro Zone CPI
- 12:00 GMT – Bank of England Rate Decision
- 12:30 GMT – US Building Permits
- 12:30 GMT – US Housing Starts
- 12:30 GMT – US Philadelphia Fed Manufacturing Index
- 12:30 GMT – US Initial Jobless Claims
USD/CHF Daily Outlook
Daily Pivots: (S1) 0.9955; (P) 1.0030; (R1) 1.0077; More.....
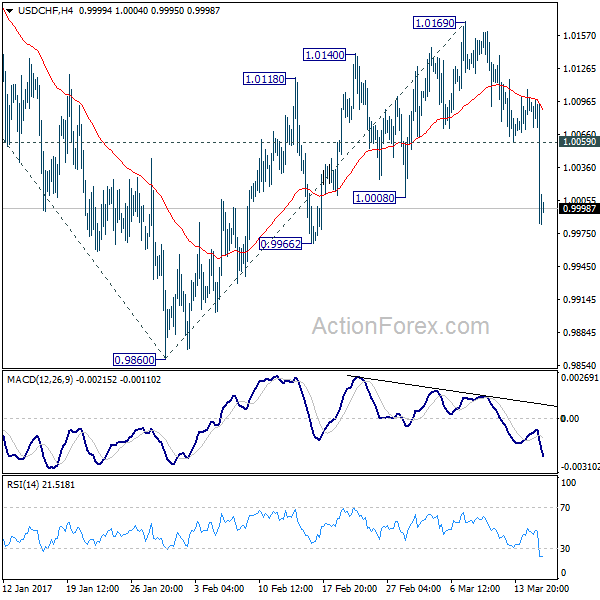
USD/CHF's sharp decline and break of 1.0008 support indicates that corrective rise from 0.9860 has completed at 1.0169 already. In other words, the whole decline from 1.0342 could be resuming. Intraday bias is turned back to the downside for 0.9860 support first. Break will confirm this view and target 100% projection of 1.0342 to 0.9860 from 1.0169 at 0.9687. On the upside, 1.0059 minor resistance will turn bias neutral. But outlook will now stay bearish as long as 1.0169 resistance holds.
In the bigger picture, prior rejection from 1.0327 resistance argues that USD/CHF is staying in a medium term sideway pattern. In any case, decisive break of 1.0342 resistance is needed to confirm underlying strength. Otherwise, we'll stay neutral in the pair first. In case of another fall, we'd expect strong support from 0.9443/9548 support zone.

GBP/USD Daily Outlook
Daily Pivots: (S1) 1.2183; (P) 1.2246; (R1) 1.2350; More...
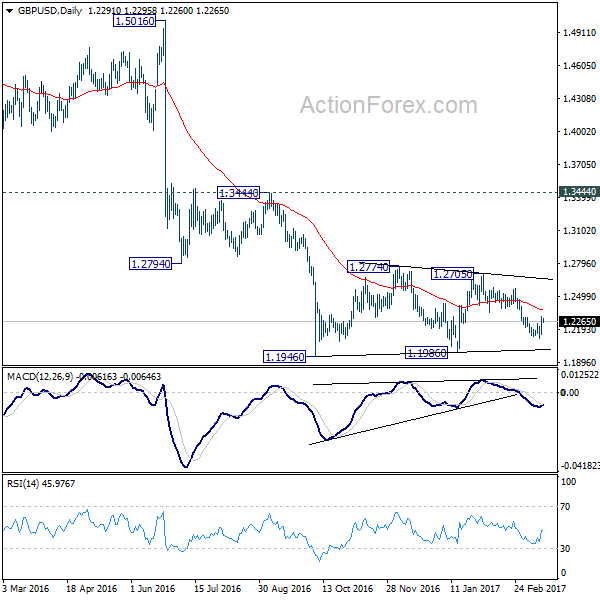
GBP/USD's recovery from 1.2108 continues today but stays below 1.2346 support turned resistance. Intraday bias stays neutral for the moment. Near term outlook remains bearish as long as 1.2346 support turned resistance holds. As noted before, consolidation pattern from 1.1946 is completed at 1.2705 is resuming larger down trend. Below 1.2108 will target a test on 1.1946/86 support zone. Break of 1.1946 will confirm our bearish view. However, sustained break of 1.2346 will turn bias to the upside for 1.2705 resistance to extend the consolidation from 1.1946.
In the bigger picture, fall from 1.7190 is seen as part of the down trend from 2.1161. There is no sign of medium term bottoming yet. Sustained trading below 61.8% projection of 2.1161 to 1.3503 from 1.7190 at 1.2457 will target 100% projection at 0.9532. Overall, break of 1.3444 resistance is needed to confirm medium term bottoming. Otherwise, outlook will remain bearish.
EUR/USD Daily Outlook
Daily Pivots: (S1) 1.0642; (P) 1.0691 (R1) 1.0780; More.....
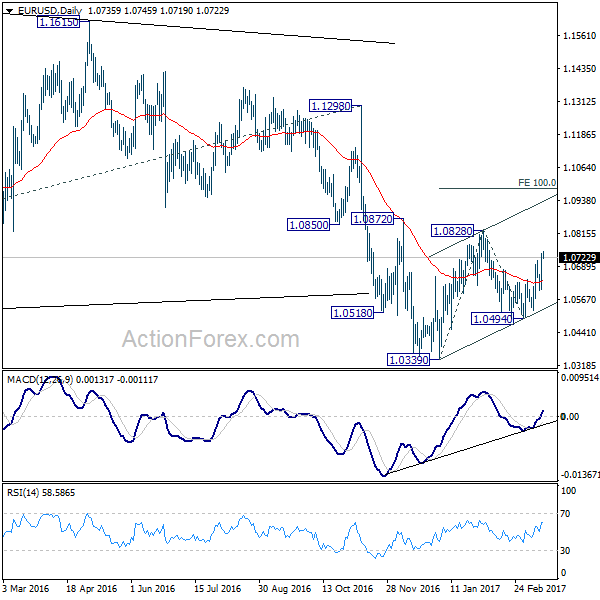
EUR/USD was supported by 4 hour 55 EMA and rebounded strongly. The break of 1.0713 indicates that whole rise from 1.0494 has resumed. It also revived the case that rise from 1.0494 is the third leg of the pattern from 1.0339. Intraday bias is turned back to the upside for 1.0828 resistance and above.
Still, rise from 1.0339 is seen as a corrective move. Hence, we'd upside to be limited by 100% projection of 1.0339 to 1.0828 from 1.0494 at 1.0983 to bring larger down trend resumption. On the downside, break of 1.0599 will turn bias back to the downside for 1.0494 support.
In the bigger picture, as long as 1.1298 key resistance holds, whole down trend from 1.6039 (2008 high) is still expected to continue. Break of 1.0339 low will send EUR/USD through parity to 61.8% projection of 1.3993 to 1.0461 from 1.1298 at 0.9115.
Dollar Stays Pressured after FOMC Disappointment, BoJ on Hold, SNB and BoE Next
The responses to FOMC's announcement overnight were very clear. Stocks rebounded with DJIA gained 112.273 pts or 0.54% to close at 20950.10. S&P 500 rose 19.81 pts or 0.84% to close at 2385.26. NASDAQ jumped to as high as 5911.20, just missed record high at 5911.79 before closing at 5900.05, up 43.23 pts or 0.74%. Long term treasury yields, on the other hand, tumbled sharply. 10 year yield was rejected from 2.621 resistance and closed at 2.508, down -0.087 for the day. 30 year yield lost -0.066 to close at 3.106. Dollar index dips to as low as 100.43 and broke 100.66 near term support level, suggesting more downside ahead.
Fed hiked but kept outlook unchanged
FOMC raised the fed funds target range, by 25 bps, to 0.75%-1.00% with 9-1 vote. Minneapolis Fed President Neel Kashkari dissented as he favored leaving the monetary policy unchanged. The disappointments came from the fact that the Summary of Projections (SEP) shows virtually the same macroeconomic outlook. The median projection of federal fund rates was held at 1.4% by the end of 2017, same as December projection. Median projection for rate by the end of 2.18 was held at 2.1%, also same as December projection. Median projection for rate by the end of 2019 was revised by a mere 0.1% to 3.0%. Fed fund futures are pricing pricing in 49.6% chance of another hike in June, down from prior day's 53.2%.
More on FOMC:
- FOMC Delivered, Market Disappointed
- FOMC: Anticipated Rate Increase in Domestic/Global Context
- FOMC: Replay Of The December Meeting Stings The Dollar
- FOMC Recap – Rates Rise But Gradual Path Remains
BoJ on hold as widely expected
BoJ left monetary policies unchanged today as widely expected. Policy makers voted 7-2 to keep the Yield Curve Control unchanged. Short term policy rate is held at -0.1%. And BoJ will continue asset purchase at JPY 80T per annum. T. Sato and . T. Kiuchi voted against the decision. Regarding the economy, BoJ noted that it has "continued its moderate recovery trend", "exports have picked up". BoJ is optimistic that "Japan's economy is likely to turn to a moderate expansion." Risks to outlook include development in US and Fed's rate hikes, emerging economies, the consequences of Brexit.
SNB and BoE to hold
SNB is widely expected to keep the site deposit rate unchanged at -0.75% today. Meanwhile, the Libor target range would be held at -1.25% to -0.25%. The Swiss franc has been rather sensitive to political uncertainties in Europe as it gyrated higher against Euro since last September. But EUR/CHF is so far holding above 1.06 for the moment and the rebound since February should give SNB policy makers some relief. It's believed that SNB won't act unless they see the risk of persistent appreciation in Franc's exchange rate.
BoE is also widely expected to keep monetary policies unchanged. That is, the benchmark interest rate to be held at 0.25%. The asset purchase target will also be kept at GBP 435b. The decisions should also be made with unanimous 9-0 vote. The depreciation in Sterling's exchange rate in the past year has given BoE much room for not loosening monetary policies further. It's generally expected inflation would continue to climb this year and could overshoot BoE's target briefly. And policymakers expressed their tolerance on that already. There has been some speculation of a BoE hike in early 2018. But that is very much subject to the development for the rest of the year, as Prime Minister Theresa will trigger Brexit negotiation this month.
Aussie and Kiwi pare gains on weak data
Both Aussie and Kiwi pare some gains against Dollar after weak economic data. The Australian economy lost -6.4k jobs in February, much worse than expectation of 16.3k growth. Unemployment rate jumped 0.2% to 5.9%, above expectation of 5.7%. That's also the highest rate in more than a year. Contraction in job markets was led by -33.5k loss in part-time jobs. The 27.1k rise in full-time jobs couldn't make up the number. Some economists noted that there is basically no inflationary pressure from the labor market and wage growth. Meanwhile, further surge in unemployment rate could pressure the RBA for a rate cut despite facing bubbling in the housing markets. Also from Australia, consumer inflation expectation dropped to 4.0% in March.
New Zealand GDP rose only 0.4% qoq in Q4, slowed from prior quarter's downwardly revised 0.8 qoq. It also missed expectation of 0.7% qoq. The earthquake near Kaikoura back in November is seen as a factor skewing the data. But StatsNZ didn't directly mention any disruption to activity due to that earthquake. Meanwhile, weakness in manufacturing, which contracted by -1.6%, has trimmed -0.2% from GDP growth. For 2016 growth averaged 3.1%, which was an improvement over 2.5% in 2016. That's also the second straight year of above 3% growth.
PBoC raised short term repo and MLF rates
In China, the PBoC raised the key seven-day repo rate by 0.1% to 2.45%. The 14-day repo rate was also raised by 0.1% to 2.60%. Same amount was raised in 28-day repo rate to 2.75%. Meanwhile, For medium-term lending facility loans, the 6-month rate was raised by 0.1% to 3.05%. One-year MLF rate was raised by 0.1% to 3.2%. PBoC said that the hikes doesn't not constitute a benchmark rate increase. Instead, it's just a move to add flexibility for deleverage "deflating bubbles" and risk preventions.
Elsewhere on data...
Eurozone will release CPI final in European session. Canada will release international securities transaction in US session. US will release new residential construction, jobless claims and Philly Fed survey.
EUR/USD Daily Outlook
Daily Pivots: (S1) 1.0642; (P) 1.0691 (R1) 1.0780; More.....
EUR/USD was supported by 4 hour 55 EMA and rebounded strongly. The break of 1.0713 indicates that whole rise from 1.0494 has resumed. It also revived the case that rise from 1.0494 is the third leg of the pattern from 1.0339. Intraday bias is turned back to the upside for 1.0828 resistance and above.
Still, rise from 1.0339 is seen as a corrective move. Hence, we'd upside to be limited by 100% projection of 1.0339 to 1.0828 from 1.0494 at 1.0983 to bring larger down trend resumption. On the downside, break of 1.0599 will turn bias back to the downside for 1.0494 support.
In the bigger picture, as long as 1.1298 key resistance holds, whole down trend from 1.6039 (2008 high) is still expected to continue. Break of 1.0339 low will send EUR/USD through parity to 61.8% projection of 1.3993 to 1.0461 from 1.1298 at 0.9115.
Economic Indicators Update
| GMT | Ccy | Events | Actual | Forecast | Previous | Revised |
|---|---|---|---|---|---|---|
| 21:45 | NZD | GDP Q/Q Q4 | 0.40% | 0.70% | 1.10% | 0.80% |
| 0:00 | AUD | Consumer Inflation Expectation Mar | 4.00% | 4.10% | ||
| 0:30 | AUD | Employment Change Feb | -6.4K | 16.3K | 13.5k | |
| 0:30 | AUD | Unemployment Rate Feb | 5.90% | 5.70% | 5.70% | |
| 2:54 | JPY | BoJ Monetary Policy Statement | -0.10% | -0.10% | -0.10% | |
| 8:30 | CHF | SNB Sight Deposit Interest Rate | -0.75% | -0.75% | ||
| 8:30 | CHF | SNB 3-Month Libor Lower Target Range | -1.25% | -1.25% | ||
| 8:30 | CHF | SNB 3-Month Libor Upper Target Range | -0.25% | -0.25% | ||
| 10:00 | EUR | Eurozone CPI M/M Feb | 0.40% | 0.40% | ||
| 10:00 | EUR | Eurozone CPI Y/Y Feb F | 1.80% | 1.80% | ||
| 10:00 | EUR | Eurozone CPI - Core Y/Y Feb F | 0.90% | 0.90% | ||
| 12:00 | GBP | BoE Rate Decision | 0.25 | 0.25% | ||
| 12:00 | GBP | BoE Asset Purchase Target Mar | 435B | 435B | ||
| 12:00 | GBP | MPC Official Bank Rate Votes | 0--0--9 | 0--0--9 | ||
| 12:00 | GBP | MPC Asset Purchase Facility Votes | 0--0--9 | 0--0--9 | ||
| 12:30 | CAD | International Securities Transactions (CAD) Jan | 9.45B | 10.23B | ||
| 12:30 | USD | Housing Starts Feb | 1.26M | 1.25M | ||
| 12:30 | USD | Building Permits Feb | 1.26M | 1.29M | ||
| 12:30 | USD | Initial Jobless Claims | 245K | 243K | ||
| 12:30 | USD | Philly Fed Survey Mar | 25 | 43.3 | ||
| 14:30 | USD | Natural Gas Storage | -68B |
(BOJ) Statement on Monetary Policy – March 16, 2017
1. At the Monetary Policy Meeting held today, the Policy Board of the Bank of Japan decided upon the following.
(1) Yield curve control
The Bank decided, by a 7-2 majority vote, to set the following guideline for market operations for the intermeeting period. [Note 1]
The short-term policy interest rate:
The Bank will apply a negative interest rate of minus 0.1 percent to the Policy-Rate Balances in current accounts held by financial institutions at the Bank.
The long-term interest rate:
The Bank will purchase Japanese government bonds (JGBs) so that 10-year JGB yields will remain at around zero percent. With regard to the amount of JGBs to be purchased, the Bank will conduct purchases at more or less the current pace -- an annual pace of increase in the amount outstanding of its JGB holdings of about 80 trillion yen -- aiming to achieve the target level of the long-term interest rate specified by the guideline.
(2) Guidelines for asset purchases
With regard to asset purchases other than JGB purchases, the Bank decided, by a 7-2 majority vote, to set the following guidelines. [Note 2]
a) The Bank will purchase exchange-traded funds (ETFs) and Japan real estate investment trusts (J-REITs) so that their amounts outstanding will increase at annual paces of about 6 trillion yen and about 90 billion yen, respectively.
b) As for CP and corporate bonds, the Bank will maintain their amounts outstanding at about 2.2 trillion yen and about 3.2 trillion yen, respectively.
2. Japan's economy has continued its moderate recovery trend. Overseas economies have continued to grow at a moderate pace, although emerging economies remain sluggish in part. In this situation, exports have picked up. On the domestic demand side, business fixed investment has been on a moderate increasing trend as corporate profits have improved. Private consumption has been resilient against the background of steady improvement in the employment and income situation. Meanwhile, housing investment and public investment have been more or less flat. Reflecting these moderate increases in demand both at home and abroad and the progress in inventory adjustments, industrial production has picked up. Financial conditions are highly accommodative. On the price front, the year-on-year rate of change in the consumer price index (CPI, all items less fresh food) has been about 0 percent. Inflation expectations have remained in a weakening phase.
3. With regard to the outlook, Japan's economy is likely to turn to a moderate expansion. Domestic demand is likely to follow an uptrend, with a virtuous cycle from income to spending being maintained in both the corporate and household sectors, on the back of highly accommodative financial conditions and fiscal spending through the government's large-scale stimulus measures. Exports are expected to follow a moderate increasing trend on the back of an improvement in overseas economies. The year-on-year rate of change in the CPI is likely to increase from about 0 percent and become slightly positive, reflecting developments in energy prices. Thereafter, it is expected to increase toward 2 percent as the output gap improves and medium- to long-term inflation expectations rise. [Note 3]
4. Risks to the outlook include the following: developments in the U.S. economy and the impact of its monetary policy on global financial markets; developments in emerging and commodity-exporting economies, particularly China; the consequences stemming from the United Kingdom's vote to leave the European Union (EU) and their effects; prospects regarding the European debt problem, including the financial sector; and geopolitical risks.
5. The Bank will continue with "Quantitative and Qualitative Monetary Easing (QQE) with Yield Curve Control," aiming to achieve the price stability target of 2 percent, as long as it is necessary for maintaining that target in a stable manner. It will continue expanding the monetary base until the year-on-year rate of increase in the observed CPI (all items less fresh food) exceeds 2 percent and stays above the target in a stable manner. The Bank will make policy adjustments as appropriate, taking account of developments in economic activity and prices as well as financial conditions, with a view to maintaining the momentum toward achieving the price stability target. [Note 4]
[Note 1] Voting for the action: Mr. H. Kuroda, Mr. K. Iwata, Mr. H. Nakaso, Mr. Y. Harada, Mr. Y. Funo, Mr. M. Sakurai, and Ms. T. Masai. Voting against the action: Mr. T. Sato and Mr. T. Kiuchi. Mr. T. Sato dissented considering that setting the short-term policy interest rate at minus 0.1 percent and the target level of 10-year JGB yields at around 0 percent could lead to holding JGB yields in negative territory up to a maturity of 10 years and thus could have an adverse impact on the functioning of financial intermediation. Mr. T. Kiuchi dissented considering that, with a view to maintaining the stability of the JGB market and the functioning of financial intermediation, (1) the short-term policy interest rate should be set at 0.1 percent and (2) the adoption of a target level for a long-term interest rate was not appropriate because it would entail a risk that the Bank might need to further increase the pace of its JGB purchases.
[Note 2] Voting for the action: Mr. H. Kuroda, Mr. K. Iwata, Mr. H. Nakaso, Mr. Y. Harada, Mr. Y. Funo, Mr. M. Sakurai, and Ms. T. Masai. Voting against the action: Mr. T. Sato and Mr. T. Kiuchi. Mr. T. Sato dissented considering that ETF purchases of about 6 trillion yen annually would be excessive in light of their adverse impact on the pricing mechanism in the stock market and the Bank's financial soundness. Mr. T. Kiuchi proposed that the Bank continue to use amounts of asset purchases as its operating targets and set the guidelines for asset purchases as follows: the Bank would purchase JGBs so that their amount outstanding would increase at an annual pace of about 45 trillion yen, purchase ETFs so that their amount outstanding would increase at an annual pace of about 1 trillion yen, and so on. The proposal was defeated by a majority vote.
[Note 3] Mr. T. Kiuchi proposed, concerning the year-on-year rate of change in the CPI, that it was likely to increase from about 0 percent and become slightly positive, and would thereafter increase very moderately. The proposal was defeated by an 8-1 majority vote. Voting for the proposal: Mr. T. Kiuchi. Voting against the proposal: Mr. H. Kuroda, Mr. K. Iwata, Mr. H. Nakaso, Mr. T. Sato, Mr. Y. Harada, Mr. Y. Funo, Mr. M. Sakurai, and Ms. T. Masai.
[Note 4] Mr. T. Sato opposed the commitment to expanding the monetary base, considering that this was neither realistic nor effective. Mr. T. Kiuchi proposed that the Bank, with the aim to achieve the price stability target of 2 percent in the medium to long term, continue with asset purchases and a virtually zero short-term interest rate policy as long as each of these policy measures was deemed appropriate. The proposal was defeated by an 8-1 majority vote. Voting for the proposal: Mr. T. Kiuchi. Voting against the proposal: Mr. H. Kuroda, Mr. K. Iwata, Mr. H. Nakaso, Mr. T. Sato, Mr. Y. Harada, Mr. Y. Funo, Mr. M. Sakurai, and Ms. T. Masai.
FOMC Delivered, Market Disappointed
FOMC raised the fed funds target range, by +25 bps, to 0.75%-1.00% with 9-1 vote. Minneapolis Fed President Neel Kashkari dissented as he favored leaving the monetary policy unchanged. The Summary of Projections (SEP) shows virtually the same macroeconomic outlook. Moreover, the median dot plot maintained three rate hikes this year and in 2018. Chair Janet Yellen noted that that the projections have not included potential fiscal stimulus promised by President Donald Trump. She also noted that the Committee discussed on balance sheet policy but no conclusion was reached. The market was disappointed, reflected in the decline in US dollar and Treasury yields, as they had anticipated more hawkish statement and some upward adjustments in economic forecasts.
In light of the rate hike, the Fed upgraded modestly its economic assessment in the accompanying statement. The members acknowledged that business fixed investment “appears to have firmed somewhat” while “inflation has increased in recent quarters, moving close to the committee’s 2% longer-run objective”. The description of the on household spending and labor markets was largely unchanged, noting that “household spending has continued to rise moderately” and “job gains remained solid and the unemployment rate was little changed in recent months”. The Fed also indicated that it would “carefully monitor actual and expected inflation developments relative to its symmetric inflation goal”. Headline CPI accelerated to +2.7% y/y in February, from +2.5% a month ago. This came in stronger than consensus of +2.6%. Core CPI eased to +2.2% from +2.3% in January. The current situation is that headline inflation might stay above +2% for some time while core inflation is expected to remain subdued. While the Fed had not mentioned “symmetric” previously, addition of such reference signals that the Fed will place more weight on trends in core inflation on future monetary decisions.
The median dot plots stayed essentially unchanged, projecting three rate hikes in both 2017 and 2018. This might be disappointing to those who expected four rate hikes next year. FOMC’s median estimate in dot plot stayed at 1.375% in 2017, 2.125% in 2018 and 2.875% in 2019, which is the assumed long-term rate. The economic projections were largely unchanged. There was only +0.1 percentage point increase in the median forecast for GDP growth in 2018, -0.1 percentage point decline in the assumed long-term unemployment rate (now 4.7%) and +0.1 percentage point lift in expected core inflation for this year.
In the concluding paragraph, the Fed reiterated that “it is maintaining its existing policy of reinvesting principal payments from its holdings of agency debt and agency mortgage-backed securities in agency mortgage-backed securities and of rolling over maturing Treasury securities at auction, and it anticipates doing so until normalization of the level of the federal funds rate is well under way. This policy, by keeping the Committee's holdings of longer-term securities at sizable levels, should help maintain accommodative financial conditions”. We notice that the consensus for three rate hikes this year is stronger than in December with now two more members expecting three rate hikes, five expecting more than three hikes and three expecting less than three hikes.
Median Dot Plots Continued to Project 3 Rate Hikes in 2017 and 2018
Foreign Exchange Market Commentary
EUR/USD
The EUR/USD pair traded around the 1.0630 for most of the last 24 hours, as investors were waiting for the US Central Bank monetary policy decision. Mrs. Yellen and Co. delivered the 25bps raise as expected, moving its benchmark interest rate to 0.75%-1.0%. There was only one dissenter, Minneapolis Fed President Neel Kashkari. The dollar was sold-off as an immediate reaction to the announcement, with the EUR/USD pair advancing up to 1.0710 with the news, settling a few pips below it ahead of Yellen's speech. She offered a positive outlook to the economy, as she said that the "economy continues to expand at a moderate pace." Weighing on the greenback were comments suggesting that the funds rate doesn’t need to rise "all that much" to get to where the Fed considers neutral. Despite the dot plot still favors three rate hikes this year, the market is convinced the Central Bank will deliver just two this year. Overall, a dovish stance.
Data coming from the US earlier in the day was mixed as February inflation showed the biggest annual increase in almost 5 years. The consumer price index advanced by 0.1% when compared to January, and up 2.7% from a year before. Retail Sales, however, were slightly disappointing, as purchases rose by just 0.1% as expected, the lowest gain in six months.
The pair rallied further after the release of the Dutch elections' result, showing that the ruling party is taking over 30 seats, while Geert Wilders' party won "just" 19, bringing relief to those concerned over populism in Europe, according to exit polls.
As for the technical point of view, the EUR/USD pair is trading at the higher in over a month, breaking through the 1.0700/20 region, and sharply bullish after the news. From a technical point of view, the risk is clearly towards the upside, given that in the 4 hours chart, the price has recovered above all of its moving averages, whilst technical indicators head sharply lower after surpassing their mid-lines, maintaining strong upward slopes and with the RSI indicator approaching overbought territory. If the price manages to hold above 1.0720, there's room for an extension up to 1.0820, the 50% retracement of the post-US election slide.
Support levels: 1.0720 1.0660 1.0635
Resistance levels: 1.0755 1.0790 1.0820
USD/JPY
The USD/JPY pair held above the 114.50 threshold until the US Federal Reserve unveiled its monetary policy decision, which resulted in a dollar's sell-off and sent the pair as low as 113.31, a fresh 2-week low. Yellen's soft wording towards the future, with the dot plot showing no relevant changes in the amount of upcoming rate hikes, neither in inflation or growth, disappointed those waiting for a more hawkish stance. US yields plunged with the news, with the 10-year benchmark down to 2.51% from previous 2.59%. During the upcoming Asian session, the Bank of Japan will have its monetary policy meeting, although no big changes are expected. The Central Bank is expected to maintain the status quo, focusing on the yield-curve control, whilst Governor Kuroda is expected to maintain its optimist outlook, despite inflation is nowhere near the Central Bank's target. The pair is set to fall further as it broke below a bullish 100 DMA, currently around 114.30, while a major Fibonacci resistance stands at 114.50, making of the region now a selling point. In the 4 hours chart, technical indicators have turned sharply lower after failing to overcome their mid-lines and now entering oversold territory, whilst the price is now around a horizontal 200 SMA after surpassing the 100 SMA, all of which supports additional declines during the upcoming hours.
Support levels: 113.30 112.90 112.50
Resistance levels: 114.00 114.50 114.95
GBP/USD
It was a wild ride the one the GBP/USD pair had today, recovering from a daily low of 1.2178, and challenging 1.2300 at the end of the day following the Fed's announcement. The UK released mixed employment figures this Wednesday, as the unemployment rate fell to 4.7% in the three months to January, level last seen in 2005. Additionally, there were 31.85 million people in work, 92,000 more than for August to October 2016 and 315,000 more than for a year earlier. Still, wages were a big miss, as Average Earnings, including bonus, slowed to 2.2% from previous 2.6% leaving real pay growth, adjusted for inflation, was just 0.7%. The Bank of England is having its monetary policy meeting this Thursday, largely expected to remain on hold, albeit weaker wages together with rising inflation, are a worrisome mixture that policymakers can't ignore for long. From a technical point of view, the 4 hours chart shows that the price bounced multiple times intraday from a bullish 20 SMA, whilst technical indicators regained the upside after testing their mid-lines, heading now north at fresh 1-week highs. The pair has a critical resistance at 1.2345, the 50% retracement of January's rally and February's low. If the price manages to break above it, the rally can extend up to 1.2425, the next Fibonacci resistance. Still, Brexit jitters weigh, and may trigger a sudden reversal on an approach to any of the mentioned resistances.
Support levels: 1.2260 1.2230 1.2190
Resistance levels: 1.2345 1.2385 1.2425
GOLD
Gold prices jumped to their highest since March 7th on dollar's broad weakness, ending the day near $1,220.00 a troy ounce. Investors were disappointed by the dot plot that offered no fastest pace in the rate rise path. Projections continue to indicate two rate hikes more for this year, while inflation and growth forecast were barely revised from December's ones. The daily chart shows that the commodity has recovered well above a major Fibonacci level around 1,210.00, the 38.2% retracement of the latest bullish run. The chart also shows that the price held above its 100 DMA, but also that the 20 SMA continues heading south above the current level, whilst technical indicators have bounced modestly, but remain well below their mid-lines, indicating a limited upward scope in the longer term. In the 4 hours chart, the sharp movement higher has helped the pair recover above a still flat 20 SMA, while pushed technical indicators higher, now heading north almost vertically. The commodity needs now to advance beyond 1,222.80 to be able to extend its rally up to 1,230.30, the 23.6% retracement of the mentioned rally.
Support levels: 1,197.10 1,188.20 1,180.50
Resistance levels: 1,210.00 1,218.50 1,226.70
WTI CRUDE
Oil prices found modest support in the EIA weekly report, showing a surprise drawdown in oil stockpiles. According to the US Energy Information Administration, inventories fell by 237,000 barrels in the week through March 10, following nine weeks of steady advances. The report also showed that total stockpiles stood at 528.2 million as US crude imports fell by 565,000 barrels and refinery activity declined. Crude stocks at the Cushing, Oklahoma delivery hub rose by 2.13 million barrels. Gasoline and distillate stockpiles also fell by more than expected, dropping 3.1 million barrels the first and 4.2 million barrels the second. West Texas Intermediate crude oil futures settled at $48.50 a barrel, a fresh weekly high, but the upward still seems limited, given that the recovery was quite shallow, despite dollar's weakness. Daily basis, the price was unable to surpass its 200 DMA, whilst technical indicators remain within oversold territory, with limited directional strength, maintaining the risk towards the downside. In the 4 hours chart, the price has settled a few points above a still bearish 20 SMA, whilst technical indicators are posting modest advances within neutral territory, hardly enough to anticipate further gains.
Support levels: 48.00 47.30 46.65
Resistance levels: 49.10 49.75 50.50
DJIA
Wall Street got a nice boost from the Fed, with all three major indexes closing in the green. The Dow Jones Industrial Average is back on its way to surpass 21,000, as the benchmark closed the day at 20,950.10, up 112 points or 0.54%. The Nasdaq Composite added 43 points, and settled at 5,900.05, an all-time high, while the S&P added 19 points or 0.84% to end at 2,385.26. The rally came after the FED failed to surprise the market, maintaining its stance of a gradual pace in rate hikes. Within the Dow, only six components closed lower, with Caterpillar leading the advance by adding 1.69%. UnitedHealth Group gained 1.66%, while Verizon advanced 1.62%. The daily chart for the Dow shows that the benchmark recovered modestly from around its 20 DMA, whilst technical indicators have pared losses and turned higher, with the Momentum barely bouncing from its 100 level, but the RSI indicator near overbought readings. In the 4 hours chart, the index has bounced from its 20 and 100 SMAs that stand together around 20,880, while technical indicators have lost upward strength after entering positive territory, rather reflecting the low volumes after the close than suggesting an upcoming downward move.
Support levels: 20,880 20,852 20,817
Resistance levels: 20,978 21,015 21,064
FTSE 100
The FTSE 100 posted some modest gains, adding 10 points and ending the day at 7,368.64. Hikma Pharmaceuticals was the best performer, advancing 8.04% following the release of its earnings report, as the profit drop was smaller than expected. The company reported an operating profit of £247.6M, hiking dividends. The second best performer was miner Glencore that added 2.86% after Goldman Sachs upgraded the share to ‘buy’ from ‘neutral.’ Rising iron-ore and copper, boosted the mining the sector, albeit Randgold Resources was among the worst performers, ending down 1.07% as gold underperformed. The Footsie extended its advance in after-hours trading, flirting with 7,400 ahead of the Asian opening, tracking Wall Street's advance. The daily chart maintains the positive tone seen on previous updates, with the index advancing further above a bullish 20 DMA and technical indicators extending their tepid advances within positive territory. In the 4 hours chart, the 20 SMA regained its upward strength well below the current level, whilst technical indicators hold within positive territory, but with limited upward momentum.
Support levels: 7,322 7,306 7,262
Resistance levels: 7,397 7,420 7,450
DAX
European equities closed marginally higher, with the German DAX adding 21 points, and settling at 12,009.87, as investors were cautious ahead of the US Federal Reserve monetary policy decision. There were little news to drive the German index, exacerbating the range bound trading. Commerzbank led the advance, adding 2.57%, followed by Deutsche Lufthansa that added 2.32%. Among the worst performers were E.ON, down 3.17% and Volkswagen that shed 0.96%. The daily chart suggests that the index may advance further this Thursday, as it already advanced in electronic trading, now at 12,059, holding above a bullish 20 SMA and with technical indicators regaining their bullish potential, but with the Momentum still within neutral territory. In the 4 hours chart, the technical picture also points for an upward extension, as the index moved further above a still flat 20 SMA, whilst technical indicators advanced within positive territory, and particularly the RSI indicator that stands at 63. March high stands at 12,067, the immediate resistance and the level to surpass to see the index retesting the multi-year high set last February at 12,099.
Support levels: 12,003 11,961 11,909
Resistance levels: 12,067 12,099 12,140