Sample Category Title
Trade Idea Wrap-up: USD/JPY – Stand aside
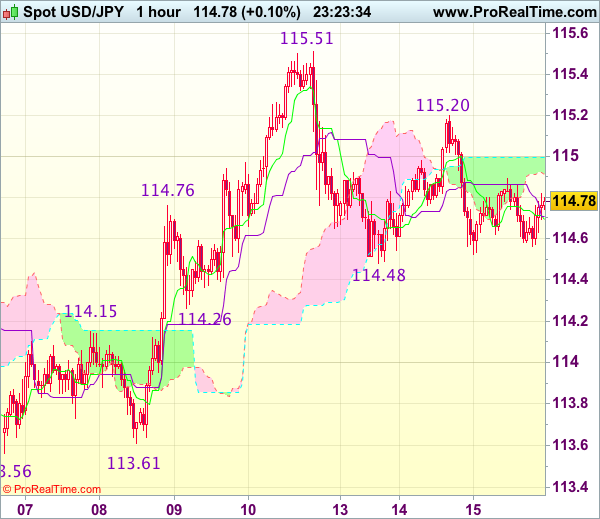
USD/JPY - 114.76
Most recent candlesticks pattern : N/A
Trend : Near term up
Tenkan-Sen level : 114.69
Kijun-Sen level : 114.71
Ichimoku cloud top : 115.00
Ichimoku cloud bottom : 114.91
New strategy :
Stand aside
Position : -
Target : -
Stop : -
As the greenback met renewed selling interest at 115.20 yesterday and slipped again, retaining our view that further consolidation below last week’s high at 115.51 is in store and risk of another fall to 114.48 support cannot be ruled out, however, reckon downside would be limited to 114.26 support and as this move is viewed as retracement of recent upmove, reckon downside would be limited to 114.00-05 (38.2% Fibonacci retracement of 111.69-115.51) and price should stay well above strong support at 113.56-61), bring rebound later.
In view of this, would be prudent to stand aside for now. A firm break above 115.20 would suggest low is formed, bring a stronger rebound but still reckon said resistance at 115.51 would cap upside. Only break there would revive bullishness and extend recent upmove to previous resistance at 115.62, then towards 115.90-00.
No Surprise in February Inflation, all Set for a Fed Hike
Inflation rose to 2.7% (year-on-year) in February, continuing its upward trend as the influence of lower energy prices ebbs. Prices were up a slight 0.1% month-on-month, as lower energy prices partially offset increases for food and other core items.
Gasoline prices were 3% lower (y/y) in February, a key influence behind the 1% drop in the energy category as a whole, as prices for energy services prices (electricity and gas) rose.
Food prices rose 0.2% month-over-month in February, their largest increase since September 2015. Food has exerted downward pressure on headline inflation since the middle of last year, but prices are now showing a bit more upward momentum, and food inflation is now flat on a year-on-year basis.
Core prices rose an as-expected 0.2% (m/m) in February. A slight step down from January's heady 0.3% pace, but on an annualized basis, core price growth has averaged over 3% over the past three months. On a year-on-year basis core inflation was 2.2% in February.
Core services prices (+0.3% m/m) continues to outpace core goods (-0.0% m/m), as the strong U.S. dollar keeps prices for many imported good contained.
With a heavy weight in the index, housing has been a key factor elevating services prices. The price index for owners' equivalent rent picked up in February to 0.3% m/m. On an annual basis, inflation in owners' equivalent rent is 3.5%, a pace it has roughly maintained since November.
Key Implications
Energy prices kept inflation low through 2015 and much of 2016, but have become a key factor in taking headline inflation higher. We expect headline inflation to top out at 2.8% in the third quarter, so we don't expect headline inflation to rise too much further from February's pace.
Today's report is consistent with an interest rate hike by the Fed later today. On the one hand, the Fed will generally look past higher headline inflation as transitory, as the base-year effects from the rise in energy prices from the lows of early 2016 dissipate. On the other hand, the continued improvement in underlying inflation, driven in part by firming wage growth, will be interpreted by the Fed as a sign of a diminishing economic slack, and therefore confirm the need for a tightening of monetary policy.
Americans Continue to Shop through February, after a Strong Start to 2017
Retail sales ticked up by 0.1% in February according to the advance Census Bureau report - on par with expectations. Better yet, January spending was revised up strongly, now up 0.6% during the month to start of the year.
Sales at motor vehicle & parts dealers (-0.2%) slipped a bit, with the ex-auto sales up 0.2% on the month. Gasoline station spending was also lower (-0.6%) - largely due to lower prices. Excluding autos and gas, retail sales were up 0.2% on the month, following up on a 1.1% surge during January (previously reported as 0.7%).
Excluding gas, autos, building materials (+1.8%), and food services (-0.1%), the so-called 'control group' used in calculating GDP was up just 0.1% on the month. While this was half of what was expected, it too came atop of a sizeable revision to January's data which were reported as 0.8% - or double the previous estimate. Sales in the control group were dragged down by sales at electronics stores (-2.8%), department stores (-1.1%), and miscellaneous (-0.8%). Clothing and sporting goods were also lower after sizeable gains in the previous month. Overall sales were boosted by non-store and e-commerce retailers (+1.2%), furniture (+0.7%), and health & personal care stores (+0.7%).
Key Implications
This was a decent report as far as the U.S. consumer is concerned. While the headline print was far from awe-inspiring, the upward revisions to January data point to a much healthier consumption profile than previously anticipated, and suggest that the enthusiasm to shop carried into 2017. Overall we expect consumption to exceed 2% during the first quarter of 2017 despite the warmer weather that pulled down spending on winter clothing and utilities so far.
While some weakness was definitely present in several spending categories, much of this appears related to changing patterns in consumer behavior, with Americans increasingly opting for online purchases and shying away from department stores. Having said that, we expect the consumer to continue driving growth this year, as strong job gains and income gains enable American consumers to go shopping for things they may have held back from buying last year.
Given its relatively constructive tone, this report, alongside the CPI report released simultaneously, will only reaffirm the Fed's resolve to raise rates at today's meeting, with our expectation for two more hikes likely to come later this year as the Fed increasingly approaches its dual targets.
Trade Idea: EUR/GBP – Buy at 0.8645
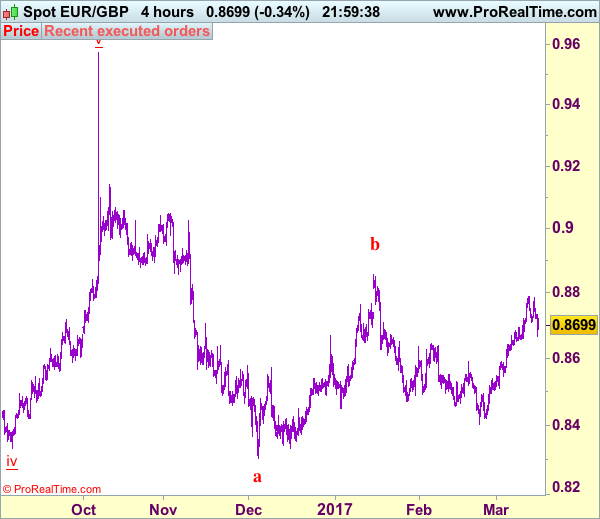
EUR/GBP - 0.8704
Recent wave: Major double three (A)-(B)-(C)-(X)-(A)-(B)-(C) is unfolding and 2nd (A) has possibly ended at 0.6936.
Trend: Near term down
Original strategy :
Buy at 0.8660, Target: 0.8760, Stop: 0.8620
Position : -
Target : -
Stop : -
New strategy :
Buy at 0.8645, Target: 0.8760, Stop: 0.8605
Position : -
Target : -
Stop : -
As the single currency has retreated after faltering below indicated resistance at 0.8788 (last week’s high), retaining our view that further consolidation below this level would be seen and pullback to 0.8660 cannot be ruled out, however, reckon downside would be limited to 0.8645-48 (38.2% Fibonacci retracement of 0.8422-0.8788) and bring another rise later, break of said resistance at 0.8788 would extend the rise from 0.8403 low to 0.8800, however, loss of near term upward momentum should prevent sharp move beyond 0.8825-30 and price should falter well below 0.8850.
In view of this, would not chase this rise here and we are looking to buy euro on subsequent pullback as 0.8645-50 should limit downside. Below 0.8605 (50% Fibonacci retracement of 0.8422-0.8788) would defer and suggest top is possibly formed, risk test of 0.8560-65 (61.8% Fibonacci retracement) but support at 0.8547 should remain intact.
Our preferred count is that, after forming a major top at 0.9805 (wave V), (A)-(B)-(C) correction is unfolding with (A) leg ended at 0.8400 (A: 0.8637, B: 0.9491 and 5-waver C ended at 0.8400. Wave (B) has ended at 0.9413 and impulsive wave (C) has either ended at 0.8067 or may extend one more fall to 0.8000 before prospect of another rally. Current breach of indicated resistance at 0.9043 confirms our view that the (C) leg has ended and bring stronger rebound towards 0.9150/54, then towards 0.9240/50.
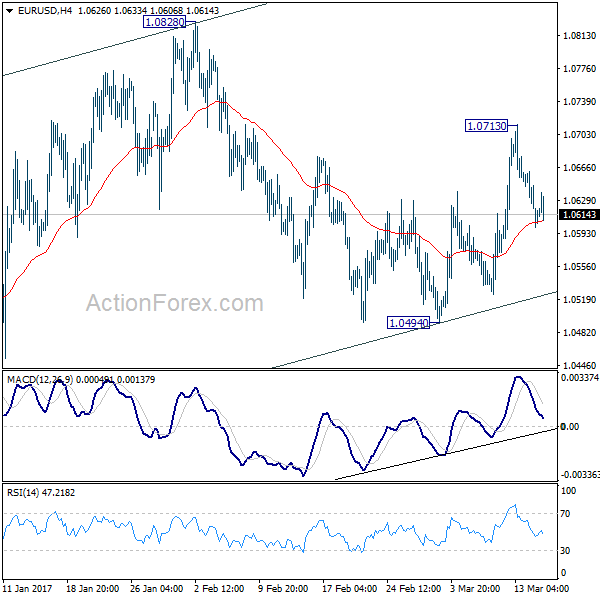
Elliott Wave Analysis: EURUSD Trading In A Temporary Correction
Market did not move much in the last few hours as everyone wait on latest news from the FED when I think USD can see strength based on possible rate hike. Charts suggests the same, with price trading in favour of the buck. However, a three wave bounce up on EURUSD is not over yet, but 1.0650-1.0670 area can be an interesting region for a turn lower. Invalidation level is at 1.0715, but that's only for short-term charts, where bigger downtrend cycles will not get invalidated yet!
EURUSD, 1H
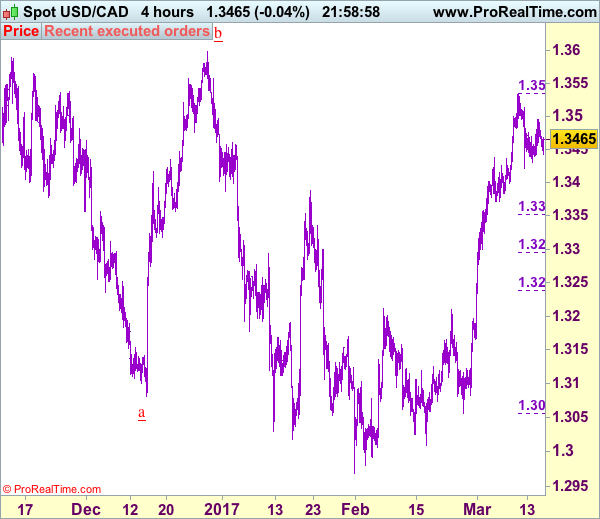
Trade Idea: USD/CAD – Buy at 1.3350
USD/CAD - 1.3475
Recent wave: Only wave v of c has ended at 0.9407 and wave C of major A-B-C correction is underway for headway to 1.4700
Trend: Near term up
Original strategy :
Buy at 1.3350, Target: 1.3550, Stop: 1.3290
Position: -
Target: -
Stop: -
New strategy :
Buy at 1.3350, Target: 1.3550, Stop: 1.3290
Position: -
Target: -
Stop:-
The greenback has remained confined within near term established range and further sideways trading is in store, however, as long as last week’s high at 1.3535 holds, risk another another corrective fall to 1.3421 cannot be ruled out but reckon downside would be limited to 1.3390-00 and reckon 1.3350-55 (38.2% Fibonacci retracement of 1.3056-1.3535) would limit downside and bring another rise later, above said resistance at 1.3535 would extend recent upmove for further gain to 1.3570-75 and possibly towards 1.3600 but near term overbought condition should prevent sharp move beyond 1.3640-50, bring retreat later.
In view of this, would not chase this rise here and would be prudent to buy on further pullback as 1.3350 should limit downside. Only below 1.3295-00 (50% Fibonacci retracement of 1.3056-1.3535) would signal top is formed, risk correction to 1.3250-60 but price should stay well above indicated previous resistance at 1.3212 (now support), bring another rise later.
To recap, wave B from 1.3066 is unfolding as an a-b-c and is sub-divided as a: 1.2192, b: 1.2716 and wave c is a 5-waver with i: 1.1983, ii: 1.2506, extended wave iii with minor iii at 1.0206, wave iv ended at 1.0781 and wave v as well as wave iii has ended at 0.9931, hence the subsequent choppy trading is the wave iv which is unfolding as (a)-(b)-(c) with (a) leg of iv ended at 1.0854, followed by (b) leg at 1.0108 and (c) leg as well as the wave iv ended at 1.0674. The wave v is sub-divided by minor wave (i): 0.9980, (ii): 1.0374, (iii): 0.9446, (iv): 0.9913 and (v) as well as v has possibly ended at 0.9407, therefore, consolidation with upside bias is seen for major correction, indicated target at 1.3700 and 1.4000 had been met and further gain to 1.4700 would be seen later.
Energy Prices Once again Pushed US Inflation Higher in February
- The all items index edged up just 0.1% in February, the smallest monthly increase since July 2016, though that was enough to push the year-over-year rate up to 2.7% from 2.5% in January.
- The increase in year-over-year inflation was largely due to energy price base effects. While the energy index fell in February (with gasoline prices down 3%), the decline was more significant a year ago when oil prices hit their low point. As a result, the year-over-year rate of energy price inflation picked up to 15% from 11% in January.
- Core prices (ex food and energy) posted a 0.2% increase with the year-over-year rate edging down to 2.2% in February. Prices for non-energy services rose while core commodities were flat.
- Services prices were up 3.2% year-over-year, the fastest pace since November 2008. The shelter component remains a significant source of inflation, though prices for services ex shelter have also trended higher for more than a year.
Our Take:
The increase in headline CPI inflation to 2.7% is consistent with market expectations and was once again largely an energy story. The now-inflationary impact of energy prices is expected to prove transitory - indeed, we think today's reading will mark the near-term peak in CPI inflation - and thus won't alter the Fed's plans for removing accommodation gradually. Beneath the higher headline reading, core inflation edged down from its post-recession high but there was some evidence of firming domestic price pressure, and a tight labour market and rising wages should support underlying inflation going forward. Today's report is consistent with Chair Yellen's comments that it would be "unwise" to wait too long before further removing accommodation. We expect the Fed will announce a 25 basis point rate hike this afternoon and we'll be paying close attention to the Committee's 'dot plot' to see if three hikes per year in 2017 and 2018 is still seen as an appropriate pace given upside risks to inflation from potential fiscal policy stimulus.
U.S. February Retail Sales Rise a Minimal 0.1%
- February retail sales rose an expected 0.1% in the month though the increase followed a much stronger and upwardly revised 0.6% gain in January.
- Though the level of auto sales remained high in the month it was little changed from January resulting in motor vehicle dealership sales in down a minimal 0.2%.
- Gas station receipts dropped 0.6% weighed down by indications of falling gasoline prices.
- Sales at building material stores continued to be strong rising 1.8% building further onto outsized gains in January and December of 1.2% and 2.2%, respectively.
- Control retail sales, which excludes autos, gas stations and building material stores rose a modest 0.1% though this followed a sizeable and upwardly revised gain of 0.8% in January.
- The data is consistent with our expectation that annualized consumer spending growth in the first quarter will moderate to 1 1/2% from the 3.0% recorded in Q4.
Our Take:
Lower gas prices and stalling auto sales, albeit at elevated levels, weighed on retail activity in February. However strength elsewhere resulted in retail sales still managing to eke out a gain following an upwardly revised 0.6% increase in January. The levelling out of auto sales following robust gains late in 2016 points to a slowing in consumer spending early in 2017 with today's report signaling that the quarterly increase is likely to come in at 1 1/2%, about half the pace of the previous three quarters. Recent robust employment gains suggest little reason to expect this slowing to continue. As well, indications of an offsetting strengthening in Q1 business investment will allow overall GDP growth to remain at a slightly above-potential pace in the current quarter. Sustained above-potential growth prompted the Fed to return to tightening mode late last year and is expected to keep them tightening through 2017 including a widely-expected 25-basis point hike at this afternoon's FOMC meeting.
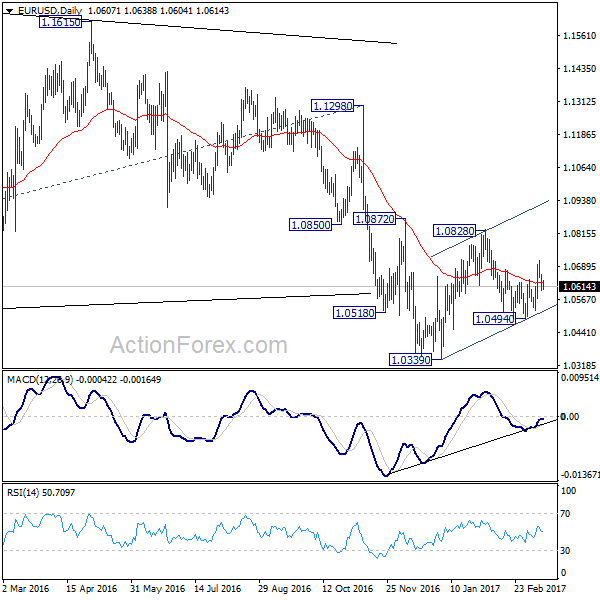
EUR/USD Mid-Day Outlook
Daily Pivots: (S1) 1.0581; (P) 1.0621 (R1) 1.0644; More.....
Intraday bias in EUR/USD stays mildly on the downside for the moment. Deeper fall could be seen back to 1.0494 support. Overall, price actions from 1.0339 are seen as a corrective pattern. Break of 1.0494 will revive that case that such correction is completed. And in such case, deeper decline should be seen to retest 1.0339. Meanwhile, above 1.0713 will turn bias back to the upside for 1.0828 and above to extend the correction from 1.0339.
In the bigger picture, as long as 1.1298 key resistance holds, whole down trend from 1.6039 (2008 high) is still expected to continue. Break of 1.0339 low will send EUR/USD through parity to 61.8% projection of 1.3993 to 1.0461 from 1.1298 at 0.9115.
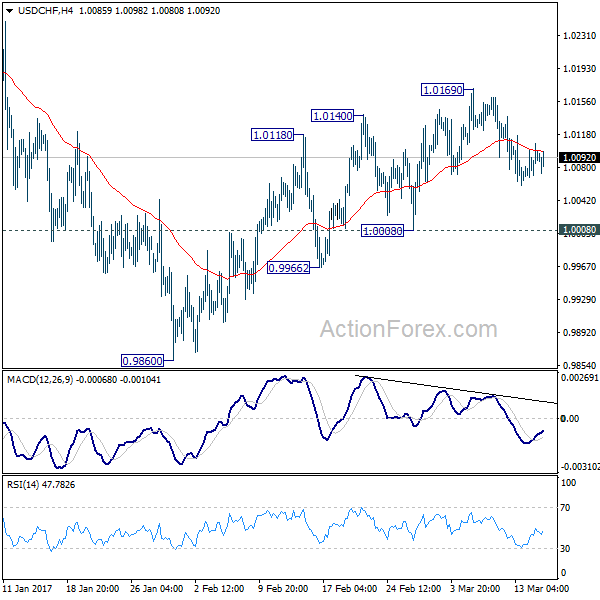
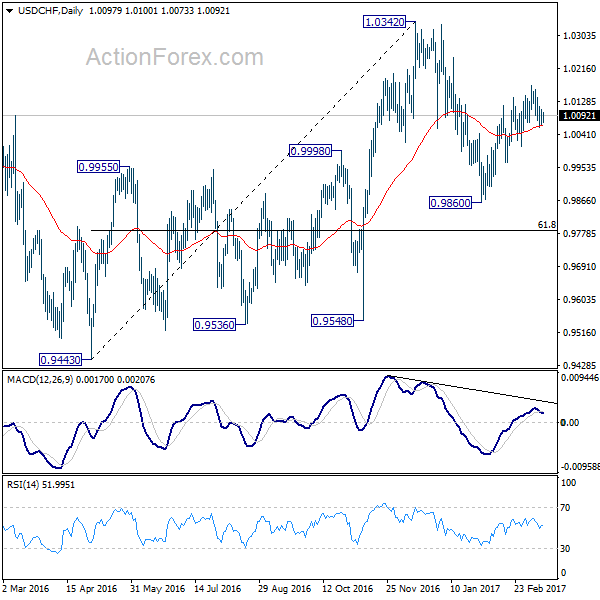
USD/CHF Mid-Day Outlook
Daily Pivots: (S1) 1.0076; (P) 1.0092; (R1) 1.0116; More.....
No change in USD/CHF's outlook. Intraday bias stays neutral as the corrective pull back from 1.0169 continues. At this point, with 1.0008 support intact, further rise is mildly in favor. Above 1.0169 will turn bias to the upside and target a test on 1.0342 resistance. Based on neutral medium term outlook, we'd be cautious on topping below 1.0342. On the downside, break of 1.0008, however, will indicate completion of the rebound from 0.9860. And intraday bias will be turned back to the downside for 0.9860.
In the bigger picture, prior rejection from 1.0327 resistance argues that USD/CHF is staying in a medium term sideway pattern. In any case, decisive break of 1.0342 resistance is needed to confirm underlying strength. Otherwise, we'll stay neutral in the pair first. In case of another fall, we'd expect strong support from 0.9443/9548 support zone.