Sample Category Title
Trade Idea Update: EUR/USD – Stand aside
EUR/USD - 1.0620
New strategy :
Stand aside
Position : -
Target : -
Stop : -
Although the single currency slipped to as low as 1.0600, as euro found good support there and has rebounded again, suggesting consolidation above this level would be seen and gain to 1.0660-65 cannot be ruled out, however, break there is needed to signal low is formed, bring further gain to 1.0680-85 but price should falter below this week’s high at 1.0714.
On the downside, below said support at 1.0600 would signal top has been formed at 1.0714 and downside risk remains for the fall from there to bring retracement of recent rise to 1.0570-75, then 1.0550 but reckon downside would be limited and support at 1.0525 should remain intact. As near term outlook is mixed, would be prudent to stand aside in the meantime.
Dollar Wobbles Ahead Of FOMC
The Greenback was under pressure during early trading on Wednesday as bears exploited the pre-FOMC jitters and anxiety to attack prices lower. Although sellers may be commended on their ability to trigger a sharp technical correction ahead of the FOMC meeting, the downside risks may be limited especially after Tuesday's impressive inflation data reinforced expectations of a probable rate hike in March. Much attention will be directed towards both the FOMC statement and economic projections this evening which may offer investors some insight on the pace of hikes this year. An upwards shift in the updated 'dot plot' could heighten speculations of the Federal Reserve raising US interest rates at least four times in 2017. The Dollar should remain buoyed with confidence consistently rising over the health of the US economy and prospects growing over higher US interest rates this year.
From a technical standpoint, although the Dollar Index is slightly pressured on the daily charts, a decisive breakout above 101.50 could open a path back towards 102.00.
Sterling could turn chaotic
Investors should be prepared for a chaotic rollercoaster ride when dealing with Sterling as the Brexit developments, political risk and overall uncertainty sparks explosive levels of volatility. It was only on Monday investors were speculating that Article 50 will be triggered as soon as Tuesday before markets confirmed that Theresa May will start the Brexit negotiations at the end of the month. Recent reports released during early trading on Wednesday suggesting that the European Union could force the UK to wait until June to start the Brexit talks has compounded to the confusion which may translate to more pain for Sterling in the longer term. With the ongoing Brexit woes effectively strengthening the relationship between uncertainty and Sterling, further downside losses should be expected.
Concerns remain elevated over Brexit having negative impacts to the UK economy with the recent mixed jobs reports providing permission for bears to send the GBPUSD lower. Although the unemployment rate in the UK has declined to its lowest since 1975; the decline in average earnings that may rekindle concerns over the sustainability of UK's consumer fuelled economic growth could weigh heavily on sentiment. The Brexit anxieties have gripped the Pound and the frighteningly low buying sentiment may cap major upside gains moving forward.
From a technical standpoint, the GBPUSD is heavily pressured on the daily charts. Price weakness below 1.2150 could encourage a decline towards 1.2000.
Commodity spotlight – WTI
WTI Crude descended deeper into the abyss on Tuesday after reports of a surprise output jump from Saudi Arabia revived concerns of the excessive oversupply in the global markets. There was already a small seed of doubt over the compliance side of the production cut agreement with this release providing the permission for bears to attack oil prices. It is becoming clear that the optimism over the OPEC production cut is rapidly diminishing with fears of the cartel not renewing the deal for the second half of the year already translating to renewed selling pressures. Oil market weakness has become a key theme this quarter and bears may install fresh rounds of selling if U.S crude inventories continue to rise incessantly. From a technical standpoint, WTI Crude is heavily bearish on the daily charts. Previous light support around $49 may transform into a temporary resistance which may open a path back down towards $47.
Trade Idea Update: USD/JPY – Stand aside
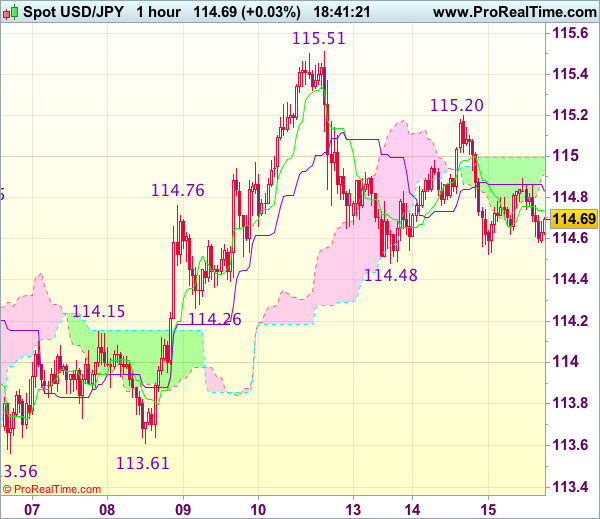
USD/JPY - 114.69
New strategy :
Stand aside
Position : -
Target : -
Stop : -
As the greenback met renewed selling interest at 115.20 yesterday and slipped again, retaining our view that further consolidation below last week’s high at 115.51 is in store and risk of another fall to 114.48 support cannot be ruled out, however, reckon downside would be limited to 114.26 support and as this move is viewed as retracement of recent upmove, reckon downside would be limited to 114.00-05 (38.2% Fibonacci retracement of 111.69-115.51) and price should stay well above strong support at 113.56-61), bring rebound later.
In view of this, would be prudent to stand aside for now. A firm break above 115.20 would suggest low is formed, bring a stronger rebound but still reckon said resistance at 115.51 would cap upside. Only break there would revive bullishness and extend recent upmove to previous resistance at 115.62, then towards 115.90-00.
EUR/USD – Euro In Holding Pattern Ahead Of Expected Fed Move
EUR/USD remains under pressure, as the pair has dropped closed to the 1.06 line. Currently, the pair is trading at 1.0630. On the release front, Eurozone Employment Change edged up to 0.3%, above the forecast of 0.2%. In the US, it's a busy day. Retail sales and CPI indicators are expected to soften in February. Today's highlight is the Federal Reserve policy meeting, with the central bank widely expected to raise the benchmark rate a quarter-point, from 0.50% to 0.75%. On Thursday, the eurozone releases Final CPI, while the US publishes a host of key indicators, led by unemployment claims.
German numbers were a mixed bag on Tuesday. There was further indication that inflation continues to improve, as Final CPI rebounded with a gain of 0.6%, compared to a 0.6% decline a month earlier. The well-respected ZEW Economic Sentiment report improved to 1.28, although the markets had expected a stronger reading. Eurozone ZEW Economic Sentiment climbed to 25.6, its strongest gain since December 2015.
The eurozone continues to post improved inflation and growth data, and this has led to calls in some quarters for the ECB to tighten monetary policy. The ECB has kept the benchmark rate at a flat 0.0%, and its asset-purchase program does not expire until December. Will ECB President Mario Daraghi taper the monthly purchases or at least signal such an intent? Draghi is doing his best to perform a complicated balancing act. A stronger economy would favor tighter policy, but he does not want ECB to become entangled in heated political contests in Europe. Dutch voters are having their say on Wednesday, while France holds elections in April, followed by Germany in September.
With the markets expecting a quarter-point rate hike on Wednesday, will the currency markets react to a Fed move? Although a rate hike has been priced in by the markets at 93%, there have been disappointments in the past, so a rate move could boost the dollar at the expense of gold. Strong US employment numbers in February have reinforced market speculation that the Fed will raise rates for the first time this year. Nonfarm payrolls sparkled in February, as the indicator jumped to 235 thousand, easily beating the estimate of 196 thousand. Wage growth climbed 2.6% compared to February 2016, while the participation rate edged up to 63.0%, up from 62.9%. These solid job numbers have also provided President Trump with a much-needed boost. Trump is under pressure to present an economic agenda, but the markets won't mind giving him some additional breathing room, with the economy performing so well.
EUR/CHF Elliott Wave Analysis
EUR/CHF : 1.0717
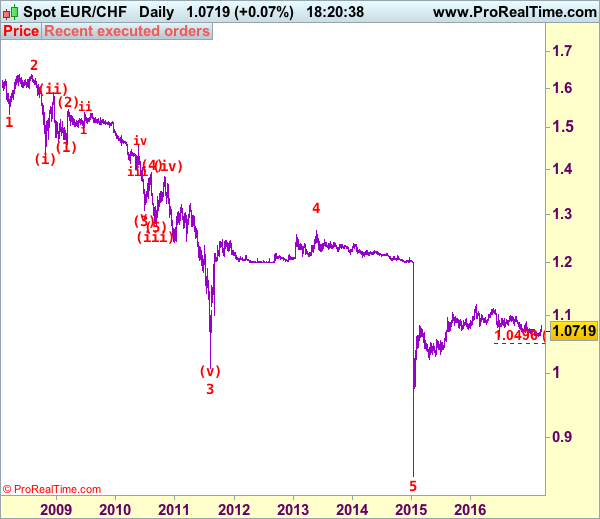
EUR/CHF: Major wave 5 trough ended at 0.8426 and correction has commenced from there for subsequent gain towards 1.1400-1.1500.
Although the single currency staged a strong rebound to 1.0825, as euro met renewed selling interest there and has retreated, retaining our bearish view and consolidation with downside bias is seen for weakness to 1.0650-60, however, break of support at 1.0622 is needed to confirm early erratic decline from 1.1201 (2016 high) has resumed, bring subsequent selloff to 1.0550 and possibly towards 1.0500 but oversold condition should prevent sharp fall below latter level and reckon 1.0390-00 would hold from here, risk from there has increased for a rebound later.
To recap our preferred count, the decline from 1.6828 (end wave (B)) is labeled as the beginning of wave (C) which should unfold as an impulsive move with 1: 1.5326, 2: 1.6377 and wave 3 is sub-divided into (i): 1.4300, (ii): 1.5880 and wave (iii) is still unfolding with (1): 1.4577, (2): 1.5448 and wave (3) is an extended 3rd with i: 1.5006, ii: 1.5383, wave iii: 1.3073, then wave iv ended at 1.3925 and wave v at 1.3073, wave (4) ended at 1.3925 and wave (5) has ended at 1.2765 which also marked the low of wave (iii) and wave (iv) has ended at 1.3835 and wave (v) as well as larger degree wave 3 has ended at 1.0075. The selloff from 1.2650 signals wave 4 has ended there and we are taking a view that the wave 5 could also have ended 0.8426, hence consolidation is seen with mild upside bias for rebound to 1.1000 first, then towards 1.1400.
On the upside, expect recovery to be limited to 1.0750-60 and bring another decline. Only above said resistance at 1.0825 would abort and signal low has been formed, bring a stronger rebound to 1.0850 and later towards resistance at 1.0898 which is likely to cap euro’s upside, the pair shall head back south again from there.
Recommendation: Hold short entered at 1.0750 for 1.0550 with stop above 1.0825.
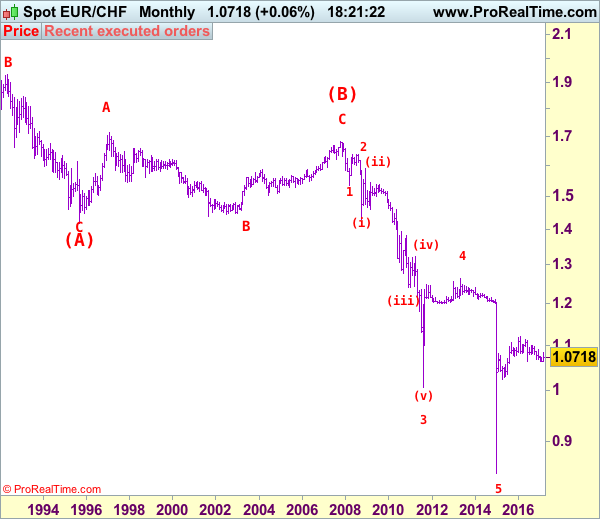
The long-term downtrend started from 1.9626 (Apr 1985) to 1.4166 (Sep 1995) is treated as wave (A) with A:1.6285 (Dec 1987), B: 1.9342 (May 1992) and C: 1.4166, then wave (B) ended at 1.6828 with A: 1.7147 (Feb 1997), B: 1.4398 (Sep 2001), C: 1.6828 (Nov 2007), therefore, wave (C) is now in progress with the breakdown indicated as above. This wave (C) already met indicated downside target at 1.1455/60 and 1.1300, it could have ended at 0.8426, consolidation with mild upside bias is seen for gain to 1.1000 and later towards 1.2000.
AUD/USD Elliott Wave Analysis
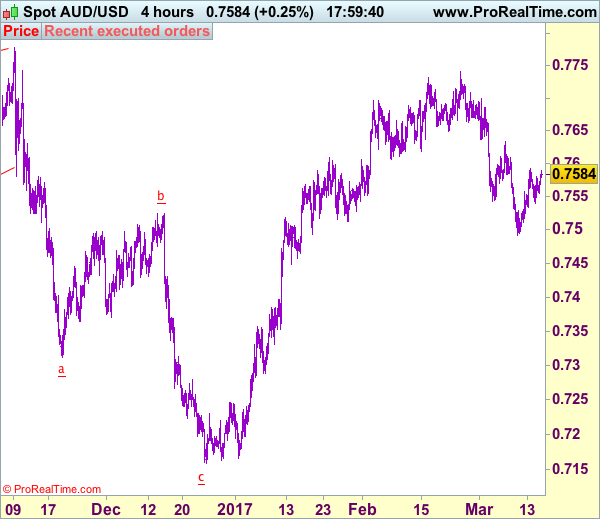
AUD/USD – 0.7581
AUD/USD – Wave 5 of C and (B) has possibly ended at 1.1081
Although aussie has recovered after finding support at 0.7491 and consolidation with initial upside bias is seen for gain to 0.7600-05, reckon upside would be limited to 0.7630-35 and bring another decline, below 0.7530-35 would bring retest of 0.7491 but break there is needed to signal top has indeed been formed at 0.7741, bring retracement of recent upmove to 0.7455-60 but reckon downside would be limited to 0.7425-30 (50% Fibonacci retracement of 0.7158-0.7696) and price should stay above 0.7360-65 (61.8% Fibonacci retracement), bring another rise later.
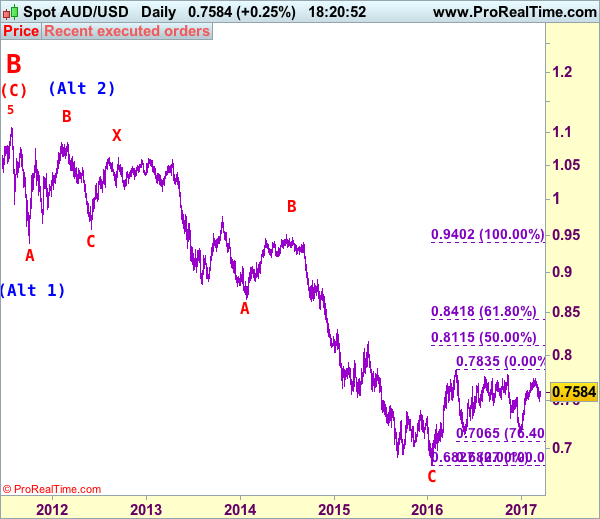
We are keeping our count that top has been formed at 1.1081 (wave 5 of V) and major correction (A-B-C-X-A-B-C) has commenced, indicated downside targets at 0.7945 (61.8% Fibonacci retracement of entire rise from 0.6007-1.1081) and 0.7750 had been met and downside bias is seen for further weakness to 0.6800, then 0.6700 but reckon 0.6500 would hold from here. Our preferred count is that the rally from 0.6007 to 0.7270 (7 Jan 2009) is marked as wave A, the retreat to 0.6248 (2 Feb 2009) is wave B and the subsequent upmove is labeled as wave C with wave (iii) and wave (iv) ended at 0.8265 and 0.7700 respectively and wave (v) as well as 3 ended at 0.9407, then wave 4 ended at 0.8066 (instead of 0.8578). The wave 5 has met our indicated projection target of 1.1060 and could ended at 1.1081, this level is now treated as the peak of wave (C) as well as larger degree wave B, hence major fall in wave C has commenced, our initial downside target at psychological support at 0.7000 has just been met and further weakness to 0.6500 would be seen later.
On the upside, whilst recovery to 0.7600-05 cannot be ruled out, reckon upside would be limited to 0.7635-40 and bring another decline. Above 0.7700 would risk retest of said resistance at 0.7741 but break there is needed to extend recent rise from 0.7158 to resistance at 0.7778. Looking ahead, only a break of this level would suggest another leg of major corrective upmove from 0.6827 low is underway for retest of 0.7835 resistance first, then 0.7900, however, psychological resistance at 0.8000 should hold from here.
Recommendation: Sell at 0.7635 for 0.7450 with stop above 0.7735
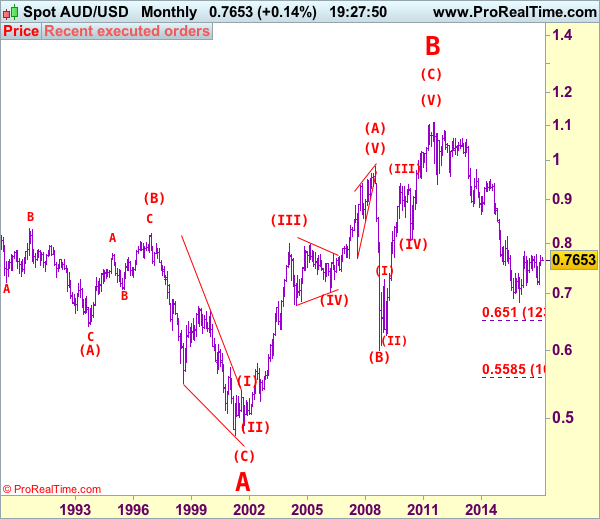
Our alternate count on the daily chart treated the top formed in 2008 at 0.9851 could be a larger degree wave I and was followed by a deep and sharp correction in wave II to 0.6007 and wave III is unfolding from there.
The long-term uptrend started from 0.4775 (2 Apr 2001) with an impulsive structure. Wave I is labeled as 0.4775 to 0.9851 (15 Jul 2008), wave II has ended at 0.6007 (Oct 2008) and wave III is still in progress which may extend further gain to 1.1265.
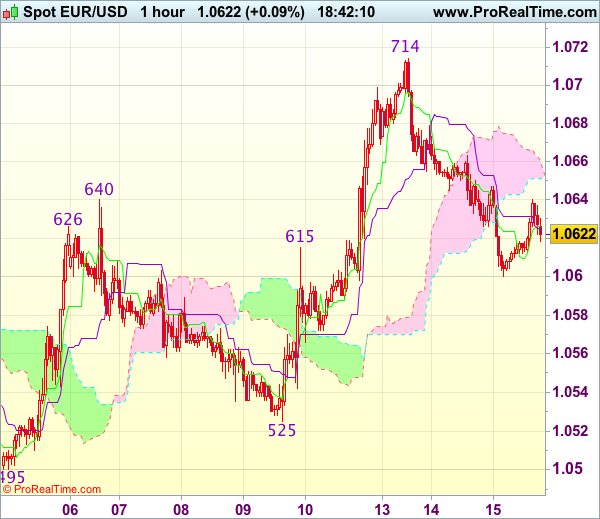
EURUSD Aiming For More Weakness
On the 4H chart of EURUSD we can see price undergoing a minor bearish breakdown from the 1.0714 level, where a potential top for the correction in wave 2 could have been found. Well, if that is the case, then more weakness may be in store for the pair and ideally price will break beneath the wave x around the 1.0494 region in days ahead.
EURUSD, 4H
FOMC Meeting And Dutch Elections In Focus
News and Events:
Fed set to increase borrowing rates by 25bps
There is almost no doubt no that the FOMC will announce a tightening of its monetary policy this evening, especially considering the relative solid job report that was released last Friday. Yet the FOMC's confidence seem to be based more on sentiment indicators and massive rally in equity markets rather than actual economic data. While there have been bright spots, lagging inflation data and weak real wage growth suggest not everything US economic is humming. It's likely that the rhetoric from the Fed and sudden repricing of the policy path with three 25bp hike in 2017 is overdone. We suspect that growing possibility that growth will remain subdued longer than market expectations. The fact that real wage growth actually went negative indicates that fear of inflation surging is unlikely and that the recent pickup in the headline gauge was mostly driven by the recovery of commodity prices.
We are convinced that Fed members will restrain themselves from releasing a hawkish statement and forecast that would heightened market's expectations. The Fed over the last few months, the Fed has been modifying slightly its communications in favour of a more neutral ton, which gives the Fed the freedom to adjust its communication to the incoming economic data. We believe Janet Yellen will adopt a cautious ton and wording as the US economy is still in a recovery process. Therefore, the risk is mostly on the downside for the USD.
Dutch Elections - Further Uncertainty Risk
Wednesday 15th March brings a critical litmus test of the European political landscape. The Dutch general elections will provide a gauge of the populist sentiment in the Eurozone. The race between the mainstream VVD party and anti EU PVV party remains close. According to recent polls, PVV had lost ground yet events surrounding Turkey's President Erdogan, might have inflamed immigrant issues, supporting the PVV policy stance. Yet, due to the nature of the political structure of the Netherlands even a resounding PVV victory is unlikely to have immediate implications for the EU and Euro. The reason is that the mainstream parties that the PVV need to build a coalition have ruled out forming a government with Geert Wilders, suggesting that the VVD will continue to head any coalitions. Of course this is politics 2.0 and anything can happen (a strong showing by PVV entices parties to reverse alliances or PVV will become diminished by the historically liberal nation). However, regardless of the actual outcome the key result is likely to indicate a fragmented government and sustained threat to EU. For markets this is the biggest immediate risk, a Brussels frozen by uncertainty. Any gains in Euro (due primarily to shifting expectations for ECB monetary policy) will likely be tempered by the politically landmine filled event calendar. A positive outcome in the Netherlands will only lead to French and German elections and now the destabilizing potential Scottish independence referendum.
EUR/CHF remains the key FX trade to hedge an anti EU outcome. This morning, there was no clear trend across EUR crosses. The pound sterling was the best performer against the single currency as it reversed yesterday's sharp losses. EUR/GBP eased to 0.8697 after failing to break the 0.8785 resistance. The closest support can be found at 0.8591 (50dma).
Today's Key Issues (time in GMT):
- Feb PPI MoM, last -0,50% DKK / 08:00
- Feb PPI YoY, last 4,10% DKK / 08:00
- Feb Central Gov't Budget Balance, last 11.43b TRY / 08:00
- Feb Producer & Import Prices MoM, exp 0,40%, last 0,40% CHF / 08:15
- Feb Producer & Import Prices YoY, exp 1,80%, last 0,80% CHF / 08:15
- Riksbank's Ingves Speaks in Frankfurt SEK / 08:30
- Jan Retail Sales MoM, exp 0,20%, last -0,50% EUR / 09:00
- Jan Retail Sales YoY, exp 0,80%, last -0,20% EUR / 09:00
- Feb Claimant Count Rate, last 2,10%, rev 2,20% GBP / 09:30
- Feb Jobless Claims Change, last -42.4k, rev -41.4k GBP / 09:30
- Jan Average Weekly Earnings 3M/YoY, exp 2,40%, last 2,60% GBP / 09:30
- Jan Weekly Earnings ex Bonus 3M/YoY, exp 2,50%, last 2,60% GBP / 09:30
- Jan ILO Unemployment Rate 3Mths, exp 4,80%, last 4,80% GBP / 09:30
- Jan Employment Change 3M/3M, exp 87k, last 37k GBP / 09:30
- Jan General Government Debt, last 2217.7b EUR / 09:30
- ECB's Praet speaks in Frankfurt EUR / 09:30
- 4Q Employment QoQ, last 0,20% EUR / 10:00
- 4Q Employment YoY, last 1,20% EUR / 10:00
- 1Q BER Business Confidence, last 38 ZAR / 10:00
- Feb CPI FOI Index Ex Tobacco, last 100,6 EUR / 10:00
- Feb F CPI EU Harmonized YoY, exp 1,60%, last 1,60% EUR / 10:00
- Mar FGV Inflation IGP-10 MoM, exp 0,20%, last 0,14% BRL / 11:00
- Jan Retail Sales Constant YoY, exp 1,10%, last 0,90% ZAR / 11:00
- Jan Retail Sales MoM, exp 0,20%, last -2,30% ZAR / 11:00
- mars.10 MBA Mortgage Applications, last 3,30% USD / 11:00
- Mar Empire Manufacturing, exp 15, last 18,7 USD / 12:30
- Feb CPI MoM, exp 0,00%, last 0,60% USD / 12:30
- Feb CPI Ex Food and Energy MoM, exp 0,20%, last 0,30% USD / 12:30
- Feb CPI YoY, exp 2,70%, last 2,50% USD / 12:30
- Feb CPI Ex Food and Energy YoY, exp 2,20%, last 2,30% USD / 12:30
- Feb CPI Core Index SA, exp 251,155, last 250,783 USD / 12:30
- Feb CPI Index NSA, exp 243,416, last 242,839 USD / 12:30
- Feb Real Avg Weekly Earnings YoY, last -0,60%, rev -0,50% USD / 12:30
- Feb Real Avg Hourly Earning YoY, last 0,00%, rev 0,10% USD / 12:30
- Feb Retail Sales Advance MoM, exp 0,10%, last 0,40% USD / 12:30
- Feb Retail Sales Ex Auto MoM, exp 0,10%, last 0,80% USD / 12:30
- Feb Retail Sales Ex Auto and Gas, exp 0,20%, last 0,70% USD / 12:30
- Feb Retail Sales Control Group, exp 0,20%, last 0,40% USD / 12:30
- mars.13 CPI WoW, last 0,00% RUB / 13:00
- mars.13 CPI Weekly YTD, last 0,90% RUB / 13:00
- Feb Existing Home Sales MoM, last -1,30% CAD / 13:00
- Bank of Italy Governor Visco Speaks at Milan Event EUR / 13:45
- Mar NAHB Housing Market Index, exp 65, last 65 USD / 14:00
- Jan Business Inventories, exp 0,30%, last 0,40% USD / 14:00
- mars.10 DOE U.S. Crude Oil Inventories, exp 3133k, last 8209k USD / 14:30
- mars.10 DOE Cushing OK Crude Inventory, exp 500k, last 867k USD / 14:30
- mars.15 FOMC Rate Decision (Upper Bound), exp 1,00%, last 0,75% USD / 18:00
- mars.15 FOMC Rate Decision (Lower Bound), exp 0,75%, last 0,50% USD / 18:00
- Federal Reserve Board Chairwoman Janet Yellen holds a news... USD / 18:30
- Jan Net Long-term TIC Flows, last -$12.9b USD / 20:00
- 4Q GDP SA QoQ, exp 0,70%, last 1,10% NZD / 21:45
- 4Q GDP YoY, exp 3,20%, last 3,50% NZD / 21:45
- Feb Foreign Direct Investment YoY CNY, exp -4,20%, last -9,20% CNY / 23:00
The Risk Today:
EUR/USD continues to strengthen despite ongoing bearish consolidation. Hourly resistance given at 1.0679 (16/02/2017 high) has been broken while hourly support at 1.0493 (22/02/2017 low). The technical structure suggests deeper increase towards resistance at 1.0874 (08/12/2017 high). In the longer term, the death cross late October indicated a further bearish bias. The pair has broken key support given at 1.0458 (16/03/2015 low). Key resistance holds at 1.1714 (24/08/2015 high). Expected to head towards parity.
GBP/USD continues to edge lower despite ongoing consolidation since the pair has broken support given at 1.2254 (19/01/2017 low). The road is wide-open for further decline. Hourly resistance is now given at 1.2300 (05/03/2017 high). The long-term technical pattern is even more negative since the Brexit vote has paved the way for further decline. Long-term support given at 1.0520 (01/03/85) represents a decent target. Long-term resistance is given at 1.5018 (24/06/2015) and would indicate a long-term reversal in the negative trend. Yet, it is very unlikely at the moment.
USD/JPY is pushing higher towards key resistance given at 115.62 (19/01/2016 high). Hourly support can be found at 113.56 (06/03/2017 low). Expected to push higher. We favor a long-term bearish bias. Support is now given at 96.57 (10/08/2013 low). A gradual rise towards the major resistance at 135.15 (01/02/2002 high) seems absolutely unlikely. Expected to decline further support at 93.79 (13/06/2013 low).
USD/CHF is still riding within uptrend channel and is on its way to monitor support implied by lower bound of the uptrend channel. Key resistance is given at a distance at 1.0344 (15/12/2016 high). Hourly support is given at 1.0075 (13/03/2017 low). Expected to consolidate. In the long-term, the pair is still trading in range since 2011 despite some turmoil when the SNB unpegged the CHF. Key support can be found 0.8986 (30/01/2015 low). The technical structure favours nonetheless a long term bullish bias since the unpeg in January 2015.
| EURUSD | GBPUSD | USDCHF | USDJPY |
| 1.1300 | 1.3445 | 1.1731 | 121.69 |
| 1.0954 | 1.3121 | 1.0652 | 118.66 |
| 1.0874 | 1.2771 | 1.0344 | 115.62 |
| 1.0626 | 1.2200 | 1.0088 | 114.66 |
| 1.0454 | 1.1986 | 0.9967 | 111.36 |
| 1.0341 | 1.1841 | 0.9862 | 106.04 |
| 1.0000 | 1.0520 | 0.9550 | 101.20 |
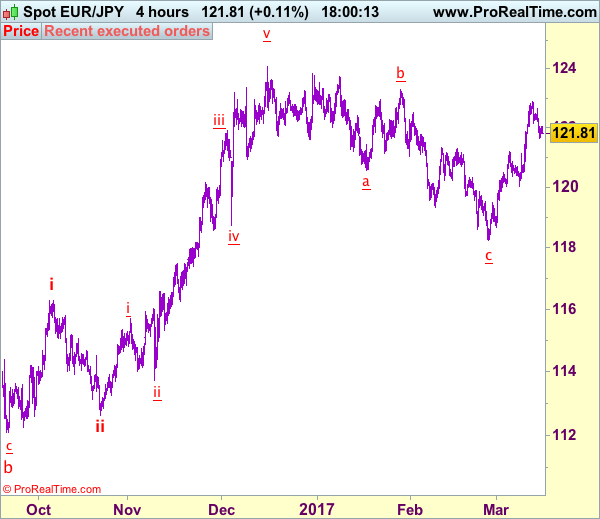
Trade Idea: EUR/JPY – Exit long entered at 121.80
EUR/JPY - 121.85
Recent wave: wave v of (C) ended at 94.12 and major correction in wave A has ended at 149.79
Trend: Near term up
Original strategy:
Bought at 121.80, Target: 123.80, Stop: 121.20
Position: - Long at 121.80
Target: - 123.80
Stop: - 121.20
New strategy :
Exit long entered at 121.80,
Position: - Long at 121.80
Target: -
Stop:-
Although euro recovered after finding support at 121.63, the retreat from 122.89 suggests near term downside risk remains for this move to bring retracement of recent upmove to 121.45-50, however, break of previous resistance at 121.13-19 is needed to signal top has been formed at 122.89, bring further weakness to 120.50-60 first.
In view of this, would be prudent to exit long entered at 121.80 and stand aside for now. Above 122.14 (previous support now resistance) would bring rebound to 122.64 resistance but break there is needed to revive bullishness and signal the pullback from 122.89 has ended, bring retest of this level, break there would extend recent rise from 118.24 to 123.30-35. Looking ahead, a sustained breach above this level is needed to retain bullishness and signal early erratic fall from 124.10 top has ended at 118.24, bring further rise to 123.85-90 first.
Our latest preferred count is that wave (ii) is ABC-X-ABC which ended at 123.33 and wave (iii) is unfolding with wave iii ended at 100.77, followed by wave iv at 111.57 and wave v as well as the wave (iii) has ended at 97.04, followed by wave (iv) at 111.43 and wave (v) has ended at 94.12 which is also the end of the larger degree v, this also implied the major wave (C) has also ended there, hence major correction has commenced from there with (A) leg unfolding in its lower degree wave c which has possibly ended at 145.69. Under this count, A-B-C wave (B) has commenced with A leg ended at 136.23, wave B at 143.79 and wave C has possibly ended at 149.79.
Our larger degree count is that the decline from 139.26 is wave (C) and is sub-divided into a diagonal triangle i-ii-iii-iv-v with wave i - 105.44, wave ii- 123.33, wave iii - 97.03, wave iv - 111.43, followed by the final wave v as well as the end of wave (C) at 94.12, this also mark the bottom of larger degree wave B. Under this count, major rise in wave C has commenced as an impulsive wave with minor wave III ended at 145.69, wave V is still in progress for further gain to 150.00. Having said that, this so-called wave V could well be the first leg of larger degree 5-waver wave C and this wave C should bring at least a retest of wave A top at 169.97 (July 2008).
Trade Idea: AUD/USD – Stand aside
AUD/USD – 0.7584
Recent wave: Wave 5 ended at 1.1081 and major correction has commenced for fall to 0.7000 and then towards 0.6500-10
Trend: Near term up
New strategy :
Stand aside
Position: -
Target: -
Stop:-
As aussie has rebounded again after finding support at 0.7540 yesterday, retaining our view that further consolidation above indicated support at 0.7491 would be seen and recovery to 0.7610-15 cannot be ruled out, however, a sustained breach above resistance at 0.7633 is needed to confirm a temporary low has been formed at 0.7491, bring stronger rebound to 0.7665-70, above there would suggest the fall from 0.7741 top has ended, then gain to 0.7700 would follow.
On the downside, below support at 0.7530-40 would suggest the rebound from 0.7491 has ended, bring retest of this level, break there would signal recent decline from 0.7741 has resumed and extend weakness to previous support at 0.7543 which is likely to hold on first testing.
On the 4-hour chart, the move from 0.8066 is the wave 5 with i: 0.8860, ii: 0.8315, wave iii is an extended move ended at 1.0183, iv: 0.9706 and wave v has ended at 1.1081 (also the top of entire wave 5). The subsequent selloff is the major correction which is unfolding as ABC-X-ABC and 2nd A leg has ended at 0.8848, followed by a-b-c wave B which ended at 0.9758, hence, 2nd C wave is now in progress and indicated downside target at 0.7000 and 0.6950 had been met, so further fall to 0.6710-20 cannot be ruled out.