
Sample Category Title
Canadian Housing Starts Strong again in February
- Housing starts inched up to 210.2k in February from an already-elevated 208.9k units in January.
The monthly increase was led by a 21.5% jump in Quebec urban starts (in large part reflecting a 21.7% jump in the multiple-unit component as a number of large condo buildings in Montreal reportedly began construction). Starts declined 14.9% in Ontario but that only retraced a portion of the outsized 74% surge over the prior two months. Starts inched higher in all other regions, including a 23.3% gain in the prairies, 14.6% increase in Atlantic Canada and a 6.8% gain in B.C. On a year-over-year basis, starts are still down sharply in B.C. but up in all other regions of the country.
Our Take:
Homebuilding has been strong to start 2017 with the third consecutive 200k+ reading in February marking the first such streak since October 2012. Although strength has been weighted to areas where housing markets have been tighter (ie. Ontario) with offset coming from areas where markets have cooled (B.C.), the aggregate level of starts nationally is nonetheless well-above most (including our own) estimates of the underlying pace of household formation. Unseasonably warm winter temperatures in much of the country probably played some role in boosting building activity over January and February and we expect recent moderation in resale activity, driven by a combination of new macro-prudential regulations and stretched affordability conditions, and a modest up-drift in lending rates will ultimately be reflected in slower homebuilding ; however, recent permit issuance (230k residential building permits were issued in January, released separately this morning, and the average over the last four months has been a whopping 238k per month) suggests that the strong pace of starts could also persist over the next couple of months.
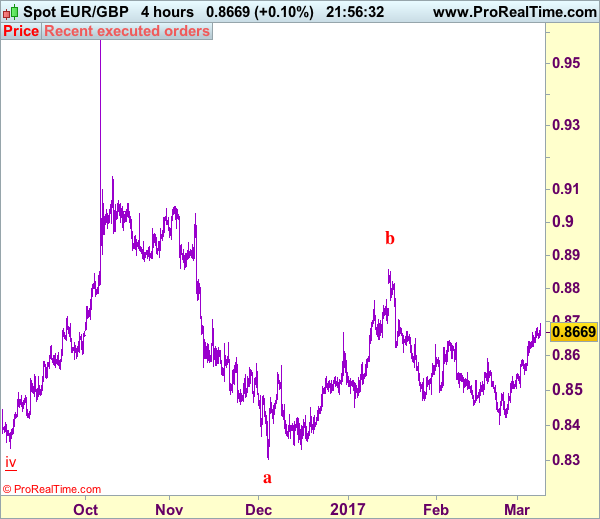
Trade Idea: EUR/GBP – Buy at 0.8600
EUR/GBP - 0.8672
Recent wave: Major double three (A)-(B)-(C)-(X)-(A)-(B)-(C) is unfolding and 2nd (A) has possibly ended at 0.6936.
Trend: Near term down
Original strategy :
Buy at 0.8600, Target: 0.8700, Stop: 0.8560
Position : -
Target : -
Stop : -
New strategy :
Buy at 0.8600, Target: 0.8700, Stop: 0.8560
Position : -
Target : -
Stop : -
As the single currency has continued trading with a firm undertone after breaking resistance at 0.8646, adding credence to our view that the fall from 0.8857 is still in progress and upside bias remains for the rally from 0.8403 low to extend gain to 0.8740-50, however, loss of near term upward momentum should prevent sharp move beyond there and price should falter well below 0.8780, risk from there is seen for a retreat to take place later.
In view of this, would not chase this rise here and we are looking to buy euro on pullback as 0.8600 should limit downside. Below support at 0.8547 would suggest first leg of rebound from 0.8403 has ended, bring weakness to 0.8520-25 but support at 0.8509 should contain downside and bring another rise later.
Our preferred count is that, after forming a major top at 0.9805 (wave V), (A)-(B)-(C) correction is unfolding with (A) leg ended at 0.8400 (A: 0.8637, B: 0.9491 and 5-waver C ended at 0.8400. Wave (B) has ended at 0.9413 and impulsive wave (C) has either ended at 0.8067 or may extend one more fall to 0.8000 before prospect of another rally. Current breach of indicated resistance at 0.9043 confirms our view that the (C) leg has ended and bring stronger rebound towards 0.9150/54, then towards 0.9240/50.
GOLD: Bearish, Declines Further
GOLD: The commodity declined further on Tuesday leaving risk of more weakness on the cards. On the downside, support comes in at the 1,210.00 level where a break will turn attention to the 1,200.00 level. Further down, a cut through here will open the door for a move lower towards the 1,190.00 level. Below here if seen could trigger further downside pressure targeting the 1,180.00 level. Its daily RSI is bearish and pointing lower supporting this view. Conversely, resistance resides at the 1,220.00 level where a break will aim at the 1,230.00 level. A turn above there will expose the 1,240.00 level. Further out, resistance stands at the 1,250.00 level. All in all, GOLD looks to weaken further.
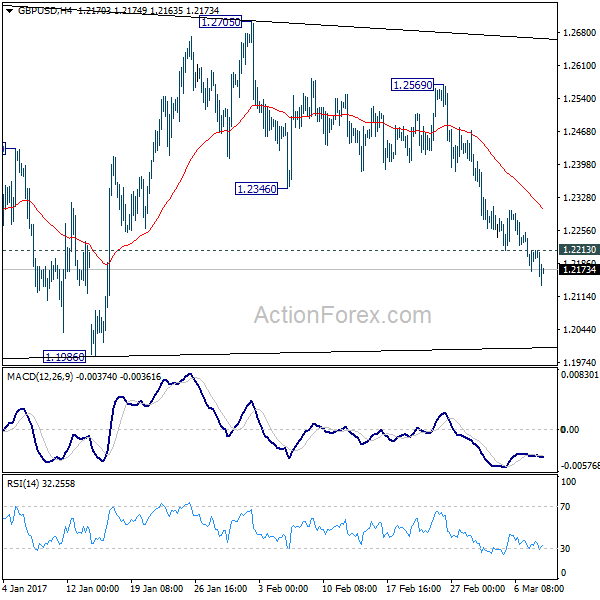
GBP/USD Mid-Day Outlook
Daily Pivots: (S1) 1.2163; (P) 1.2207; (R1) 1.2246; More...
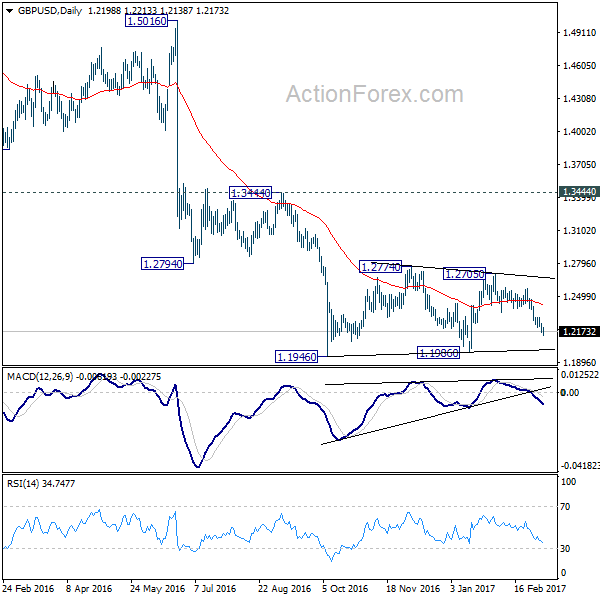
GBP/USD's fall continues today and reaches as low as 1.2138 so far today. Intraday bias remains on the downside for 1.1946/86 support zone. As noted before, consolidation pattern from 1.1946 should have completed with three waves to 1.2705 already. Break of 1.1946 will confirm our bearish view and resume the larger down trend. On the upside, above 1.2213 minor resistance will turn bias neutral and bring recovery. But outlook will remain cautiously bearish as long as 1.2346 support turned resistance holds.
In the bigger picture, fall from 1.7190 is seen as part of the down trend from 2.1161. There is no sign of medium term bottoming yet. Sustained trading below 61.8% projection of 2.1161 to 1.3503 from 1.7190 at 1.2457 will target 100% projection at 0.9532. Overall, break of 1.3444 resistance is needed to confirm medium term bottoming. Otherwise, outlook will remain bearish.
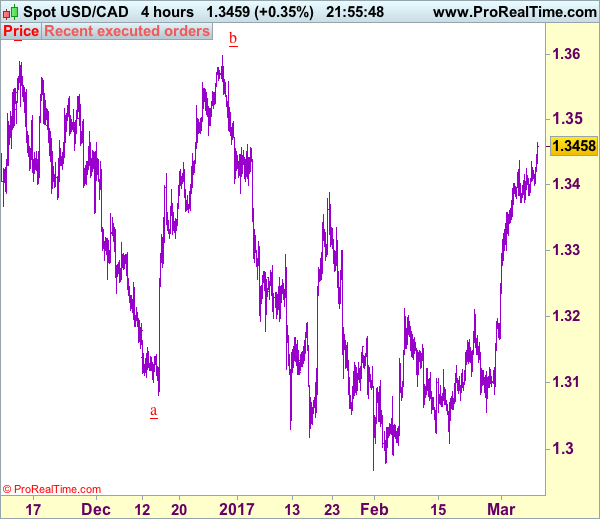
Trade Idea: USD/CAD – Buy at 1.3375
USD/CAD - 1.3460
Recent wave: Only wave v of c has ended at 0.9407 and wave C of major A-B-C correction is underway for headway to 1.4700
Trend: Near term down
Original strategy :
Buy at 1.3300, Target: 1.3450, Stop: 1.3240
Position: -
Target: -
Stop: -
New strategy :
Buy at 1.3375, Target: 1.3525, Stop: 1.3315
Position: -
Target: -
Stop:-
The greenback has surged again today, adding credence to our bullish view that recent upmove from 1.2969 low is still in progress and may extend further gain to 1.3500-10, then towards resistance at 1.3558 but loss of near term upward momentum should prevent sharp move beyond 1.3590-00, risk from there is seen for a retreat to take place later.
In view of this, would not chase this rise here and would be prudent to buy on pullback as minor support at 1.3372 should limit downside and bring another rise later. Below 1.3320-25 would defer and suggest top is possibly formed, risk correction to 1.3290-00 and possibly to 1.3250-60 but price should stay well above indicated previous resistance at 1.3212 (now support), bring another rise later.
To recap, wave B from 1.3066 is unfolding as an a-b-c and is sub-divided as a: 1.2192, b: 1.2716 and wave c is a 5-waver with i: 1.1983, ii: 1.2506, extended wave iii with minor iii at 1.0206, wave iv ended at 1.0781 and wave v as well as wave iii has ended at 0.9931, hence the subsequent choppy trading is the wave iv which is unfolding as (a)-(b)-(c) with (a) leg of iv ended at 1.0854, followed by (b) leg at 1.0108 and (c) leg as well as the wave iv ended at 1.0674. The wave v is sub-divided by minor wave (i): 0.9980, (ii): 1.0374, (iii): 0.9446, (iv): 0.9913 and (v) as well as v has possibly ended at 0.9407, therefore, consolidation with upside bias is seen for major correction, indicated target at 1.3700 and 1.4000 had been met and further gain to 1.4700 would be seen later.
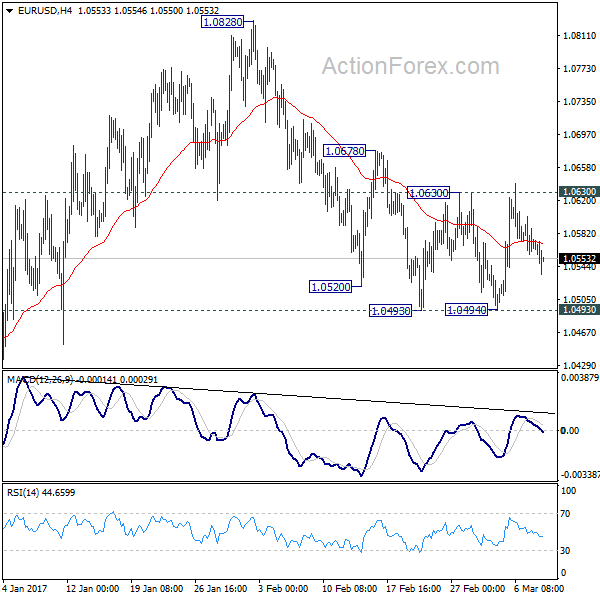
EUR/USD Mid-Day Outlook
Daily Pivots: (S1) 1.0548; (P) 1.0575 (R1) 1.0592; More.....
EUR/USD is still consolidating in range of 1.0493/1.0630. Intraday bias remains neutral at this point. On the upside, firm break of 1.0630 resistance will argue that pull back from 1.0828 is completed. Also, rise from 1.0339 could possibly be resuming. In that case, intraday bias will be turned back to the upside for 1.0828 resistance and above. On the downside, below 1.0493 support will affirm the case that fall from 1.0828 is resuming the larger down trend. In that case, intraday bias will be back to the downside for resting 1.0339 low.
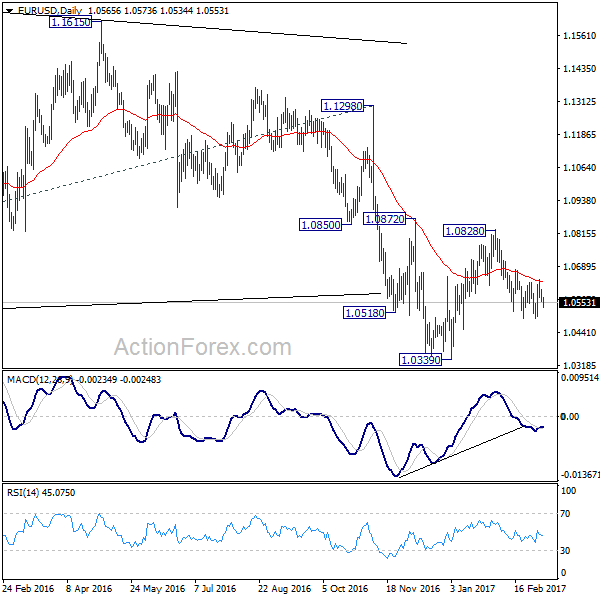
In the bigger picture, whole down trend from 1.6039 (2008 high) is in progress. Such down trend is expected to extend to 61.8% projection of 1.3993 to 1.0461 from 1.1298 at 0.9115. On the upside, break of 1.1298 resistance is needed to confirm medium term bottoming. Otherwise, outlook will stay bearish in case of rebound.
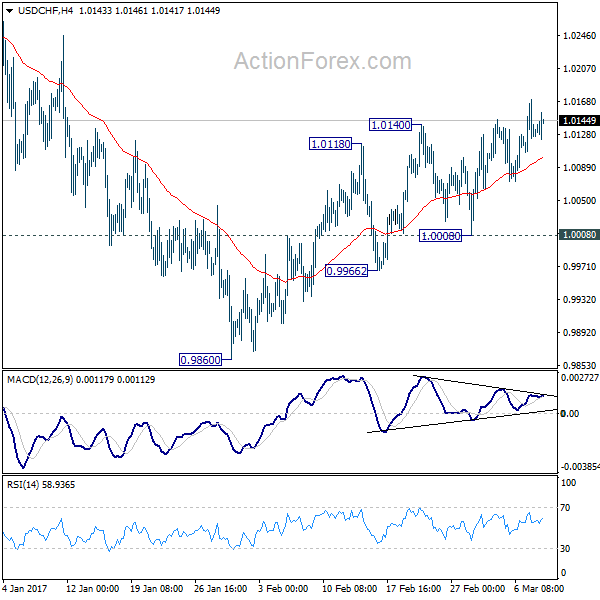
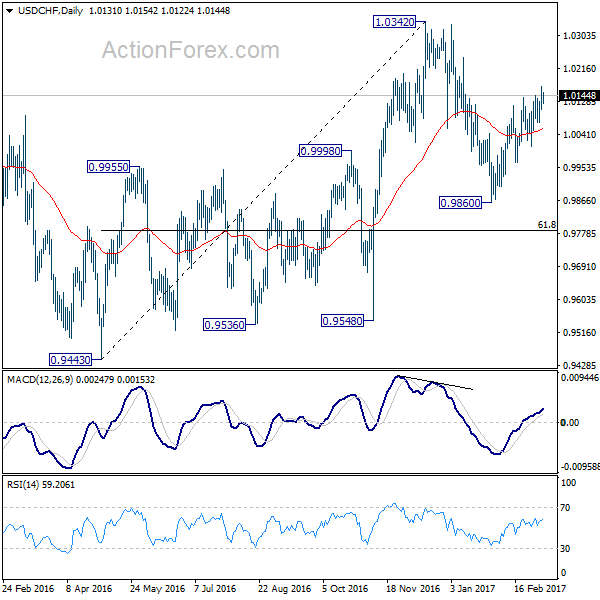
USD/CHF Mid-Day Outlook
Daily Pivots: (S1) 1.0101; (P) 1.0136; (R1) 1.0165; More.....
Intraday bias in USD/CHF remains on the upside for the moment. The rebound from 0.9860 is in progress and would target a test on 1.0342 key resistance level. As noted before, based on neutral medium term outlook, we'd be cautious on topping at around 1.0342. On the downside, break of 1.0008, however, will indicate completion of the rebound from 0.9860. And intraday bias will be turned back to the downside for 0.9860.
In the bigger picture, prior rejection from 1.0327 resistance argues that USD/CHF is staying in a medium term sideway pattern. In any case, decisive break of 1.0342 resistance is needed to confirm underlying strength. Otherwise, we'll stay neutral in the pair first. In case of another fall, we'd expect strong support from 0.9443/9548 support zone. Meanwhile firm break of 1.0342 will target 38.2% retracement of 1.8305 to 0.7065 at 1.1359.
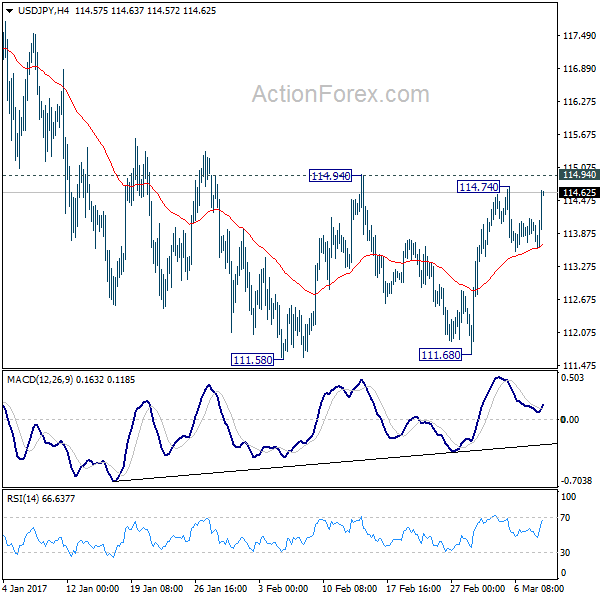
USD/JPY Mid-Day Outlook
Daily Pivots: (S1) 113.75; (P) 113.95; (R1) 114.18; More...
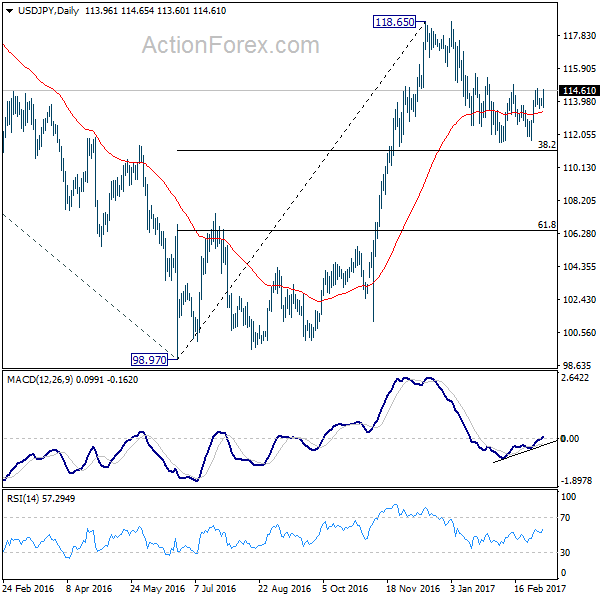
USD/JPY rebounds strongly after drawing support from 4 hour 55 EMA but it's staying below 114.94 resistance. Intraday bias remains neutral first. On the upside, decisive break of 114.94 resistance should confirm completion of the corrective pull back from 118.65. This would be supported by a double bottom pattern (111.58, 111.68). In such case, intraday bias will be turned to the upside for retesting 118.65. In case of another decline, we'd still expect strong support from 38.2% retracement of 98.97 to 118.65 at 111.13 to contain downside and bring rebound.
In the bigger picture, price actions from 125.85 high are seen as a corrective pattern. The impulsive structure of the rise from 98.97 suggests that the correction is completed and larger up trend is resuming. Decisive break of 125.85 will confirm and target 61.8% projection of 75.56 to 125.85 from 98.97 at 130.04 and then 135.20 long term resistance. Rejection from 125.85 and below will extend the consolidation with another falling leg before up trend resumption.
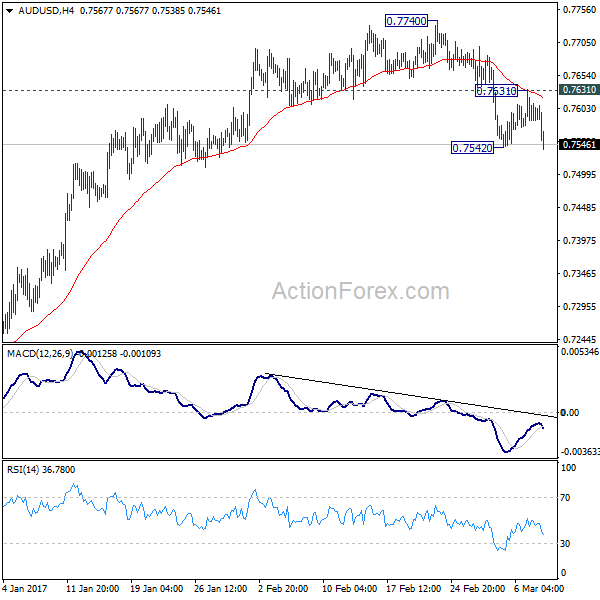
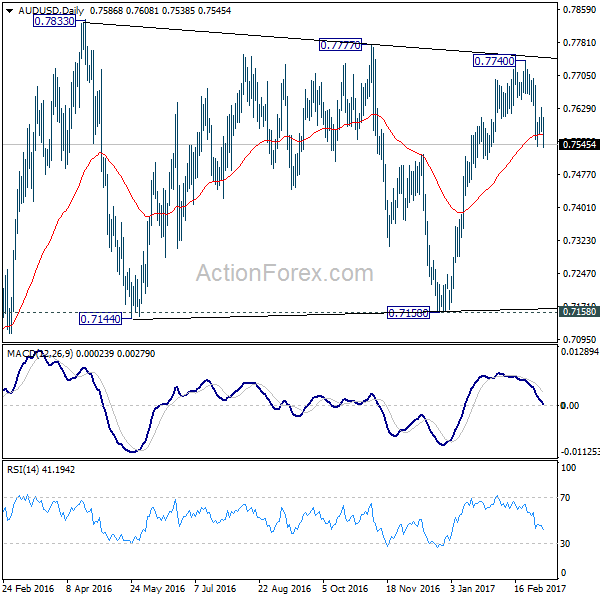
AUD/USD Mid-Day Outlook
Daily Pivots: (S1) 0.7563; (P) 0.7598; (R1) 0.7620; More...
Breach of 0.7542 temporary low suggests that fall from 0.7740 is resuming. Intraday bias in AUD/USD is turned back to the downside. As noted before, rebound from 0.7158 is finished at 0.7740. Sustained trading below 55 day EMA will pave the way back to 0.7144/7158 support zone. However, on the upside, break of 0.7631 minor resistance will dampen our bearish view and turn focus back to 0.7740 high instead.
In the bigger picture, we're still treating price actions from 0.6826 low as a correction. And, as long as 38.2% retracement of 0.9504 to 0.6826 at 0.7849 holds, long term down trend from 1.1079 is expected to resume sooner or later. Break of 0.6826 low will target 0.6008 key support level. However, firm break of 0.7849 will indicate that rise from 0.6826 is developing into a medium term rebound, rather than a sideway pattern. In such case, stronger rise should be seek to 55 month EMA (now at 0.8164) and above.
USD/CAD Hits 9-Week Highs Despite Strong Canadian Construction Data
USD/CAD continues to strengthen in the Wednesday session. Early in North American trade, the pair is trading at 1.3440. On the release front, it's a busy day in Canada. Housing Starts improved to 210 thousand, above the estimate of 207 thousand. Building Permits posted a strong gain of 5.4%, beating the forecast of 3.1%. Finally, Labor Productivity, a quarterly release, posted a gain of 0.4% in the first quarter. This matched the forecast. In the US, ADP Nonfarm Employment Change soared to 298 thousand, well above the estimate of 184 thousand. On Thursday, the US releases unemployment claims, with the indicator expected to rise to 239 thousand.
Canada's employment market has improved in recent months, buoyed by strong employment gains. The economy added 48.3 thousand jobs and 53.7 thousand jobs in December and January respectively. This surprised the markets, which had predicted declines for each reading. The unemployment rate has also improved, dropping to 6.8%. A strong US economy has been good news for Canada, which is heavily dependent on its southern neighbor. At the same time, speculation of an imminent rate hike by the Fed has boosted the US dollar, which has jumped 2.5% against the Canadian currency since the end of February.
Donald Trump and his new administration continues to create controversy on an almost basis, much to the consternation of the markets. Still, the dollar hasn't skipped a beat and remains at high levels against its major rivals, including the euro. The dollar has benefited from a strong economy and the increasing likelihood of a rate hike at the upcoming Fed policy meeting on March 15. The likelihood of a March hike has jumped to 84%, according to the CME group, compared to 33% just a week ago. We'll get a look at US Nonfarm Payrolls on Friday, which is expected to soften to 185 thousand. If the indicator beats expectations, the greenback rally could continue and increase the odds of a March rate hike.