
Sample Category Title
EUR/JPY Daily Outlook
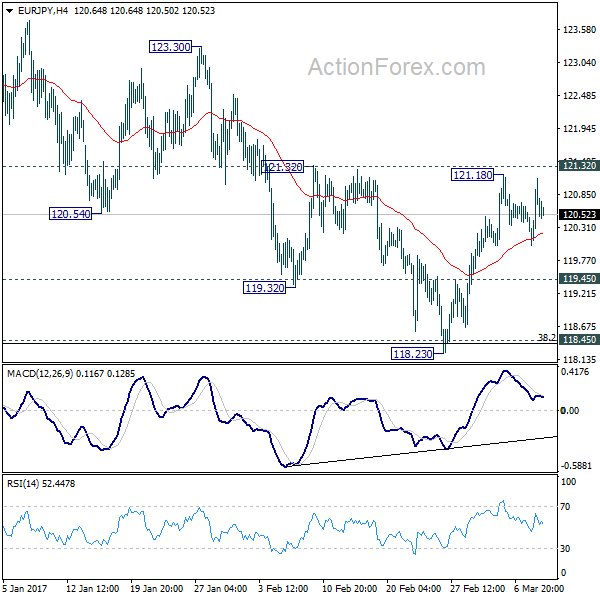
Daily Pivots: (S1) 120.01; (P) 120.56; (R1) 121.11; More...
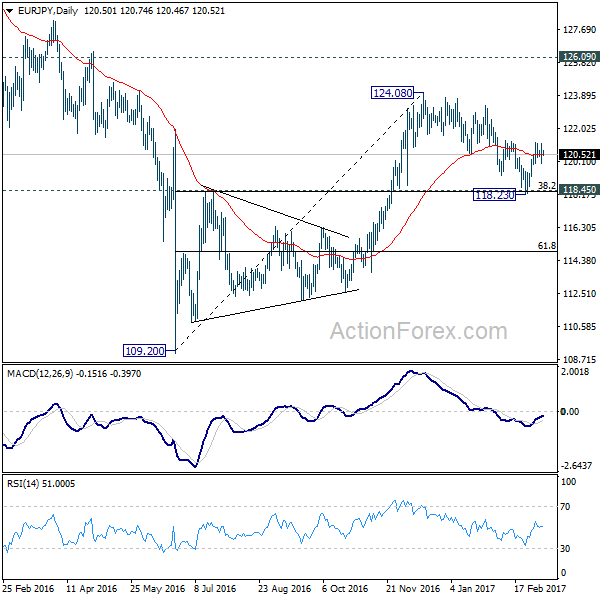
EUR/JPY is staying in consolidation below 121.18 temporary top. Intraday bias remains neutral at this point. As noted before, corrective fall from 124.08 has completed at 118.23 already, after defending 118.45 cluster support (38.2% retracement of 109.20 to 124.08 at 118.39). Thus, further rise is in favor. On the upside, decisive break of 121.32 resistance should confirm this case and target 124.08 high next. However, break of 119.45 support should invalidate this bullish view and would likely extend the fall from 124.08 through 118.23.
In the bigger picture, price actions from 109.20 medium term bottom are seen as part of a medium term corrective pattern from 149.76. Strong rebound from 118.45 resistance turned support suggests that it's still in progress. Break of 124.08 will target 126.09 key resistance level. We'd be cautious on strong resistance there to limit upside. However, sustained break there will be a strong sign of medium term momentum and could target 141.04 resistance next.
EUR/CHF Daily Outlook
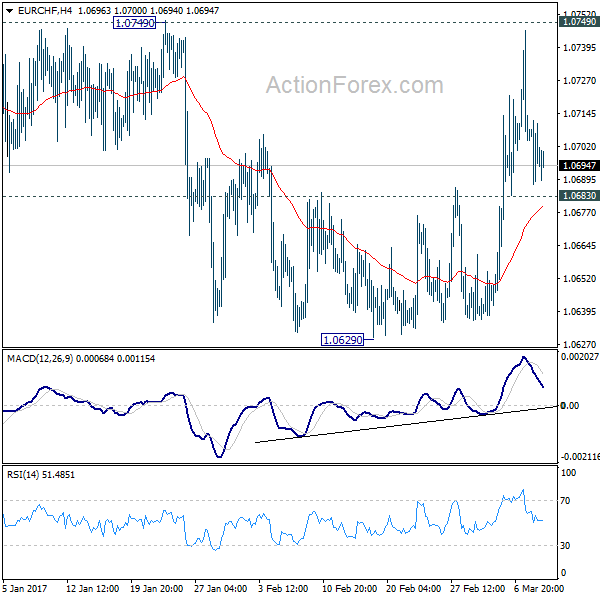
Daily Pivots: (S1) 1.0685; (P) 1.0699; (R1) 1.0709; More...
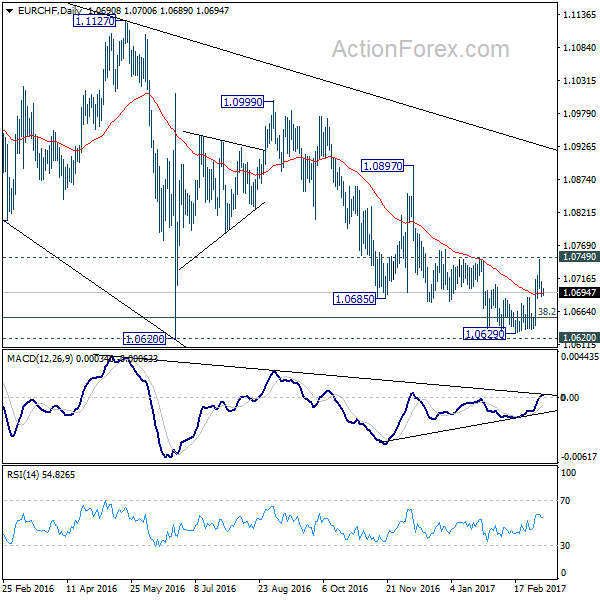
Intraday bias in EUR/CHF is turned neutral as it failed to break through 1.0749 resistance. Nonetheless, with 1.0683 minor support intact, further rise is expected. As noted before, a short term bottom is likely in place at 1.0629 on bullish convergence condition in 4 hour MACD. Current development raised the chance of larger trend reversal after defending 1.0620 key support level. Decisive break of 1.0749 should affirm this bullish case and target 1.0897. On the downside, though, below 1.0683 minor support will turn bias back to the downside for 1.0629 instead.
In the bigger picture, the decline from 1.1198 is seen as a corrective move. There is no confirmation of completion yet. Sustained trading below 38.2% retracement of 0.9771 to 1.1198 at 1.0653 will target 50% retracement at 1.0485. However, strong rebound from 1.0620 and break of 1.0897 resistance will indicate trend reversal and turn outlook bullish.
EUR/GBP Daily Outlook
Daily Pivots: (S1) 0.8645; (P) 0.8670; (R1) 0.8686; More...
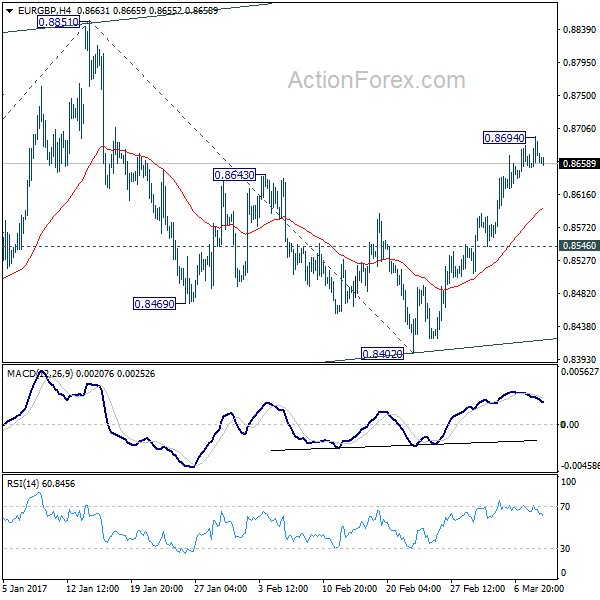
EUR/GBP continues to lost upside moment after hitting 0.8694 and intraday bias is turned neutral first. Downside of retreat should be contained by 0.8546 support and bring another rise. As noted before, rise from 0.8402 is viewed as the third leg of the corrective price actions from 0.8303.Such rally would target 0.8851 resistance and above. However, whole price actions from 0.8303 are viewed as the second leg of the correction from 0.9304. Hence, we'd expect strong resistance from 100% projection of 0.8303 to 0.8851 from 0.8402 at 0.8950 to limit upside. On the downside, below 0.8546 minor support will turn bias back to the downside for 0.8402 support instead.
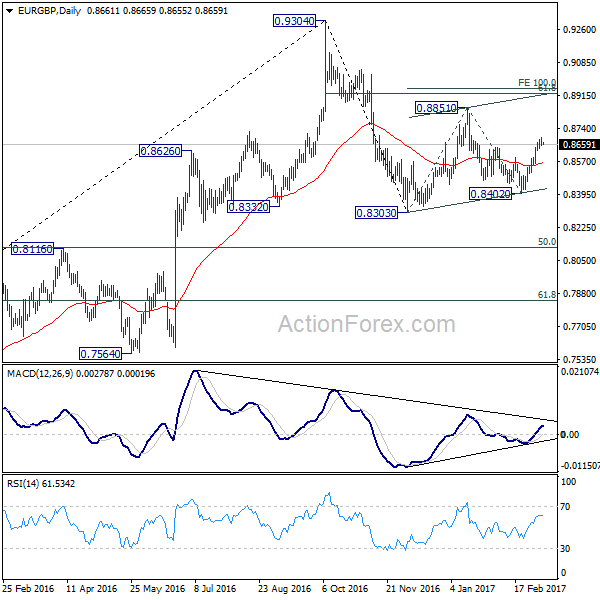
In the bigger picture, price actions from 0.9304 are viewed as a medium term corrective pattern. Deeper fall cannot be ruled out yet. But we'd expect strong support from 0.8116 cluster support (50% retracement of 0.6935 to 0.9304 at 0.8120) to contain downside. Overall, the corrective pattern would take some time to complete before long term up trend resumes at a later stage. Break of 0.9304 will pave the way to 0.9799 (2008 high).
EUR/AUD Daily Outlook
Daily Pivots: (S1) 1.3921; (P) 1.3965; (R1) 1.4047; More...
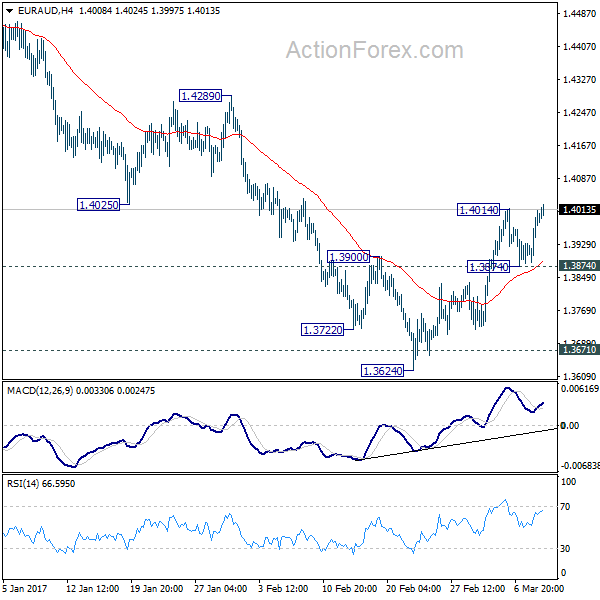
Breach of 1.4014 temporary top suggests that pull back has completed at 1.3874, ahead of 1.3835 support. Intraday bias in EUR/AUD is turned back to the upside for 1.4289 resistance next. Current development, with a short term bottom formed at 1.3624, is taking as an early sign of larger trend reversal after defending 1.3671 key support. Break of 1.4289 will confirm this case and target 1.4721 resistance next. However, break of 1.3874 minor support will dampen our bullish view and turn bias back to the downside for 1.3624 instead.
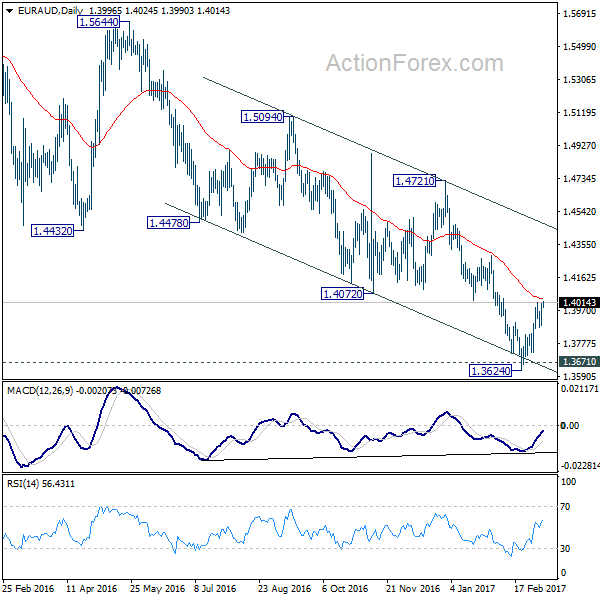
In the bigger picture, price actions from 1.6587 medium term top are viewed as a corrective pattern. We'd expect strong support from 1.3671 key level to contain downside and bring rebound. Up trend from 1.1602 should not be finished and will resume later. Break of 1.4721 resistance will indicate completion of such correction and turn outlook bullish for retesting 1.6587 high. However, sustained break of 1.3671 will invalidate our bullish view and would turn focus back to 1.1602 long term bottom.
Euro Mixed as Markets Await ECB, Economic Projections Watched
Euro trades mixed as markets await ECB rate decision and press conference. The common currency trades in red against Dollar but weakness is limited so far. EUR/USD is bounded in range of 1.0493/0630 without a clear near term direction yet. ECB is widely expected to keep policies unchanged even though headline inflation finally hit the 2% target for the first time since 2013. Political uncertainties in Eurozone will keep policymakers' hands tight. And the uncertainties include elections in France, the Netherlands and Germany. Also, the deal with UK on Brexit is basically unknown at this point.
ECB projections watched closely
Nonetheless, there are still a few points to note at president Mario Draghi's press conference. In particular, ECB will release new staff projections for inflation and growth. Back in December, ECB projected inflation to hit 1.3% in 2017, 1.5% in 2018 and 1.7% in 2019. GDP is projected to be 1.7% in 2017, 1.6% in 2018 and 1.6% in 2019. Inflation forecast for 2017 will most likely be revised up and some economists that ECB could now estimate 1.6%. The key is the revision for 2018 and 2019 which would shape the policy path ahead, after passing most political uncertainties. Euro could react positively if the new projections paint a more confident picture on inflation outlook.
UK revised up economic forecasts, Sterling indifferent
UK Chancellor of Exchequer Philip Hammond delivered his first full budget statement yesterday. To summarize some of the key points, UK GDP is projected to grow at 2.0% in 2017, up from prior projection of 1.4%. 2018 GDP growth is expected to slow to 1.6% before climbing up to 1.7% in 2019. Inflation is expected to peak at 2.4% in 2017 then fall back to 2.3% in 2018 and 2% in 2019. That would likely keep BoE's hands tight.
The government would borrow GBP 51.7b this year, GBP 16.4b lower than forecast. For 2017-18, borrowing will rise to GBP 58.3b and then drop to GBP 40.6b in 2018/19. Regarding Brexit, Hammond said that "As we start our negotiations to exit the European Union, this budget takes forward our plan to prepare Britain for a brighter future; it provides a strong and stable platform for those negotiations." Sterling's reaction to the budget was muted.
10 year yield jumped with hesitations
In US, expectations for a rate hike by Fed next week continued to build up, and was solidified further after yesterday's strong ADP employment data. Fed fund futures are pricing in 90.8% chance of a March hike. Such expectations provided a list to Dollar and yields while stocks extended their retreat.
10 year yield opened at 2.567 hit as high as 2.583 over night before closing at 2.552. The break of near term trend line resistance is seen as a sign of momentum. However, the close below open after a strong intraday surge indicates some hesitation in the markets. We maintain our view that price actions from 2.621 are a consolidation pattern. Strong break of 2.621 is needed to confirm resumption of up trend from 1.336. Otherwise, the consolidation could extend.
On the data front...
Japan labor cash earnings rose 0.5% yoy in January. China CPI dropped sharply to 0.8% yoy in February. PPI rose to 7.8% yoy. UK RICS house price balance was unchanged at 24. Swiss unemployment rate will be featured in European session. US will release Challenger job cuts, import price index and jobless claims. Canada will release capacity utilization and new housing price index.
EUR/AUD Daily Outlook
Daily Pivots: (S1) 1.3921; (P) 1.3965; (R1) 1.4047; More...
Breach of 1.4014 temporary top suggests that pull back has completed at 1.3874, ahead of 1.3835 support. Intraday bias in EUR/AUD is turned back to the upside for 1.4289 resistance next. Current development, with a short term bottom formed at 1.3624, is taking as an early sign of larger trend reversal after defending 1.3671 key support. Break of 1.4289 will confirm this case and target 1.4721 resistance next. However, break of 1.3874 minor support will dampen our bullish view and turn bias back to the downside for 1.3624 instead.
In the bigger picture, price actions from 1.6587 medium term top are viewed as a corrective pattern. We'd expect strong support from 1.3671 key level to contain downside and bring rebound. Up trend from 1.1602 should not be finished and will resume later. Break of 1.4721 resistance will indicate completion of such correction and turn outlook bullish for retesting 1.6587 high. However, sustained break of 1.3671 will invalidate our bullish view and would turn focus back to 1.1602 long term bottom.
Economic Indicators Update
| GMT | Ccy | Events | Actual | Forecast | Previous | Revised |
|---|---|---|---|---|---|---|
| 00:00 | JPY | Labor Cash Earnings Y/Y Jan | 0.50% | 0.30% | 0.10% | 0.50% |
| 00:01 | GBP | RICS House Price Balance Feb | 24% | 23% | 25% | 24% |
| 01:30 | CNY | CPI Y/Y Feb | 0.80% | 1.80% | 2.50% | |
| 01:30 | CNY | PPI Y/Y Feb | 7.80% | 7.50% | 6.90% | |
| 06:00 | JPY | Machine Tool Orders Y/Y Feb P | 3.50% | |||
| 06:45 | CHF | Unemployment Rate Feb | 3.30% | 3.30% | ||
| 12:30 | USD | Challenger Job Cuts Y/Y Feb | -38.80% | |||
| 12:45 | EUR | ECB Rate Decision | 0.00% | 0.00% | ||
| 13:30 | CAD | Capacity Utilization Rate Q4 | 81.90% | |||
| 13:30 | CAD | New Housing Price Index M/M Jan | 0.10% | |||
| 13:30 | USD | Import Price Index M/M Feb | 0.10% | 0.40% | ||
| 13:30 | USD | Initial Jobless Claims (MAR 04) | 237k | 223k | ||
| 15:30 | USD | Natural Gas Storage | 7B |
Market Morning Briefing
STOCKS
Equities are mixed. Dow, Shanghai and Nifty could trade lower in the near term while Dax and Nikkei looks bullish.
Dow (20855.73, -0.33%) is in the correction phase and could possibly extend towards 20750-20700 levels before bouncing back from there. In case 20700 breaks on the downside, we will have to be ready to see some more fall in the medium term towards 20500. But while 20700 holds, we remain bullish.
Dax (11967.31, +0.01%) looks bullish for the near term. Immediate support seen near 11920 which if holds could take it higher towards 12100-12200; else a fall towards 11800 is possible before a sharp bounce is seen. Watch price action near current levels.
Looking at the sharp rise in the US-Japan 10yr yield spread (Refer Interest Rates section below), we could possibly expect a rise in Dollar-Yen which could pull up Nikkei (19283.10, +0.15%) to higher levels of 19400-19600. Nikkei is trading low and could re-test levels near 19000 before bouncing back from there towards 19400-19600 levels again. In that case the 21-MA seen on the 3-day line charts could act as a good support just now.
Shanghai (3214.32, -0.81%) could be heading towards immediate resistance near 3250 and may not break above 3250 just now (we may negate the higher levels of 3275 that was mentioned yesterday). A small corrective dip from 3250 looks more likely just now.
Looking at the big sharp fall in Brent Crude (see commodities section below) and expecting some weakness in the Indian Rupee, there could be some fall in Nifty (8924.30, -0.25%) too today. A fall towards 8800 is likely within the next couple of sessions. That makes the resistance near 8970-9000 more stronger just now and could hold for some more time.
COMMODITIES
Gold (1206) has shifted into a new bearish trading zone of 1128-1226. We will remain bearish while it is trading below 1226. Today's ECB press conference at 7.00 pm IST could influence the price.
Silver (17.25) is also trading below 17.45. A new trading band has been formed between 15.70-17.75. Bias will remain bearish while it is trading below 17.75.
Copper (2.60) is hovering around its crucial support of 2.60. A close below that could open up 2.53. We think the downward momentum has weakened a bit and copper may consolidate between 2.55-2.60 for few more day before its next upward rally. We have US unemployment claims at 7:00 pm IST, which may add some more clarity.
We have clearly mentioned that any increase in US crude inventory would be bearish for Brent (53.48)and WTI(50.58). Yesterday, the inventory was 8.2M barrel plus and Brent and WTI both has fallen almost 5%. Next level of support for brent are at 51.35 and 48.87 and for WTI 48.90 and 46.35 respectively.
FOREX
Possibly, the market is going Short Euro (1.0537) into the ECB Meeting as it approaches the lower end of oura range 1.0500-1.0630. We note that the EURUSD is responding a little more to the German-US 10 Yr Spread than to the German-US 2 Yr Spread. The chances of a bottom in the Spreads and hence, in Euro can’t be ruled out in the near term but the meet should be the immediate trend decider. (Check the Interest Rates section)
The Dollar Index (102.15) broke above the minor resistance of 102.00 sooner than expected on the back of very strong private sector employment data. It remains to be seen if it manages to rise and sustain above 102.30, which will enable it to rise further towards 102.70-103.00 in the next few sessions.
Dollar-Yen (114.44) remains stable in the range of 113-115 just as expected and the overnight rise from 113.60 to 114.80 remains just an oscillation inside the said range. The range is expected to remain unchanged for the rest of the week.
Pound (1.2167) trades just above the interim support of 1.2150 so far but the major downtrend remains strong and it is not clear if the expected consolidation in 1.2150-1.2300 will take place or the decline will continue towards 1.20 levels.
Aussie (0.7518) has come down from 0.7630 levels as expected but the volatility hasn’t come down as thought previously. A break below 0.75 can open up lower targets of 0.7350-00 levels in the near term.
Dollar-Rupee (66.70) is trading at 66.80 in the NDF market. Support comes at 66.60-50 and resistance at 66.95. Bias turning neutral from strong bearish and prefer to play the range till a breakout on the upside which may come soon, within the next 1-3 trading sessions.
INTEREST RATES
Going into the ECB Meeting today, the German Yield Curve (German 10-2 Yr spread, 1.229%) is steeper than the US Yield Curve (US 10-2 Yr spread, 1.21%). If this were to correct, it would imply that the German near-end may rise more than the US near-end. If so, the German-US 2 Yr Spread could try and find a bottom.
The US 5Yr (2.10%), 10YR (2.56%) and the 30Yr (3.15%) are trading higher than previous levels of 2.07%, 2.54% and 3.14% respectively and may continue to rise for the next 2-3 sessions.
The US-UK 10Yr (-1.35%) and the Pound are moving closely and looks bearish for the near term. This may indicate that the Pound may soon target levels of 1.21-1.20.
Looking at the sharp rise in the US-Japan 10YR (2.48%), we could possibly see a rise in Nikkei and Dollar-Yen in the near term. But that could be short lived as there is resistance on the 10YR spread near 2.52/53% levels from where a fall may be expected in the medium term.
Foreign Exchange Market Commentary
EUR/USD
The American dollar stands victorious against all of its major rivals, underpinned by the release of a much better-than-expected ADP report. According to the US survey, the private sector in the country added 298,000 new jobs during February, anticipating a strong Nonfarm Payroll report what in turn will raise odds of a Fed's hike next week. Also, the ADP January reading was revised from 246K to 261K, whilst the unit labor cost during the last quarter of 2016 came in at 1.7%, beating expectations of 1.6%, and nonfarm productivity also remained unchanged at 1.3%, missing expectations of 1.6%.
Attention anyway, now shifted towards the ECB monetary policy meeting that will take place this Thursday. The Central Bank is largely expected to keep its bond buying program and rates at current levels, but Draghi's words are expected to be more optimistic, reflecting the economic growth seen in the region ever since late 2016. The ECB is also expected to upgrade is growth and inflation forecast, although for the latest, revisions will likely be shallow. Unless Draghi announces the intention of rising rates from current negative levels, or tightening the easing programs, euro gains will likely be short-lived, should it gain on hawkish words.
From a technical point of view, the risk is clearly towards the downside, as in the 4 hours chart the price stands comfortable below 1.0565, a major Fibonacci resistance, while the 20 SMA has lost its bullish strength, now turning lower and converging with the 100 SMA in the 1.0590 region. Also, the Momentum indicator in the mentioned chart turned flat within negative territory, whilst the RSI indicator continues heading lower, reaching fresh 2-week lows at 40. Much of Thursday's direction will depend on Draghi's announcements, but in the case of a sudden recovery, the most that the pair can advance is up to 1.0700/20, where selling interest is aligned.
Support levels: 1.0520 1.0490 1.0440
Resistance levels: 1.0565 1.0600 1.0635
USD/JPY
The USD/JPY pair advanced up to 114.74 this Wednesday, paring gains at the so far monthly high, to settle around 114.50 at the end of the day, unable to confirm a break of a major Fibonacci resistance. The advance took place ahead of the release of the US ADP report, with many suspecting some leak in the middle. Nevertheless, the private employment survey fueled the pair's advance, also underpinned by a sharp recovery in US Treasury yields. The rate-sensitive 2-year yield jumped to 1.36%, its highest since August 2009, on speculation the upcoming US Nonfarm Payroll report will be strong enough to back a Fed's hike as soon as next week. The pair could extend its consolidation around current levels during the next session, ahead of the ECB meeting and the US employment report, this last, with more chances of affecting it. The price is hovering around the 23.6% retracement of the late 2016 rally, having been unable to settle above it since late January. In the 4 hours chart, the price is well above its moving averages that anyway remain directionless, whilst technical indicators are retreating modestly within positive territory, not enough to suggest an upcoming downward move. At this point, the pair needs to extend beyond 114.95, February 15th high to confirm additional gains ahead.
Support levels: 114.15 113.70 113.20
Resistance levels: 114.95 115.30 115.80
GBP/USD
The GBP/USD pair extended its weekly decline to a fresh 7-week low of 1.2138, undermined by broad dollar's strength and the latest parliamentary decision regarding the Brexit, as late Tuesday, the House of Lords approved an amendment giving the Parliament a saying over the final Brexit deal. The government has quickly responded that they are not willing to let assembly frustrate the EU exit process, and hopes that the amendments will be reversed next week, when the bill will return to the House of Commons. The pair ends the day not far from the mentioned low, and remains at risk of falling further, given that the price is developing well below a firmly bearish 20 SMA in the 4 hours chart, with approaches to the indicator being quickly rejected and resulting in lower lows. In the same time frame, the RSI indicator has failed to correct higher and turned back south around 29, while the Momentum indicator heads nowhere well below its 100 level, reflecting the consolidation seen during the American session.
Support levels: 1.2130 1.2085 1.2040
Resistance levels: 1.2180 1.2220 1.2260
GOLD
Spot gold fell to $1,206.55 a troy ounce, its lowest in five weeks, to close the day around $1,209.60. News that the US private sector added far more jobs than expected last month reinforcing the case of a rate hike next week. The commodity has now retraced the 38.2% of the December/February recovery, and remains biased lower according to technical readings, with the next relevant support at 1,197.80, the 100 DMA. In the daily chart, technical indicators present sharp bearish slopes within negative territory, supporting a continued slide on a break below the mentioned daily low. In the shorter term, and according to the 4 hours chart, the bright metal is also biased lower, as the price stands now far below a bearish 20 SMA that has crossed below the 100 and 200 SMAs, whilst technical indicators consolidate within oversold readings, with no certain directional strength.
Support levels: 1,206.55 1,197.80 1,188.20
Resistance levels: 1,214.20 1,221.70 1,230.00
WTI CRUDE
West Texas Intermediate crude oil futures plunged to 50.04, the lowest in three months, ending the day around $50.20 a barrel. The commodity plunged this Wednesday after the EIA reported the ninth consecutive weekly advance that drove inventories to record highs. The US added 8.2 million barrels last week, lifting total commercial inventories to a record level of 528.4 million. News that oil production from Waha Oil Co, in Libya could be interrupted due to clashes in the country have barely affected oil. The bearish breakout of this year's range has exacerbated the slide, and technical readings in the daily chart support some additional slides, as the price has broken below its 100 DMA for the first time since late November, whilst technical indicators present sharp bearish slopes within negative territory. In the 4 hours chart, technical indicators head south pretty much vertically in extreme oversold territory, overreacting to the decline amid the preceding tight range. The decline stalled at the critical psychological support of 50.00, and large stops should lie below the level, which means that if those got triggered, the bearish movement will likely continue.
Support levels: 49.60 48.85 48.20
Resistance levels: 50.80 51.50 52.20
DJIA
Wall Street closed mixed, with the Dow Jones Industrial Average down 69 points, to 20.855.73 and the S&P ending the day at 2,362.98, 5 points lower, but the Nasdaq Composite up 3 points, to 5,837.55. Energy-related equities led the decline as oil prices plunged, offsetting gains in the financial sector. Within the Dow, Caterpillar was the worst performer, down 3.00%, followed by Chevron that shed 2.13% and Exxon Mobil that closed 1.78% lower. Wal-Mart led advancers, adding 0.81%, although just 8 out of 30 components closed in the green. The Dow daily chart shows that it stands some points above bullish moving averages, but near the 20 DMA, currently at 20,792, an immediate dynamic support. The Momentum indicator extended its decline within bullish territory, while the RSI also heads lower, now around 63, leaving overbought territory, all of which supports some additional declines, particularly on a break below the mentioned SMA. In the shorter term, and according to the 4 hours chart, the index presents an increasing bearish potential, as the 20 SMA continued to cap the upside, whilst technical indicators remain within negative territory, with modest bearish slopes amid limited intraday volume, but with no signs of changing course in the near term.
Support levels: 20,833 20,794 20,738
Resistance levels: 20,899 20,950 21,017
FTSE 100
The FTSE 100 lost 4 points this Wednesday, ending the day at 7,334.61. Local shares were unable to attract buying interest, despite UK Treasury chief Philip Hammond outlined the budget, focused on boosting infrastructure spending. Construction and material-related equities outperformed, while financials recovered some of the ground lost earlier this week, although gains were offset by a strong decline in the mining-related sector. Worldpay Group was the best performer, advancing 4.84%, while Randgold Resources topped losers' list, shedding 2.30%. The index pared losses a few points away from its 20 DMA, this last at 7,306 for this Thursday, whilst the Momentum indicator remains lifeless around its 100 level and the RSI indicator continues retreating from overbought levels within positive territory. Shorter term, the 4 hours chart shows that technical indicators resumed their declines within bearish territory, whilst the index held below a bearish 20 SMA, maintaining the risk towards the downside in the short term.
Support levels: 7,306 7,265 7,238
Resistance levels: 7,345 7,397 7,420
DAX
European equities advanced at the beginning of the day, but ease from their highs into the close, ending the session pretty much flat. The German DAX closed 1 point higher at 11,967.31, with sentiment undermined by Chinese trade balance data, showing the first monthly trade deficit in over three years. Within the DAX, Adidas was the best performer, adding 9.03% after the company projected a revenue growth between 11% and 13% and net income growth of up to 20% for this 2017. Banks recovered from the recent setback, with Commerzbank adding 0.99% and Deutsche Bank closing 0.56% higher. In the daily chart, the index remains above a bullish 20 DMA, currently at 11,877, while technical indicators remain flat, but within positive territory. In the 4 hours chart, the index was unable to recover above a bearish 20 SMA, whilst the Momentum indicator remains neutral and the RSI indicator turned lower around 46, limiting chances of a stronger recovery as long as the index remains below 12,000.
Support levels: 11,920 11,877 11,832
Resistance levels: 12,001 12,053 12,100
Daily Technical Analysis
EURUSD
The EURUSD had another insignificant movement yesterday but keeps making lower highs and lows on daily chart since Monday. The bias is neutral in nearest term probably with a little bearish bias testing the lower line of the bearish channel and 1.0450 support area which is a good place to buy with a tight stop loss. Immediate resistance is seen around 1.0570. A clear break above that area could trigger further bullish pressure testing the upper line of the bearish channel and 1.0630 area which is a good place to sell. Fundamental focus will be on the ECB press conference. Overall I remain neutral.
GBPUSD
The GBPUSD continued its bearish momentum yesterday bottomed at 1.2138. Price keeps making lower highs and lows since Monday as you can see on my daily chart below with key resistance is seen at 1.2300 region challenging 1.2000 key support. The bias is bearish in nearest term testing 1.2100 – 1.2080 region. Immediate resistance is seen around 1.2215. A clear break above that area could lead price to neutral zone in nearest term testing 1.2300 area. Overall I remain neutral.
USDJPY
The USDJPY had a moderate bullish momentum yesterday topped at 114.75. The bias is bullish in nearest term testing 115.60 region which remains a good place to sell. Immediate support is seen around 114.20. A clear break below that area could lead price to neutral zone in nearest term testing 113.50 region. As long as stay below 115.60 I still prefer a bearish scenario and any upside pullback should be seen as a good opportunity to sell.
USDCHF
The USDCHF didn’t make significant movement yesterday. The bias remains neutral in nearest term. Immediate support is seen around the lower line of the bullish channel and 1.0070 area which is a good place to buy with a tight stop loss as a clear break below the bullish channel would end the current bullish phase testing 1.0000 region or lower. On the upside, 1.0200 remains a key resistance and good place to sell with a tight stop loss. Overall I remain neutral.
GOLD – Bearish, Declines Further
GOLD - The commodity declined further on Tuesday leaving risk of more weakness on the cards. On the downside, support comes in at the 1,210.00 level where a break will turn attention to the 1,200.00 level. Further down, a cut through here will open the door for a move lower towards the 1,190.00 level. Below here if seen could trigger further downside pressure targeting the 1,180.00 level. Its daily RSI is bearish and pointing lower supporting this view. Conversely, resistance resides at the 1,220.00 level where a break will aim at the 1,230.00 level. A turn above there will expose the 1,240.00 level. Further out, resistance stands at the 1,250.00 level. All in all, GOLD looks to weaken further.
US Bond Yields Rip
US Bond Yields Rip
Bond yields surged after a strong ADP report which surprised to the upside, reporting a 298k gain in private payrolls in February. On cue, the USD jumped across the board. Oil prices, on the other hand, slid on gushing US crude oil inventories, which printed another record today, representing an upsurge of 8.2 million barrels over last week's print.
Overnight, the US dollar hesitated on the initial move made on US Treasuries earlier in the week, and with a stellar ADP pointing the way to a strong NFP on Friday, US dollar bulls went on the offensive as surging US Bond Yields put the USD back in vogue.
Australian Dollar
The AUD got smacked with the ugly stick in the lead up to the ADP report, due to weaker than expected Chinese trade data and it's damaging effects on the global growth story line and commodity prices.
The 3 C's (commodity prices, carry trade and China) have turned to negative, and as such, the near-term outlook for the Aussie dollar is pivoting south. I expect the markets to re-engage short AUDUSD positions after the break of the .7550 level and I also expect any near-term rallies to be faded.
Storm clouds are building on the AUD horizon, and according to my weather map, a perfect storm is developing, more so with US yields looking poised to make higher highs.
Commodities
In the broader equity markets, lower commodity prices weighed on the shares of energy and mining companies, offsetting any gains for the financial services sector, as bond yields climbed.
The commodity bloc currencies have not received a boost from oil prices, which tumbled on the latest inventories reports. WTI toppled sharply from 53 to just above the critical 50.00 per barrels. Moreover, while the stronger US dollar has not helped, the ferocity of the move suggests that speculative longs were trimming, which could accelerate on a break of the psychological $50.0 level.
Japanese Yen
Dollar bulls who were lacking conviction early this week are in catch up mode ahead of the NFP, which is being viewed as the precursor to a Fed rate hike next week. The surge in US fixed income markets, with US 10 year yields moving in on the 2.60% level, this has sent the market scurrying for top side dollar exposure. While the stop side technical structures (114.75-115) have remained intact, US bond yields are set to rip even higher, so it is only a matter of course before we test the 115 level.
I suspect only a lower than expected NFP will topple the dollar apple cart, but this is highly improbable, as significant topside ADP surprises usually signal the NFP beating consensus. Longer term players, however, will probably be tempered by the US hawkish stance on trade policy. Still, there are many moving parts in these equations.
Euro
It is interesting that German ten-year yields rose ahead of tonight's ECB meeting. Perhaps it is a sign that investors are getting fidgety about a possible change in ECB policy rhetoric. While it is not impossible that the ECB would follow the new Fed hawkish playbook, I suspect the ECB will call the play which errs on the side of caution and keeps policy accommodative in the face of rising political uncertainty. But for the EUR short players, it all boils down to whether or not the market buys into the Draghi's expected dovish lean in the face of improving macro and inflation outlooks in Europe
EM Asia
China is seen as one the primary drivers for ASEAN EM risk sentiment, and with the economy looking stable, and with PMI indexes all pointing up, ASEAN currencies are insulated from much of the Fed headline risk. With recent China trade data coming in below expectations, coupled with surging US bond yields, expect ASEAN local units to trade with heavy bias over the near term.
The Malaysian Ringgit should get hit from both sides as oil prices plummet and surging US yields weigh on the unit near term.