Sample Category Title
European Open Briefing
Global Markets:
- Asian stock markets: Nikkei up 0.30 %, Shanghai Composite fell 0.85 %, Hang Seng declined 1.20 %, ASX 200 lost 0.45 %
- Commodities: Gold at $1204 (-0.45 %), Silver at $17.19 (-0.60 %), WTI Oil at $50.60 (+0.65 %), Brent Oil at $54.55 (+0.85 %)
- Rates: US 10 year yield at 2.56, UK 10 year yield at 1.22, German 10 year yield at 0.37
News & Data:
- China CPI (YoY) (Feb): 0.80% (est 1.70%, prev 2.50%)
- China CPI (MoM) (Feb): -0.20% (est 0.60%, prev 1.00%)
- China PPI (YoY) (Feb): 7.80% (est 7.70%, prev 6.90%)
- Japan M2 Money Stock (YoY) (Feb): 4.20% (est 4.20%, prev 4.10%)
- Japan M3 Money Stock (YoY) (Feb): 3.60% (est 3.60%, prev 3.50%)
- Japan Labour Cash Earnings (YoY) (Jan): 0.50% (est 0.40%, prev 0.50%)
- Japan Real Cash Earnings (YoY) (Jan): 0.00% (prev 0.10%)
- UK RICS House Price Balance (Feb): +24% (est +23%, prev rev +24%)
Markets Update:
The US Dollar is rallying again following stronger than expected ADP employment data yesterday. Expectations for a strong NFP number have increased, and the market is now looking for a number above 190k.
EUR/USD is slowly approaching the 1.05 level. Key support is now seen at 1.0450 and a break below would signal a test of the December low could follow soon. Meanwhile, USD/JPY had a strong bounce off 113.60 support and rallied to 114.75 in yesterday's NY session. Resistance pre-115 remains solid, but if NFP beats expectations, it will likely test 115.50.
AUD/USD is testing key support around 0.75 and a break below would confirm the top at 0.7740, suggesting a correction to 0.73 could follow.
Oil had a big move in the late NY session. WTI declined from 53 to almost 50 after data from the EIA showed a large increase in oil inventories.
The main event today is the ECB rate decision. The central bank is expected to keep rates unchanged, but the focus will be on Mario Draghi’s press conference and hints whether QE could end sooner than anticipated.
Upcoming Events:
- 06:45 GMT – Swiss Unemployment Rate
- 12:45 GMT – ECB Interest Rate Decision
- 13:30 GMT – ECB Press Conference
- 13:30 GMT – US Initial Jobless Claims
Oil Prices Tease At A Slip Below The $50 Handle
Key Points:
- Rising wedge has resolved earlier than expected.
- Ascending trend line should now be tested.
- Near-term recovery also likely prior to any further slips.
A shock 8.21M build in US Crude Oil Inventories sent oil prices reeling during the prior session, resolving the developing rising wedge slightly earlier than anticipated. As a result, from a technical perspective, we expect to have price action remain on the downside, even if we are likely to see a small degree of recovery take place in the immediate future.
First and foremost, now that the oil seems to have been freed from its medium-term wedge, we should see it begin to test the confines of the long-term structure. Specifically, we are somewhat overdue for the ascending trend line to be met with a serious challenge which could mean we are about to see losses extend significantly in as we move forward.
This change in momentum would broadly be in line with other technical readings as the commodity has dipped below the 100 day moving average whilst the 12 and 20 day averages have crossed over. Further, the unexpected plunge has inverted the Parabolic SAR bias to bearish as well which could herald a return of bearish sentiment for oil.
However, it's worth noting that despite this longer-term shift in bias, we could have a modest recovery on hand in the coming session. As is shown on the daily chart, the stochastics have careened into oversold territory and oil's rout has seemly halted around the 38.2% Fibonacci level. Combined, these two factors could indicate that the commodity might pull back slightly to around the 51.41 mark priorto the 100 day EMA slapping it lower again.
From a fundamental perspective, the severity of the plunge makes it clear that, in the market's view at least, OPEC's production freeze is proving ineffectual. Indeed, the cartel'sboast of 140% compliance with its freeze targets by members and 50-60% compliance by non-OPEC members seems to have fallen on deaf ears. As a result, we may see traders take a dimmer and dimmer view of the whole attempt to keep prices buoyant which could see us move back into the $40-50 range.
Ultimately, the proof will be in the pudding so to speak and we will simply have to wait and see if this plunge is indicative of anything more serious than a temporary blip. However, given the technicals discussed above, there is a fairly strong case for continued losses for oil which certainly won't be going unnoticed by the bears out there.
Will The Cable Discover A Bottom?
Key Points:
- Cable retreating towards a key support zone formed by the October low.
- RSI Oscillator close to oversold.
- Watch for a retracement back towards the long side in the coming week.
The past week has seen a rapid descent for the Cable as sentiment has flowed strongly into the greenback as speculation of an impending FOMC rate hike has continued to mount. Subsequently, we have seen price action drop from around the 1.2600 handle to its current level at 1.2160. However, it remains to be seen how much further the embattled pair will go given that we are now nearing the depths of the October 2016 low.
Fundamentally, the Cable has had a punishing few months with the uncertainty of the Brexit negotiations causing capital flows away from the Pound. In addition, the recent sharp falls in the BRC Retail Sales monitor to -0.4% y/y and the Halifax HPI to 0.1% have complicated assessing the pair’s current fundamental direction. However, the near term outlook is not highly negative despite ongoing rhetoric around the impact of an exit from the EU. Inflationary pressures are starting to awaken in the UK and GDP is proving to be relatively robust in light of the ongoing uncertainty. Subsequently, there are plenty of fundamental factors to suggest that the currency pair’s current malaise is a temporary decline.
From a technical perspective, the pair’s price action has recently been exhibiting strong bearish tendencies as it moves back towards the 1.21 handle. However, a key zone of support is looming at 1.2031 and the RSI Oscillator is nearing oversold levels on the daily timeframe. Subsequently, there are plenty of indicators that we are likely to see a swing back to the long side if price action can remain above the 1.2031 support zone.
It would appear that the majority of selling pressure has largely come from capital flows into the greenback in an attempt to position ahead of the FOMC decision. Subsequently, as we move towards completely pricing in a rate hike decision, there is less reason to see further sharp declines in the Cable’s valuation.
Ultimately, the most likely scenario for the pair in the coming week is a continual gentle drift lower until the support zone is reached and then a sharp reversal back towards strong resistance around the 1.2500 handle. At this stage, it’s unknown if the Cable can break out of its current range but the presently low valuation is unlikely to hold over the medium term, especially if further certainty over the Brexit is reached.
EUR/USD Daily Outlook
Daily Pivots: (S1) 1.0524; (P) 1.0549 (R1) 1.0564; More.....
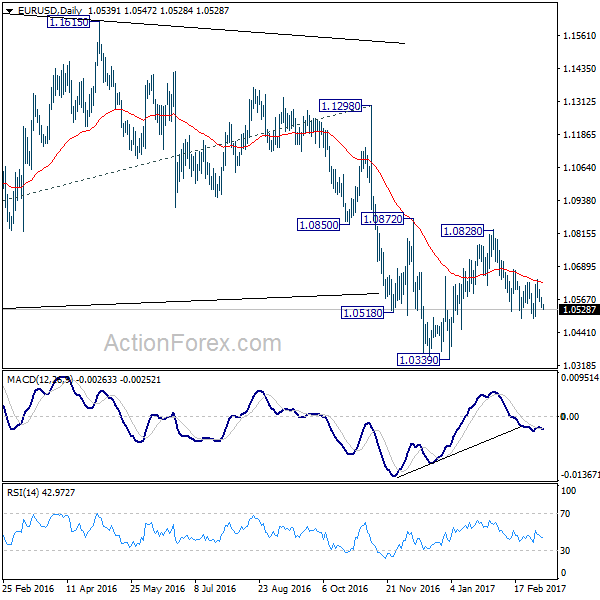
EUR/USD continues to weaken today but stays in range of 1.0493/1.0630. Intraday bias remains neutral at this point. On the downside, below 1.0493 support will affirm the case that fall from 1.0828 is resuming the larger down trend. In that case, intraday bias will be back to the downside for resting 1.0339 low. On the upside, firm break of 1.0630 resistance will argue that pull back from 1.0828 is completed. Also, rise from 1.0339 could possibly be resuming. In that case, intraday bias will be turned back to the upside for 1.0828 resistance and above.
In the bigger picture, whole down trend from 1.6039 (2008 high) is in progress. Such down trend is expected to extend to 61.8% projection of 1.3993 to 1.0461 from 1.1298 at 0.9115. On the upside, break of 1.1298 resistance is needed to confirm medium term bottoming. Otherwise, outlook will stay bearish in case of rebound.

GBP/USD Daily Outlook
Daily Pivots: (S1) 1.2132; (P) 1.2173; (R1) 1.2207; More...
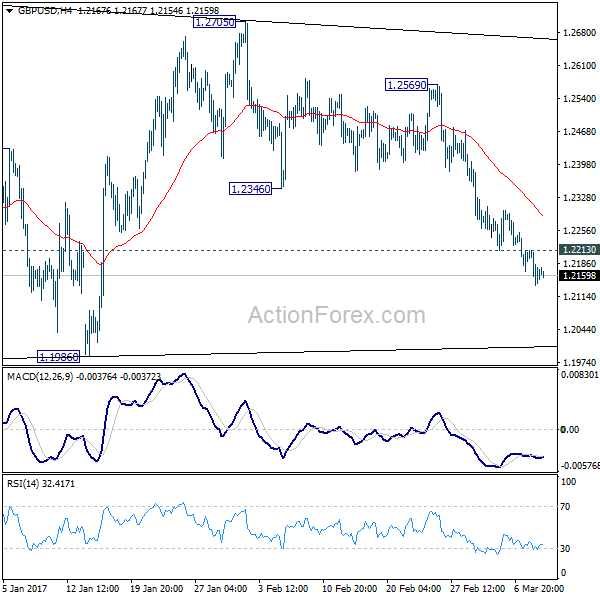
Intraday bias in GBP/USD remains on the downside as decline from 1.2705 continues. The pair should target 1.1946/86 key support zone next. As noted before, consolidation pattern from 1.1946 should have completed with three waves to 1.2705 already. Break of 1.1946 will confirm our bearish view and resume the larger down trend. On the upside, above 1.2213 minor resistance will turn bias neutral and bring recovery. But outlook will remain cautiously bearish as long as 1.2346 support turned resistance holds.
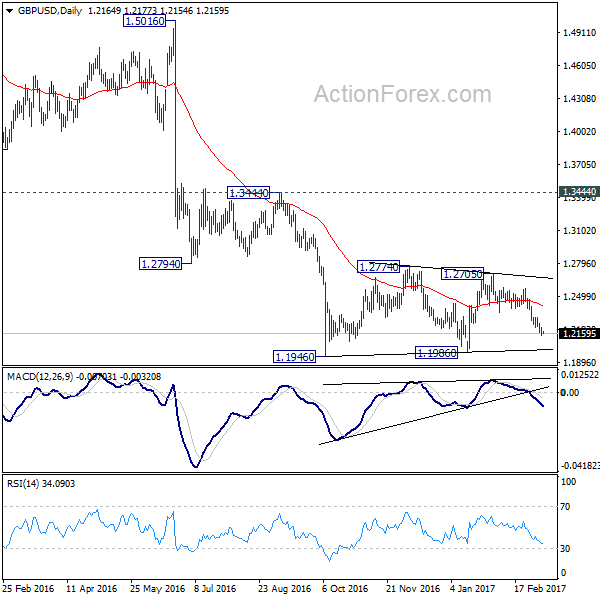
In the bigger picture, fall from 1.7190 is seen as part of the down trend from 2.1161. There is no sign of medium term bottoming yet. Sustained trading below 61.8% projection of 2.1161 to 1.3503 from 1.7190 at 1.2457 will target 100% projection at 0.9532. Overall, break of 1.3444 resistance is needed to confirm medium term bottoming. Otherwise, outlook will remain bearish.
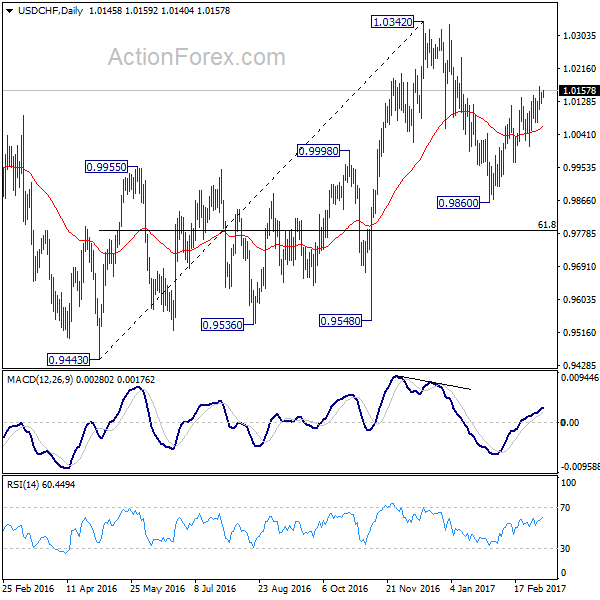
USD/CHF Daily Outlook
Daily Pivots: (S1) 1.0127; (P) 1.0141; (R1) 1.0159; More.....
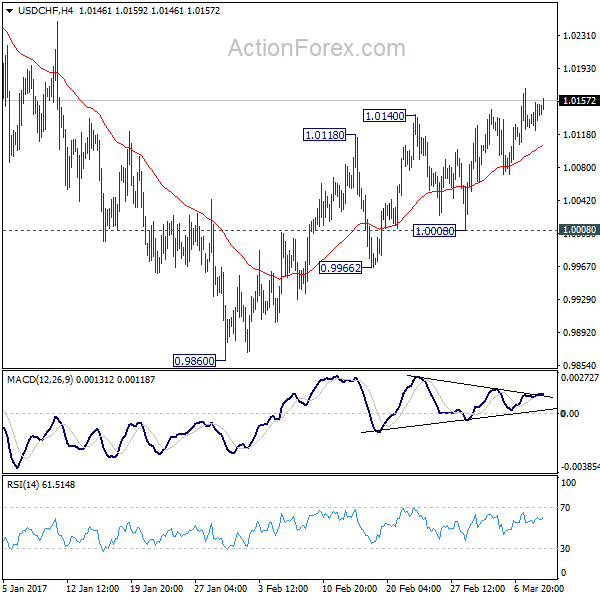
Intraday bias in USD/CHF remains on the upside as the rebound from 0.9860 is in progress. The pair would now target a test on 1.0342 key resistance level. As noted before, based on neutral medium term outlook, we'd be cautious on topping at around 1.0342. On the downside, break of 1.0008, however, will indicate completion of the rebound from 0.9860. And intraday bias will be turned back to the downside for 0.9860.
In the bigger picture, prior rejection from 1.0327 resistance argues that USD/CHF is staying in a medium term sideway pattern. In any case, decisive break of 1.0342 resistance is needed to confirm underlying strength. Otherwise, we'll stay neutral in the pair first. In case of another fall, we'd expect strong support from 0.9443/9548 support zone. Meanwhile firm break of 1.0342 will target 38.2% retracement of 1.8305 to 0.7065 at 1.1359.
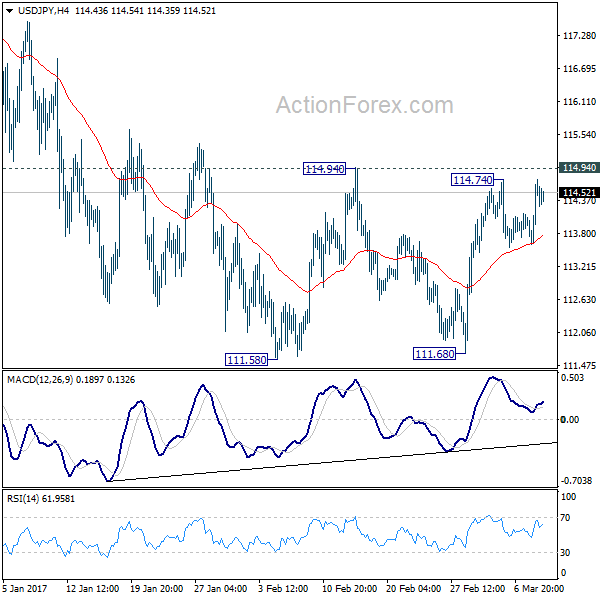
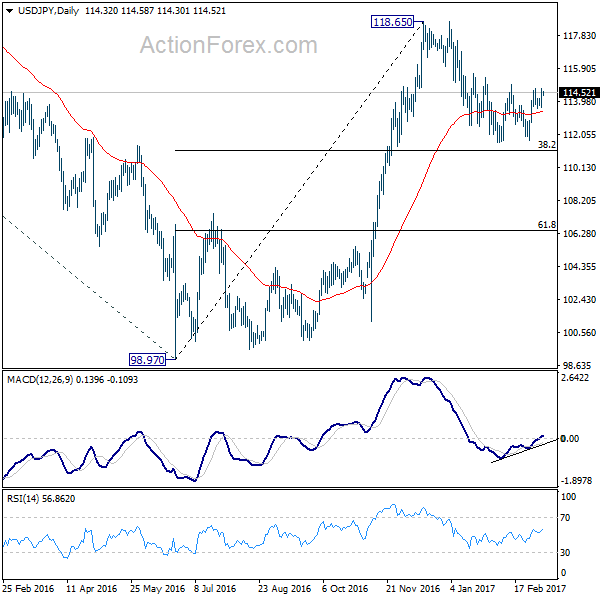
USD/JPY Daily Outlook
Daily Pivots: (S1) 113.73; (P) 114.25; (R1) 114.89; More...
USD/JPY is still bounded below 114.95 resistance and intraday bias remains neutral first. On the upside, decisive break of 114.94 resistance should confirm completion of the corrective pull back from 118.65. This would be supported by a double bottom pattern (111.58, 111.68). In such case, intraday bias will be turned to the upside for retesting 118.65. In case of another decline, we'd still expect strong support from 38.2% retracement of 98.97 to 118.65 at 111.13 to contain downside and bring rebound.
In the bigger picture, price actions from 125.85 high are seen as a corrective pattern. The impulsive structure of the rise from 98.97 suggests that the correction is completed and larger up trend is resuming. Decisive break of 125.85 will confirm and target 61.8% projection of 75.56 to 125.85 from 98.97 at 130.04 and then 135.20 long term resistance. Rejection from 125.85 and below will extend the consolidation with another falling leg before up trend resumption.
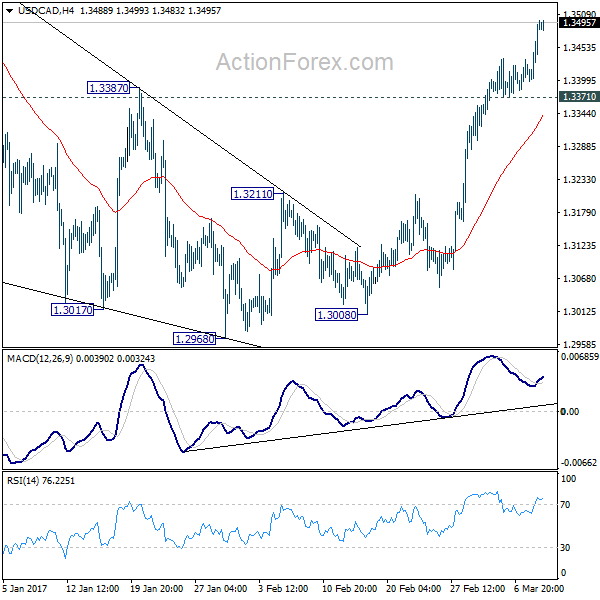
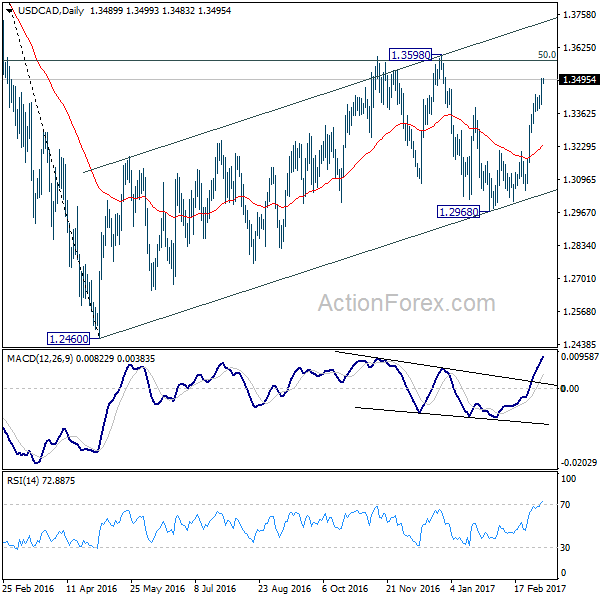
USD/CAD Daily Outlook
Daily Pivots: (S1) 1.3425; (P) 1.3463; (R1) 1.3529; More...
USD/CAD's rally continues today and intraday bias remains on the upside for retesting 1.3598 high. Decisive break there will resume the medium term rally from 1.2460 and target next fibonacci level at 1.3838. On the downside, however, break of 1.3371 minor support is needed to indicate short term topping. Otherwise, outlook will remain bullish in case of retreat.
In the bigger picture, price actions from 1.4689 medium term top are seen as a correction pattern. The first leg has completed at 1.2460. The second leg is likely still in progress and could target 61.8% retracement of 1.4689 to 1.2460 at 1.3838. We'd look for reversal signal there to start the third leg. Break of 1.2968 wold at least bring at retest of 1.2460 low. However, sustained trading above 1.3838 would pave the way to retest 1.4689 high.
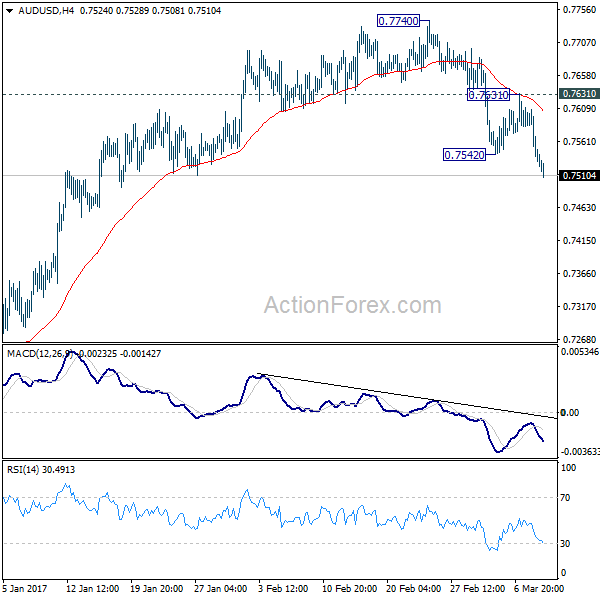
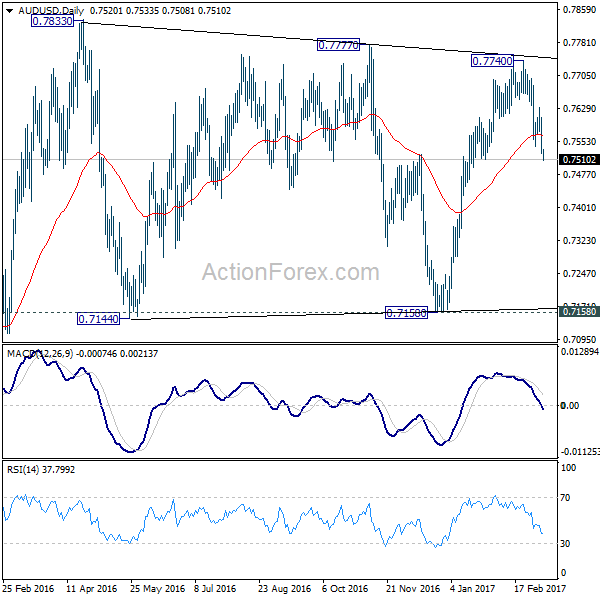
AUD/USD Daily Outlook
Daily Pivots: (S1) 0.7499; (P) 0.7553; (R1) 0.7582; More...
Intraday bias in AUD/USD stays on the downside for the moment as fall from 0.7740 extends. Whole rebound from 0.7158 should be completed. AUD/USD is now targeting lower side of the range at 0.7144/7158 support zone. On the upside, break of 0.7631 resistance is needed to indicate completion of such decline. Otherwise, outlook will stay cautiously bearish in case of recovery.
In the bigger picture, we're still treating price actions from 0.6826 low as a correction. And, as long as 38.2% retracement of 0.9504 to 0.6826 at 0.7849 holds, long term down trend from 1.1079 is expected to resume sooner or later. Break of 0.6826 low will target 0.6008 key support level. However, firm break of 0.7849 will indicate that rise from 0.6826 is developing into a medium term rebound, rather than a sideway pattern. In such case, stronger rise should be seek to 55 month EMA (now at 0.8164) and above.
GBP/JPY Daily Outlook
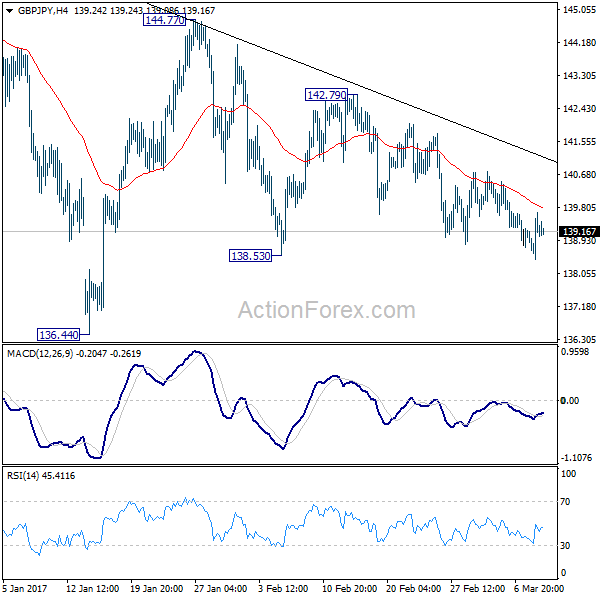
Daily Pivots: (S1) 138.52; (P) 139.09; (R1) 139.75; More...
GBP/JPY remains bounded in range of 138.53/142.79. Intraday bias stays neutral at this point. Price actions from 148.42 are seen as a corrective pattern. Break of 138.53 support will bring deeper decline to 136.44 support and possibly below. However, we'd expect strong support at 50% retracement of 122.36 to 148.42 at 135.39 to bring rebound. On the upside, above 142.79 will turn bias back to the upside for 144.77 and above.
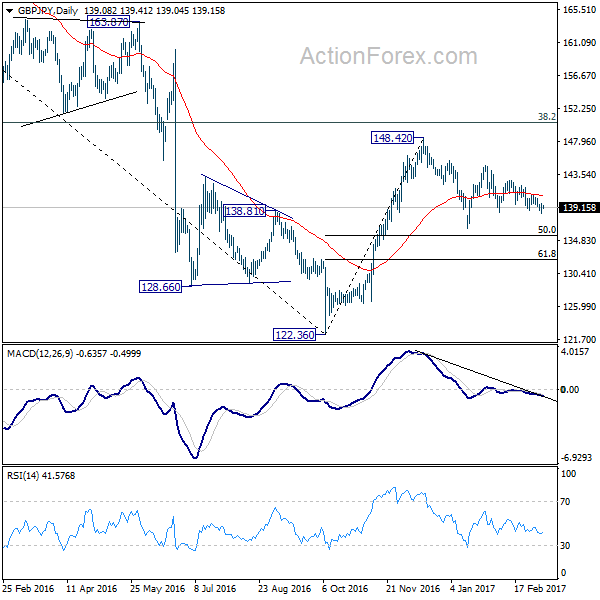
In the bigger picture, price actions from 122.36 medium term bottom are still seen as a corrective pattern. Main focus is on 38.2% retracement of 195.86 to 122.36 at 150.42. Rejection from there will turn the cross into medium term sideway pattern with a test on 122.36 low next. Though, sustained break of 150.42 will extend the rebound towards 61.8% retracement at 167.78.