
Sample Category Title
GBP/USD Keeps Climbing Down The Ladder
'Rising US yields continue to push spreads over gilts towards 2016 lows and will likely drive GBP/USD towards 1.20, if not 1.1850, even though broader range trading is likely to remain.' – Westpac (based on FXStreet)
Pair's Outlook
Wednesday was another negative day for the British currency, being that it edged lower against the Buck again. This time the 1.22 threshold has been crossed, meaning the Cable is one step closer to reaching the 1.1947 level—the lowest in more than ten years. Even though the lower Bollinger band and the monthly S2 now represent immediate support around 1.2130, this area is unlikely to hold the GBP/USD pair afloat for long, namely it is expected to remain intact only today. Meanwhile, technical indicators remain unchanged, with the weekly signals still bearish.
Traders' Sentiment
Traders keep getting more bullish towards the Sterling, as now 65% of all open positions are long, compared to 61% on Monday. The portion of buy orders is also relatively large, taking up 61% of the market.


USD/JPY Retests Channel’s Resistance Line
'Historically the dollar hasn't fared well against reserve currencies like the euro or yen or the pound during times of U.S.-led protectionism.' – Toronto-Dominion Bank (based on Bloomberg)
Pair's Outlook
A positive reading of the US ADP Non-Farm Employment Change provided the US Dollar with a boost yesterday, allowing it to put the tough resistance around 114.60 to the test. Ultimately, the Buck closed with a 40-pip rally against the Yen, meaning that the ascending channel's resistance line remains intact. From the technical perspective the US Dollar should now undergo a bearish correction, with traders taking profit of the recent rallies; however, technical indicators suggest otherwise. Due to lack of strong market movers today, another positive development is possible, but with gains limited circa 114.75. The base case scenario is still the integrity of the channel's resistance line.
Traders' Sentiment
Today 55% of traders hold long positions (previously 60%), while 67% of all pending orders are to purchase the Greenback (up from 57%).


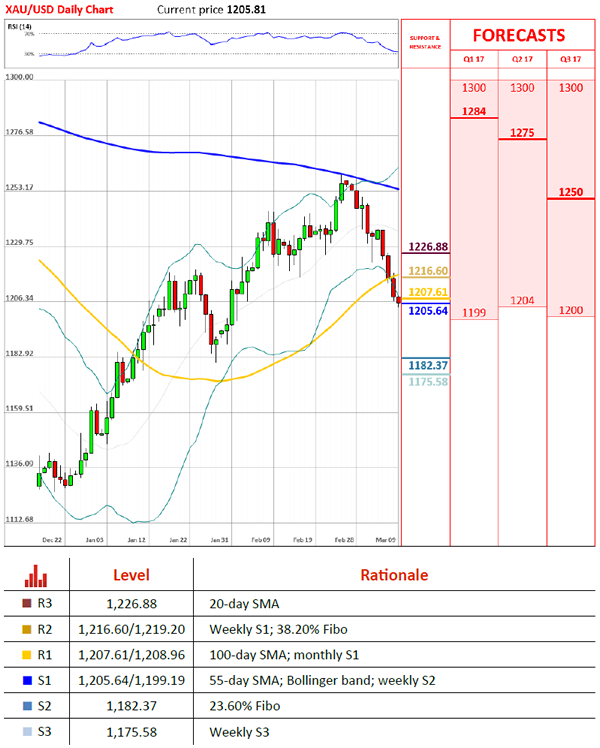
Gold Reaches Possible Long Term Trend Line
'If the (nonfarm payroll) data does come in better than market expectations, it will drag gold prices further.' - Barnabas Gan, OCBC (based on Reuters)
Pair's Outlook
During the early hours of Thursday's trading session the yellow metal's price slipped even further lower, as the price reached below the 1,205 level. However, the bullion managed to find support in a speculative and before the recent moves unconfirmed long term lower trend line of a large scale ascending channel pattern. Due to that reason traders should look at whether a proper rebound occurs, as from the upside there is a strong resistance cluster, which could keep the commodity price lower in the future sessions.
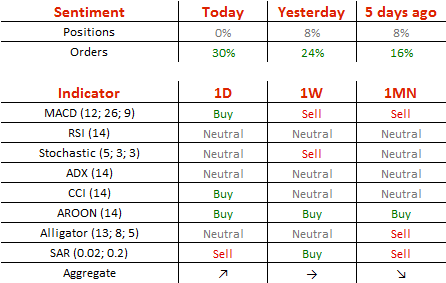
Traders' Sentiment
SWFX traders are neutral at the moment, as 50% of open positions are long. Although, 65% of trader set up orders are set to buy the bullion, and such a high level has not been seen for more than two months.
AUD Tests Important Support
The AUD is testing an important support zone today as one by one; its foundations get eroded.
Last nights U.S ADP Employment Change was a monster number, adding 298,000 jobs against an expected number of 185,000. Such a huge overshoot has seen economists and analysts scrambling to revise tomorrow's Non-Farm Payrolls (NFP) up from 190,000 consensus. For those that have been on Mars the last couple of weeks, the NFP is the last stone in the wall needed to all but confirm the Federal Reserve hikes at next week's FOMC.
The street had not priced this in at all as of even seven days ago and had been scrambling to play catch-up ever since. This has manifested itself as a stronger USD, lower precious metals and as of last night some meaningful rises in U.S. bond yields. With the unemployment rate also expected to come in at 4.7% tomorrow night as well, I would suggest that the Federal Reserve is well and truly on their path to three rates hikes this year as reported, perhaps even four. Something we feel is still not priced in by the market.
Apart from gold and silver, down -0.70% and -1.50% respectively, platinum and copper also fell heavily as did corn and wheat, the latter by -2.0%. Like its little Kiwi brother, it looks like the Australian Dollar (Aud) is finally feeling the effects. As yields rise in the U.S. so does the appeal of Aud yields fade. Australia is a major exporter of most of the commodities above, especially copper and wheat. This further sapped the lucky country. A neutral RBA earlier in the week, a lower growth China are the final pieces of the puzzle.
Aud fell from 7610 in New York trading to around 7525 and in Asia has continued lower to 7510. Looking at the chart below, we can see that the 7515/35 region is an important support level, containing the 55, 100 and 200-day moving averages (DMA) ahead of support at 7490. From a technical perspective, a close below the moving averages is bearish.
However, some caution could be warranted as the 7490 level has not broken yet. A look at the chart below shows that Aud has been down to the 7520 area a number of times since early January, only to break bears hearts by rallying after that. A break of 7490 could open further losses from a technical point of view, with very little support until 7450 and 7380, the 50% and 61.8% Fibonacci retracements of the December low to the February high.
It is also important to note that Aud only closed below the 200-dma, not the 55 and 100 on a day basis, although intra-day in Asia, we are trading lower.
Resistance is at the aforementioned 7515/35 area, and then 7605.
Overall, although the technical picture looks potentially quite bearish, Aud's ability to rally from this level previously, means traders may wish to see a confirmed break on a daily basis if they are bearish.
Forex Technical Analysis
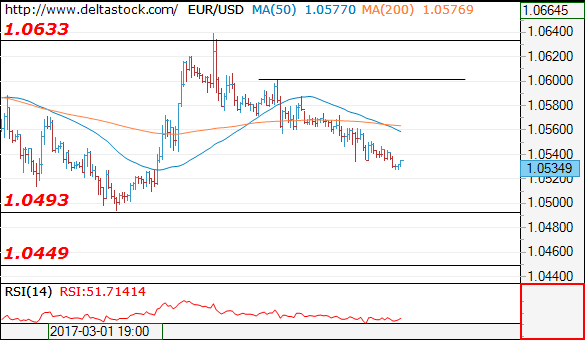
EUR/USD
Current level - 10534
My outlook remains bearish, for a slide towards 1.0490 low, en route to 1.0450. Initial intraday resistance lies at 1.0560.
| Resistance | Support | ||
| intraday | intraweek | intraday | intraweek |
| 1.0560 | 1.0705 | 1.0493 | 1.0450 |
| 1.0680 | 1.0870 | 1.0450 | 1.0350 |
USD/JPY
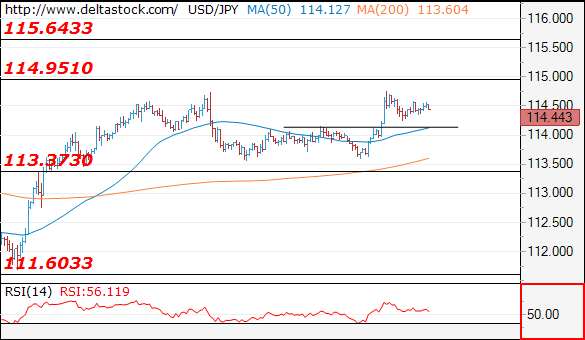
Current level - 114.43
Yesterday's impulsive rise signals a bullish bias above 114.10 intraday support, for a rise towards 115.65 area.
| Resistance | Support | ||
| intraday | intraweek | intraday | intraweek |
| 114.75 | 118.65 | 114.10 | 111.40 |
| 115.60 | 120.00 | 113.37 | 109.80 |
GBP/USD
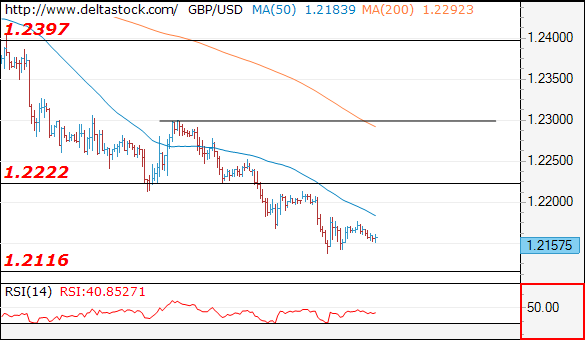
Current level - 1.2157
The downtrend is intact, ready for a test of 1.2115-2080 support zone. Key resistance is projected at 1.2220.
| Resistance | Support | ||
| intraday | intraweek | intraday | intraweek |
| 1.2220 | 1.2570 | 1.2115 | 1.2080 |
| 1.2300 | 1.2705 | 1.2080 | 1.1984 |
CL_F Elliott Wave View: Ending A Flat Correction
Short term Elliottwave view in Crude Oil (CL_F) suggests that the instrument is currently correcting cycle from 11/14/2016 low (42.21) in 3, 7, or 11 swing before the next leg higher. Revised view suggests the decline starting from 1/3 high (55.24) is unfolding as a flat Elliottwave structure where Minor wave A ended at 50.71 and Minor wave B ended at 54.94. Minor wave C is in progress and subdivided as 5 waves diagonal where Minute wave ((i)) ended at 52.54, Minute wave ((ii)) ended at 53.8, and Minute wave ((iii)) ended at 50.05. A bounce in Minute wave ((iv)) is expected now followed by another low in Minute wave ((v)) towards 47.6 – 49.34 area to end cycle from 1/3 high. Afterwards, expect Crude Oil to resume the rally higher or at least bounce in 3 waves to correct the cycle from 1/3 high. We don’t like selling the proposed pullback and expect buyers to appear from 47.6 – 49.34 area for at least 3 waves bounce, provided that pivot at 11/14/2016 (42.21) stays intact.
CL_F 1 Hour Chart
Dollar Holds Near Recent Highs As US Data Remain Strong
Sunrise Market Commentary
- Rates: Hard for Draghi to surprise in a dovish way
We expect the ECB to hold its monetary policy unchanged. From a market point of view, we think that it's hard for Draghi to surprise in a dovish way, suggesting that there is little upside for the Bund. US yields surpassed resistance levels after a stellar ADP report. The break needs to be confirmed after the payrolls (Friday) and Fed meeting (Wednesday). - Currencies: Dollar holds near recent highs as US data remain strong
Yesterday, the dollar was supported by higher core yields. A strong US ADP report was an additional positive, but no break of key technical levels occurred. Today, the focus turns to the ECB press conference. The ECB will confirm the need for ongoing stimulus, but references to higher inflation or better eco data might be temporary supportive for the euro.
The Sunrise Headlines
- US equities closed between flat (Nasdaq) and 0.33% lower (Dow) as an ebullient ADP-report and lower oil prices failed to inspire. Overnight, China (-1%) underperforms Asian stock markets after weaker CPI data.
- The US energy department reported a ninth consecutive rise in crude stockpiles, which last week jumped by 8.2m barrels, triggering a sell-off in both major oil benchmarks that plunged nearly 5%, to the lowest level since December.
- China's PPI accelerated to its fastest pace in nearly nine years in February (7.8% Y/Y) as prices of steel and other raw materials extended a torrid rally. CPI, however, cooled more than expected to its mildest pace since January 2015 (0.8% Y/Y) as food prices fell, remaining well below the government's 3% target.
- French Socialist Party heavyweight Delanoë, the popular former mayor of Paris, said he would back centrist Macron to stop far-right leader Le Pen from winning. The announcement was a further blow to Socialist candidate Hamon.
- Ratings agency Moody's says Australia might lose its AAA sovereign credit rating should the country's conservative government give up on deficit repair, raising the stakes ahead of the annual budget in May.
- The ECB is expected to stick to its guns today by keeping policy rates and its asset purchase programme unchanged as EMU core inflation remain lethargic. However, will the central bank tweak its forward guidance?
- Today's eco calendar contains only US jobless claims apart from the ECB meeting. Ireland and the US tap the bond market.
Currencies: Dollar Holds Near Recent Highs As US Data Remain Strong
USD within reach of key resistance
On Wednesday, the dollar initially traded cautiously higher. The up-move accelerated after a very strong US ADP report. Especially USD/JPY profited from higher US yields (and a constructive risk sentiment). The 114.95 resistance came again on the radar, but a real test didn't occur. USD/JPY even finished the session at 114.35, off the intraday top. The gain of the dollar against the euro was more modest. EUR/USD closed the session at 1.0541 (from 1.0566).
Overnight, Asian equities are trading in negative territory, except for the Japanese stocks. USD strength is an ambiguous factor for regional currencies. Chinese inflation data were very diffuse with the CPI much lower than expected, but the PPI rising to 7.8%. The sharp setback in oil is also a negative for some markets in the region. USD/JPY is holding in the mid 114 area. The dollar also remains better bid against the euro. EUR/USD trades in the 1.0530/35.
Today, markets will keep an eye at the US jobless claims, even as its survey period lags the period for the payrolls survey week. Another very low figure might keep the dollar well supported after yesterday's very strong ADP labour report and going into tomorrow's US payrolls. However, today's focus will be on the ECB press conference. ECB's Drahgi will maintain the line from the January press conference and stress the need for generous stimulus to reach the inflation target in a sustainable way. However, some tweaks as possible (see fixed income part). A modest positive euro reaction on the tweaks is possible. Over the previous days, the euro was quite resilient to the overall USD rebound. Investors were maybe a bit cautious to go euro short ahead of the ECB decision. In a day to-dayperspective, it will be difficult for EUR/USD to break below the 1.0494 support in a sustainable way as an (albeit marginal) change in the ECB tone might be euro supportive. At the same time, USD investors might turned a bit more cautious ahead of tomorrow's payrolls. That said, USD/JPY was recently more sensitive to USD positive news than USD/EUR.
Global context: Last week, the focus shifted from US fiscal policy to Fed's monetary policy, as the Fed signalled a March rate hike. The dollar is holding near the recent highs, but the rally slowed as a March rate hike is discounted. EUR/USD 1.0494 and USD/JPY 114.95 were tested, but no break occurred. Some ST USD consolidation might be on the cards today. The payrolls are the next key issue for USD trading. USD/JPY 111.60/111.16 (Range bottom/38% retracement of the 99.02/118.66 rally) remains a key and solid support. Last week's correction suggests that it is too early for a break higher in the absence of important USD supportive news. In EUR/USD 1.0829/74 is the short-term line in the sand with intermediate resistance at 1.0679. A sell EUR/USD on upticks remains favoured
EUR/USD nearing 1.0494 support going into the ECB press conference. Break won't be easy today.
EUR/GBP
Sterling hardly profits from ‘positive' budget message
On Wednesday, the recent sterling decline continued going into the formal lecture of the budget statement in Parliament. EUR/GBP filled offers just below 0.87. Later in the session, sterling enjoyed an intraday short squeeze as the ORB raised the 2017 growth forecast to 2.0% and as the 2016/17 budget result was expected to be better than projected in November. At the same time, the growth forecast for the years after 2017 were revised slightly lower. The UK will also continue its efforts to further reduce the budget deficit in the next years. EUR/GBP finished the session little changed at EUR/GBP 0.8663. Cable finished the session at 1.2168 (from 1.2200). So, sterling continued to trade soft.
Overnight, the RICS House price balances was little changed at 24% from 25. The report had no noticeable impact on sterling trading. Later today, there are no important eco data on the agenda in the UK. So, after yesterday's budget, the focus might return to the Brexit debate. We don't expect any spectacular developments today. Scottish PM Sturgeon in an interview flagged that autumn 2018 might a good time for a new independence referendum in case of a hard Brexit. Sterling sentiment softened of late. The euro was in better shape at the end of last week, helping EUR/GBP to break the 0.8592 resistance, which improved the short-term EUR/GBP picture. We don't expect a sustained EUR/USD rebound , but a combination of temporary euro consolidation and ongoing sterling softness might trigger some further ST EUR/GBP gains. A sustained break north of 0.8645 (levels is still nearby) would reinforce the ST positive momentum. Longer term, we keep a sterling negative view, as the Brexit will negatively impact the UK.
EUR/GBP: clears first resistance at 0.8592. 0.8645 resistance under test
Euro Drifts Lower As ECB Looms
The phenomenal stock market rally has displayed some signs of exhaustion this week with investors on high alert ahead of the looming ECB meeting and NFP this Friday. Asian shares painted a mixed picture during early trading on Thursday following the bearish cues overnight from Wall Street and heavily depressed commodity prices. With participants adopting a caution trading stance ahead of the pending ECB this afternoon, European markets could be exposed to downside risks. The rising prospects of higher US rates have started to weigh on investor sentiment and such may translate to further downside pressures on Wall Street. While the resilience seen in the stock market rally may be commended, bears could make an appearance if investors start to lose patience over Trump's pending fiscal stimulus plans.
ECB meeting in focus
Euro bears were unleashed during trading this week as political risk and uncertainty in Europe repelled investor attraction towards the currency. The ongoing developments in France coupled with fears of Eurosceptic parties gaining ground and destabilizing the unity of the Eurozone has left investors on edge. While the fundamentals of Europe have displayed signs of improvement with even inflation hitting the 2% target, the uncertainty revolving around the elections in France and Netherlands continue to limit gains on the Euro. Much attention will be directed towards the pending ECB conference today where the central bank is expected to keep monetary policy unchanged amid the political risk in Europe.
From a technical standpoint, the EUR/USD remains bearish on the daily charts. A decisive breakdown and daily close below 1.0500 could encourage a further selloff lower towards 1.0350.
WTI under renewed selling pressure
WTI Crude was exposed to extreme losses during trading on Wednesday with prices tumbling towards $50 following reports of U.S crude inventories surging to record highs ultimately reviving the oversupply concerns. Although OPEC members have madea valiant effort to stabilizing the oil markets by cutting output, the growing threat of U.S shale ramping up production continues to encourage bears to install heavy rounds of selling on the commodity. While oil markets may be seen to be trapped in a fierce tug of war with OPEC and U.S Shale, a resurgent Dollar from the prospects of higher US interest should expose WTI to further downside shocks.
Currency spotlight – Dollar Index
The Dollar Index marched into gains during Wednesday's trading session with prices breaking above 102.00 following the impressive ADP report that cemented expectations of a March US rate hike. Sentiment remains firmly bullish towards the Dollar and with US economic data following a positive trajectory, further upside could be expected in the short to medium term. Investors may direct their attention towards Friday's NFP release which may be able to propel the Dollar Index higher if it follows the same positive pattern as the ADP release. From a technical standpoint, the Dollar Index is firmly bullish and previous resistance at 102.00 could transform into a dynamic support which may encourage a further incline towards 102.50.
GBP/USD Bearish Channel Aims For 1.20
Currency pair GBP/USD
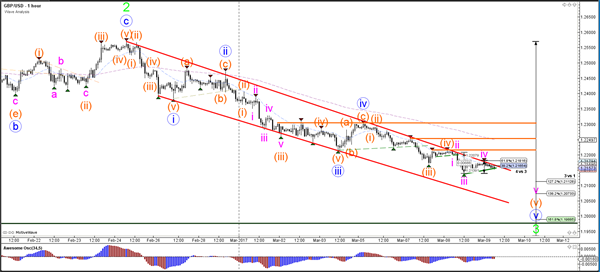
The GBP/USD remains in a downtrend as long as price stays in the bearish channel (red lines). Price is moving towards the Fibonacci targets of wave 5 and wave 3. A bearish continuation could see price move towards 1.20 which is a psychological round level, previous bottom (green) and 161.8% Fibonacci target.
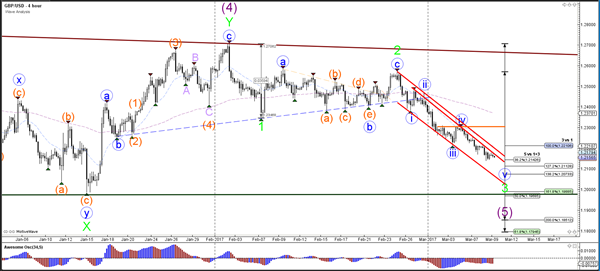
The GBP/USD break below the support trend line (blue) could see price continue with wave 5 (pink) of wave 3 (green). A break above the resistance line (red) would most likely not change the downtrend as long as price stays below horizontal resistance levels (orange).
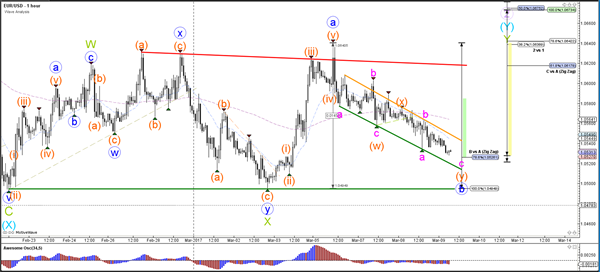
Currency pair EUR/USD
The EUR/USD is in a consolidation zone which is indicated by support (green) and resistance (red). A break above resistance (red) could see price move higher to test the Fibonacci levels of wave 2 (purple) but a push above the 100% level invalidates the wave structure. A break below support (green) could see the downtrend continue within waves 3 (red/green).
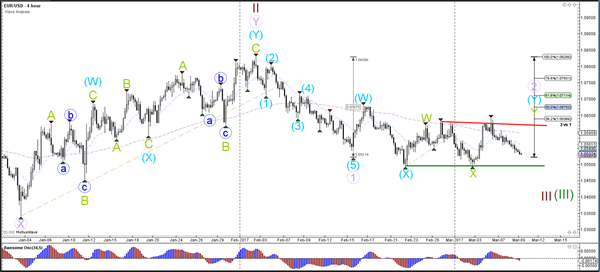
The EUR/USD is in a bearish yet corrective channel (orange/green lines) which has reached the 78.6% Fibonacci level of wave B (blue). The invalidation level of wave B (blue) is a break below the bottom (green). A break above the resistance of the bearish channel (orange) could see price move up in a wave C (blue).
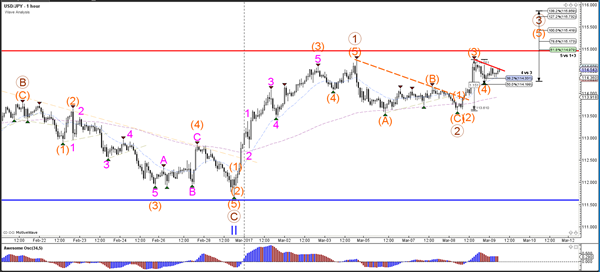
Currency pair USD/JPY
The USD/JPY has completed the wave 2 (brown) retracement if price manages to break above the top (red). A failure to break could lead to an expanded wave 2 correction (brown).
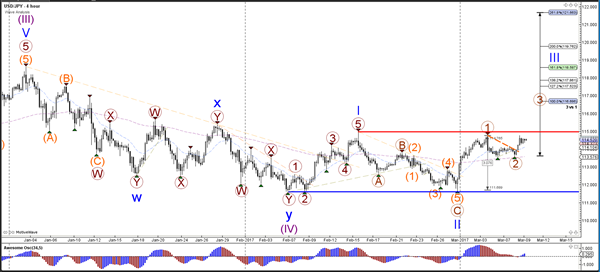
The USD/JPY is building a potential bullish 5 wave pattern (orange) if price manages to break above the resistance trend lines (red).
Daily Technical Outlook And Review
A note on lower timeframe confirming price action...
Waiting for lower timeframe confirmation is our main tool to confirm strength within higher timeframe zones, and has really been the key to our trading success. It takes a little time to understand the subtle nuances, however, as each trade is never the same, but once you master the rhythm so to speak, you will be saved from countless unnecessary losing trades. The following is a list of what we look for:
- A break/retest of supply or demand dependent on which way you're trading.
- A trendline break/retest.
- Buying/selling tails ... essentially we look for a cluster of very obvious spikes off of lower timeframe support and resistance levels within the higher timeframe zone.
- Candlestick patterns. We tend to only stick with pin bars and engulfing bars as these have proven to be the most effective.
EUR/USD
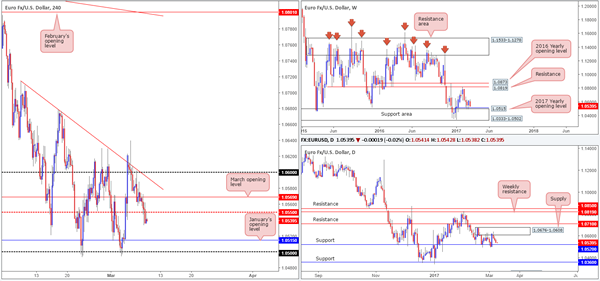
US ADP non-farm employment change came in hotter than expected yesterday, forcing the single currency to break below the H4 mid-way support 1.0550. Be that as it may, the selloff was a short-lived one as the pair managed to recover relatively quickly from lows of 1.0533. It was not until London closed for the day did we see the unit close below 1.0550, which, as you can see, has potentially opened up the gates for a move south down to January’s open level at 1.0515.
Although 1.0515 is an important support in and of itself, we can also see the following converging structures: a round number at 1.05, a daily support at 1.0520 as well as being reinforced by the weekly support area at 1.0333-1.0502. Therefore, the 1.05/1.0520 barrier remains a zone of interest for our desk this morning.
Our suggestions: Seeing as how 1.05/1.0520 has already been tested twice, we would not be comfortable trading from here without additional lower-timeframe confirmation. This could either be an engulf of demand followed by a retest as supply, a trendline break/retest or simply a well-defined collection of buying tails around the higher-timeframe zone. We typically search for lower-timeframe confirmation between the M15 and H1 timeframes, since most of our higher-timeframe areas begin with the H4. Stops are usually placed 3-5 pips beyond confirming structures.
Data points to consider: EUR minimum bid rate at 12.45pm, ECB press conference at 1.30pm. US jobless claims at 1.30pm GMT.
Levels to watch/live orders:
- Buys: 1.05/1.0520 ([wait for a lower-timeframe signal to form before looking to pull the trigger] stop loss: dependent on where one confirms the zone).
- Sells: Flat (stop loss: N/A).
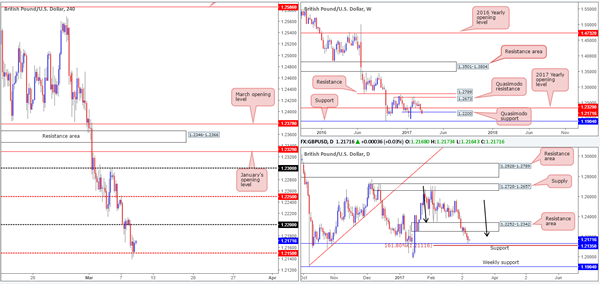
GBP/USD
Despite the UK’s annual budget release and stronger-than-expected US ADP non-farm employment change, the GBP/USD remained steady ahead of the H4 mid-way support 1.2150 yesterday. The other key thing one may want to note here is the fact that price also came within a cat’s whisker of connecting with daily support found at 1.2135, followed closely by a daily AB=CD 161.8% Fib ext. at 1.2111. Whilst the H4 and daily charts indicate that the bulls may still have a hand in this fight, we need to take into account that weekly action recently slipped below a weekly Quasimodo support at 1.22.
Personally, we would not feel comfortable buying this market until we witness a H4 close print back above the 1.22 handle. This would not only confirm buyer strength, but it would also open up the doors to the H4 mid-way resistance 1.2250 which denotes the underside of a daily resistance area at 1.2252.
Our suggestions: All in all, we do not see a lot to hang one’s hat on at the moment. Even with a H4 close above 1.22, there is not a lot of room for this unit to advance! With that being said, we’ll remain flat for the time being and reassess going into tomorrow’s segment.
Data points to consider: US jobless claims at 1.30pm GMT.
Levels to watch/live orders:
- Buys: Flat (stop loss: N/A).
- Sells: Flat (stop loss: N/A).
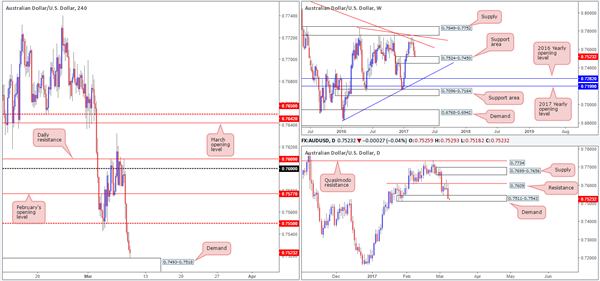
AUD/USD
With China’s trade balance coming in at -60.4 billion CNY versus 172.5 billion expected, the Aussie dollar responded bearishly. Additional selling was seen during the early hours of London, which, as you can see, was later fuelled further by a better-than-expected US ADP print. As can be seen from the H4 chart, the pair has settled around the top edge of a H4 demand area at 0.7493-0.7518 and is, for the time being, holding firm.
Looking over to the bigger picture, it’s clearly seen that both the weekly and daily charts are trading within supportive structures at present (weekly support area at 0.7524-0.7450/Daily demand at 0.7511-0.7543). Because of this, we feel that there’s a good chance price could advance north from the current H4 demand base today and at least tap the underside of the H4 mid-way resistance at 0.7550.
Our suggestions: While a buy from the present H4 demand is tempting, there’s not much room to play with before price strikes 0.7550 (27 pips at current price). As such, an ideal scenario would be for the H4 bears to drive a little deeper into the aforementioned H4 demand, before looking to go long. Our cue here would be a reasonably sized H4 bull candle seen within the walls of this region.
Data poInts to consider: Chinese inflation data at 1.30am. US jobless claims at 1.30pm GMT.
Levels to watch/live orders:
- Buys: 0.7493-0.7518 ([wait for a reasonably sized H4 bull candle to form before looking to pull trigger here] stop loss: ideally beyond the trigger candle).
- Sells: Flat (stop loss: N/A).
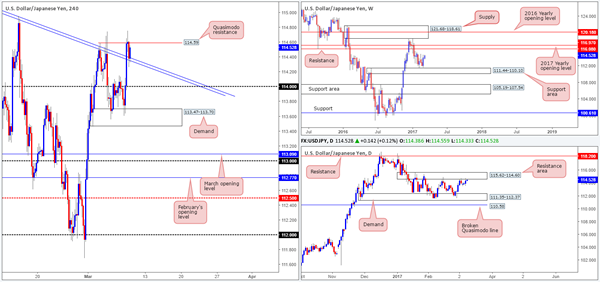
USD/JPY
The value of the USD/JPY strengthened in aggressive fashion going into yesterday’s London open from a H4 demand base seen at 113.47-113.70. Following the release of US ADP non-farm employment data further buying was seen, consequently pulling the piece above a H4 trendline resistance taken from the high 115.62, and tapping the underside of a H4 Quasimodo resistance line at 114.59.
With the H4 candles now effectively loitering mid-range between the above said H4 Quasimodo resistance and (now) H4 trendline support, which direction do we see the pair heading to? Well, over on the daily chart, price is seen kissing the underside of a daily resistance area at 115.62-114.60 (capped upside since mid-Jan 2017). Looking up to the weekly candles, however, there’s room seen for an advance up to weekly resistance at 116.08.
Our suggestions: Given the above notes, it’s difficult to see which way the pair will break today as we have somewhat conflicting signals on the higher-timeframe picture. With this being the case, remaining on the sidelines for now may very well be the better path to take.
Data points to consider: US jobless claims at 1.30pm GMT.
Levels to watch/live orders:
- Buys: Flat (stop loss: N/A).
- Sells: Flat (stop loss: N/A).
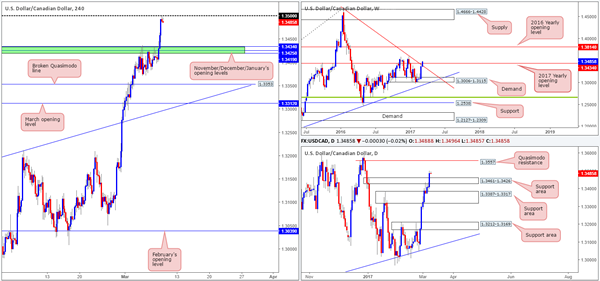
USD/CAD
In recent trade, we saw the US bulls march higher against its Canadian counterpart, taking out the 1.3434/1.3419 (November, December and January’s opening levels) region and end the day shaking hands with the 1.35 handle. Although this number is holding steady for the time being, daily price indicates that there’s room to gravitate north up to a daily Quasimodo resistance level at 1.3557. In addition to this, we can also see that weekly action has recently pushed above a long-term weekly trendline resistance extended from the high 1.4689. So, as you can see, a selloff from 1.35 may not prove to be very fruitful!
Our suggestions: Instead of looking to short 1.35, we will watch for a H4 close to print above this level. A H4 close followed by a retest and a lower-timeframe confirming signal (see the top of this report) would, in our humble opinion, be enough to justify a buy trade, targeting the H4 mid-way resistance 1.3550 (positioned directly below the above said daily Quasimodo resistance).
Data points to consider: US jobless claims at 1.30pm GMT.
Levels to watch/live orders:
- Buys: Watch for price to engulf 1.35 and then look to trade any retest seen thereafter (waiting for a lower-timeframe confirming signal to form following the retest is advised] stop loss: dependent on where one confirms the level).
- Sells: Flat (stop loss: N/A).