Sample Category Title
USDJPY Intra-day Elliott Wave View
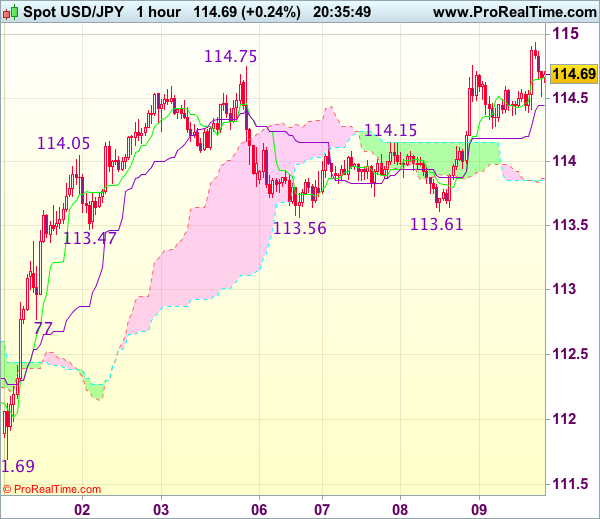
JPY (USDJPY) made a new high above last Friday's peak and now seems to be pulling back. Move up from 113.53 ((x)) low could be viewed as a 5 swing Leading Diagonal Elliott Wave structure. There is RSI divergence (not showing) between red wave iii and blue (a) which further supports the idea of JPY move up from 113.53 low being a diagonal structure. As per Elliott Wave theory, after a 5 wave move up or diagonal structure higher completes, pair should make a corrective pull back before rallying again. Decline from 114.93 -114.48 could be viewed as just the first leg of proposed wave (b) pull back. As current bounce stays below 114.93, pair has scope to make another push lower to complete wave (b) pull back before it turns higher again in wave (c) towards 115.30 -116.11 area. As pair is showing 5 waves up from 113.53 low, we don't like selling the pair in proposed wave (b) pull back and expect it to find intra-day buyers in the dip as far as price stays above 113.53 low and the pivot there remains intact. Break above 114.93 would suggest wave (b) completed already at 114.48 and pair has started the next leg higher in wave (c) toward the above mentioned area.
JPY (USDJPY) 1 Hour Chart
Trade Idea Update: USD/CHF – Buy at 1.0080
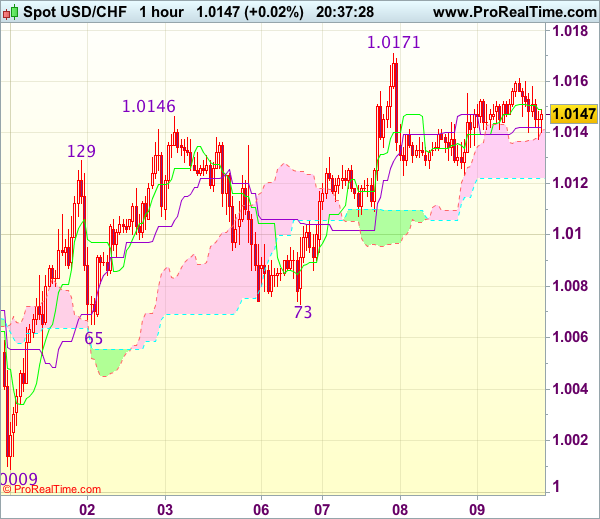
USD/CHF - 1.0150
Original strategy :
Buy at 1.0080, Target: 1.0200, Stop: 1.0045
Position : -
Target : -
Stop : -
New strategy :
Buy at 1.0080, Target: 1.0200, Stop: 1.0045
Position : -
Target : -
Stop : -
Although the greenback has rebounded after finding support at 1.0123 yesterday, break of this week’s high at 1.0171 is needed to signal recent erratic rise from 0.9861 low has resumed and extend further gain to 1.0200-10 but near term overbought condition should limit upside to 1.0220-25 and price should falter below previous chart resistance at 1.0248. If said resistance at 1.0171 continues to hold, then further consolidation would take place and risk of another retreat to 1.0123 cannot be ruled out, however, reckon downside would be limited to 1.0100 and support at 1.0173 should hold, bring another rise later.
In view of this, would not chase this rise here and would be prudent to buy dollar on subsequent pullback as support at 1.0073 should limit downside. A drop below 1.0065 support would abort and signal top is formed instead, risk weakness to 1.0040-45 but reckon support at 1.0009 would remain intact.
Trade Idea Update: GBP/USD – Sell at 1.2215
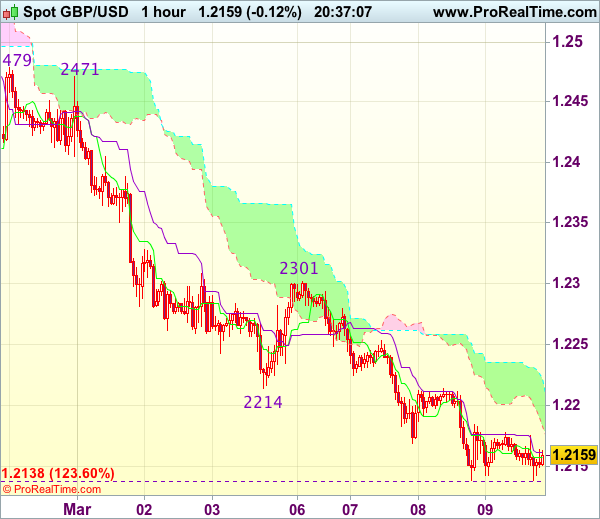
GBP/USD - 1.2152
Original strategy :
Sell at 1.2215, Target: 1.2115, Stop: 1.2250
Position : -
Target : -
Stop : -
New strategy :
Sell at 1.2215, Target: 1.2115, Stop: 1.2250
Position : -
Target : -
Stop : -
As cable has remained under pressure after recent selloff, adding credence to our bearish view that recent decline from 1.2706 is still in progress and may extend further weakness to 1.2110-15, then 1.2090, however, loss of near term downward momentum should prevent sharp fall below 1.2070-75 and price should stay above 1.2050, risk from there is seen for a rebound later.
In view of this, would not chase this fall here and would be prudent to sell cable on recovery as 1.2210-15 should limit upside. Above resistance at 1.2253 would defer and suggest a temporary low is possibly formed instead, risk a stronger rebound to 1.2275-80 but price should falter below resistance at 1.2301 and bring another selloff.
Trade Idea Update: EUR/USD – Buy at 1.0515
EUR/USD - 1.0550
Original strategy :
Buy at 1.0515, Target: 1.0625, Stop: 1.0485
Position : -
Target : -
Stop : -
New strategy :
Buy at 1.0515, Target: 1.0625, Stop: 1.0485
Position : -
Target : -
Stop : -
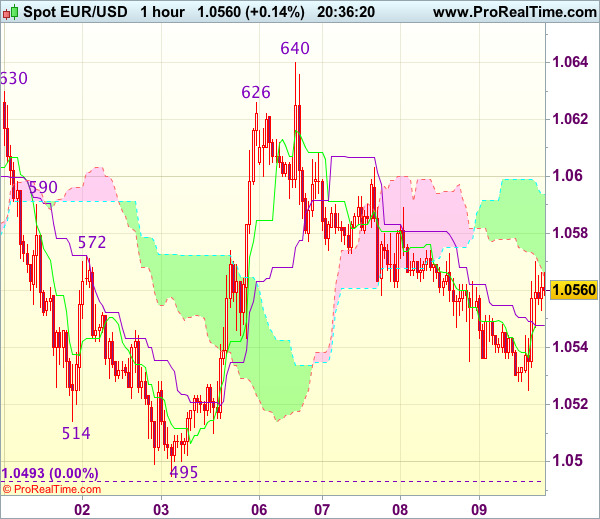
Although the single currency has rebounded after falling to 1.0525, reckon upside would be limited to 1.0600-05 and near term downside risk remains for another decline, however, as broad outlook remains consolidative, reckon downside would be limited to 1.0510-15 and bring another rebound later. Above 1.0600-05 would suggest the fall from 1.0640 has ended, bring further gain to 1.0620, then test of said resistance at 1.0640. Only a break above 1.0640 would extend the erratic rise from 1.0493 low for retracement of early decline to 1.0660-65 (50% Fibonacci retracement of 1.0829-1.0493) and possibly towards resistance at 1.0680 but price should falter well below 1.0700-05 (61.8% Fibonacci retracement).
In view of this, we are looking to buy euro on dips. Below 1.0510 would risk retest of 1.0493 but only break there would shift risk back to the downside and signal recent decline from 1.0829 has resumed for further selloff to 1.0470 and then towards previous support at 1.0454.
(ECB) Monetary Policy Decisions
At today's meeting the Governing Council of the ECB decided that the interest rate on the main refinancing operations and the interest rates on the marginal lending facility and the deposit facility will remain unchanged at 0.00%, 0.25% and -0.40% respectively. The Governing Council continues to expect the key ECB interest rates to remain at present or lower levels for an extended period of time, and well past the horizon of the net asset purchases.
Regarding non-standard monetary policy measures, the Governing Council confirms that it will continue to make purchases under the asset purchase programme (APP) at the current monthly pace of €80 billion until the end of this month and that, from April 2017, the net asset purchases are intended to continue at a monthly pace of €60 billion until the end of December 2017, or beyond, if necessary, and in any case until the Governing Council sees a sustained adjustment in the path of inflation consistent with its inflation aim. The net purchases will be made alongside reinvestments of the principal payments from maturing securities purchased under the APP. If the outlook becomes less favourable, or if financial conditions become inconsistent with further progress towards a sustained adjustment in the path of inflation, the Governing Council stands ready to increase the programme in terms of size and/or duration.
The President of the ECB will comment on the considerations underlying these decisions at a press conference starting at 14:30 CET today.
Trade Idea Update: USD/JPY – Buy at 114.20
USD/JPY - 114.67
Original strategy :
Buy at 114.20, Target: 115.20, Stop: 113.85
Position : -
Target : -
Stop : -
New strategy :
Buy at 114.20, Target: 115.20, Stop: 113.85
Position : -
Target : -
Stop : -
Yesterday’s rally after finding renewed buying interest at 113.61 signals the rise from 111.69 is still in progress and may extend further gain to previous chart resistance at 114.96, however, break there is needed to signal early erratic rise from 111.59 low has resumed and extend gain towards another previous resistance at 115.38 but price should falter below previous resistance at 115.62, bring retreat later.
In view of this, we are looking to buy dollar on pullback as the Kijun-Sen (now at 114.19) should limit downside and bring another rise later. Below 113.95 support would signal an intra-day top is formed instead, risk weakness towards said strong support at 113.56-61 which is likely to hold from here.
Oil Tumbles For Second Day, ECB in Focus
The ECB is stealing the spotlight temporarily from the Federal Reserve today as it announces its latest monetary policy decision and hopefully offers some guidance for the rest of the year.
While inflation in the eurozone is currently running above the ECBs target of below but close to 2%, core inflation is still well below and the base effect in commodities is broadly responsible for the moves in the headline figure. What's more, while the economy is showing signs of improvement, it's still too early to remove accommodation again, having only cut its asset purchase program by €20 billion in December, a move that only comes into effect after this month.
The ECB will also likely want to keep a low profile ahead of the upcoming elections in the Netherlands and France. The most popular parties in these countries are strongly anti-euro and want to pull their respective countries out of the currency union. The last thing Draghi will want to do is rock the boat ahead of these crucial votes, especially if there's absolutely no reason to do so. That said, in the press conference after, we may get some insight into what the central bank intends to do later this year when the current quantitative easing program expires. This is what will create waves in the markets, assuming he gives anything away of course. I think it's more likely that he'll refrain from letting much go at this early stage but highlight the improvement in the data and possible reduction in downside risks.
The euro is trading a little higher ahead of the ECB decision, having spent the last three days in the red. Still, it continues to linger around its two month lows against the dollar, with 1.05 still offering significant support. Against the pound it's been a little better supported but this may largely be due to the weakness in sterling more so than strength of the euro. It continues to struggle against the yen, with safe haven flows continuing to support the latter. With all this in mind, the euro may be susceptible to some decent upside, should Draghi strike a more hawkish tone.
Oil has been the biggest mover this morning, with Brent and WTI both down by more than 2.5%. This week's large inventory build, the third substantial increase in four weeks, really appears to have hit home in the markets, triggering some significant losses over the last 24 hours and a break below the range it had traded within for the last three months. With the downside now taken out, we could well see further losses ahead for Brent and WTI, with $50 and $47.35 being the next major tests. Oil producers may have been patting themselves on the back in recent months about the success of the output cut, with compliance much higher than many expected, but with prices looking weaker once again, an extension to the deal may be more of a necessity than an option.
US Oil Falls Below $50 on Extended Bearish Acceleration
WTI Crude oil extends weakness today and falls below $50 per barrel for the first time since Dec 15.
Yesterday's sharp fall, triggered by unexpectedly strong build in crude stocks (8.2 mln bls build vs 1.1 mln bls forecast and 1.5 mln bls previous week) was the biggest one day fall since July 2016.
Fresh acceleration lower today was sparked by break below psychological $50 support and the base of thick daily cloud (spanned between $49.88 and $53.03) that acted as strong support zone.
Further downside is seen likely, as the price generated strong bearish signal yesterday's close below $50.27 (Fibo 38.2% of $42.19/$55.22) and today's violation of cloud top, close below which would be seen as another strong bearish signal.
Weakness may extend towards next strong support at $48.70 (200 SMA / 50% retracement / weekly Kijun-sen) initially, with break here to generate another strong bearish signal.
However, strongly oversold daily studies suggest that sharp bearish acceleration mmight be paused for corrective action.
Broken cloud base is now acting as initial barrier, ahead of broken 100SMA ($50.91) which sholud ideally cap.
Res: 49.88; 50.00; 50.91; 51.21
Sup: 49.18; 48.70; 47.90; 47.17
DAX Steady as Markets Await ECB Policy Decision
The DAX Index is slightly higher in the Thursday session, trading at 11,940.00 in the European session. In economic news, the ECB will set the benchmark rate, which is expected to remain at 0.00%. ECB President Mario Draghi follows with a press conference.
With the markets all abuzz that the Federal Reserve will raise rates next week, the ECB's policy meeting has almost fallen off the radar. The benchmark rate has been pegged at 0.00% since March 2016, and no change is expected at Thursday's meeting. Inflation levels have finally moved higher and eurozone inflation is expected at 2.0% in February, meeting the central bank's inflation target. ECB President Mario Draghi appears comfortable with current monetary policy, although the ECB could tighten its stance if growth and inflation levels continue to point upwards.
The DAX broke above the symbolic 12,000 level last week, but has dipped lower following a capital raise announcement by Germany's Deutsche Bank. The bank has announced a major reorganization, including raising EUR 8 billion by issuing 687.5 million shares on March 21. Deutsche Bank has hit rough waters, and it seemed only a matter of time before it would have to take some drastic measures. In December, the bank reached a $7.2 billion settlement with the U.S. Department of Justice for selling toxic mortgage-backed securities. Deutsche had a dismal 2016, with losses of EUR 1.4 billion. This capital hike is the fourth since 2010, and it remains to be seen if this move will attract investors and help set the bank in the right direction. Deutsche Bank is one of the larger companies on the DAX, so lower share prices this week for Deutsche has weighed on the DAX.
The Federal Reserve waited an entire year to raise rates in December, but appears ready to make a Mach move. The odds of a March hike continue to climb, and are currently at 88% percent, according to the CME Group. Fed policymakers have been dropping hints of a March move, and a red-hot labor market and higher inflation levels present further arguments in favor higher rates. Earlier in the year, the Fed had said that it wanted to wait until it had a clearer idea of President Trump's economic policy before it tightened monetary policy. However, Trump has not backed up his promises to reform the tax code and increase fiscal spending with any details. Some Fed policymakers wanted to raise rates earlier this year, so Fed Chair Yellen is under pressure to make a move, and it appears virtually certain that the Fed will raise rates by a quarter-point on March 15.
China: CPI Inflation Lower But Rising Pipeline Pressure from PPI
Summary: Inflation still heading above the 3% target
Today's CPI inflation figure for China for February surprised sharply on the downside, falling to 0.8% y/y (consensus 1.7% y/y, previous 2.5% y/y).
The decline was due mainly to a big fall in food prices, from 2.7% y/y to -4.3% y/y.
Core CPI (excluding food) also fell slightly, to 2.2% y/y from 2.5% y/y in January. However, the trend is still up (see chart).
It is likely the fall in inflation is due to the end of Chinese New Year and we expect to see a rebound in March.
PPI inflation rose more than expected to 7.8% y/y - the highest rate since 2008. It is more than signalled by commodity prices and suggests pricing power has improved. However, we expect PPI to peak soon.
Weaker CPI inflation implies downside risk to our forecast of two rate hikes in H1. However, as we still see an overshoot of the 3% target in the spring (due to pass-through from PPI), we continue to expect policy tightening.
Core inflation set to overshoot target in H1
CPI inflation still expected to rise above target in H1
PPI and CPI diverging in February. We look for some pass-through to push CPI inflation above 3% during the spring months.
The increase in commodity prices points to an overshoot of the 3% target before too long.
Lower inflation adds downside risk to our forecast of two hikes
Higher inflation needed for PBoC to hike. Our base case is still two hikes in H1, as we look for a rebound in CPI inflation.
So far, China has targeted tightening towards the financial system through tighter liquidity and raising the repo rate by 10bp.
Latest rise in PPI not explained by commodity prices
Rise in PPI inflation not fully explained by commodity prices - this points to broader price pressure.
PMI and monthly momentum has peaked but is still at a fairly high level.

Moderation in commodity prices set to lower inflation pressure
We should be close to a peak...
... if metal prices flatten out as we forecast
Peak in M1 growth also points to a decline in PPI inflation soon