Sample Category Title
Trade Idea Wrap-up: USD/CHF – Buy at 1.0080
USD/CHF - 1.0147
Most recent candlesticks pattern : N/A
Trend : Near term up
Tenkan-Sen level : 1.0143
Kijun-Sen level : 1.0143
Ichimoku cloud top : 1.0143
Ichimoku cloud bottom : 1.0129
Original strategy :
Buy at 1.0080, Target: 1.0200, Stop: 1.0045
Position : -
Target : -
Stop : -
New strategy :
Buy at 1.0080, Target: 1.0200, Stop: 1.0045
Position : -
Target : -
Stop : -
Although the greenback rebounded after finding support at 1.0123 yesterday, break of this week’s high at 1.0171 is needed to signal recent erratic rise from 0.9861 low has resumed and extend further gain to 1.0200-10 but near term overbought condition should limit upside to 1.0220-25 and price should falter below previous chart resistance at 1.0248. If said resistance at 1.0171 continues to hold, then further consolidation would take place and risk of another retreat to 1.0123 cannot be ruled out, however, reckon downside would be limited to 1.0100 and support at 1.0173 should hold, bring another rise later.
In view of this, would not chase this rise here and would be prudent to buy dollar on subsequent pullback as support at 1.0073 should limit downside. A drop below 1.0065 support would abort and signal top is formed instead, risk weakness to 1.0040-45 but reckon support at 1.0009 would remain intact.

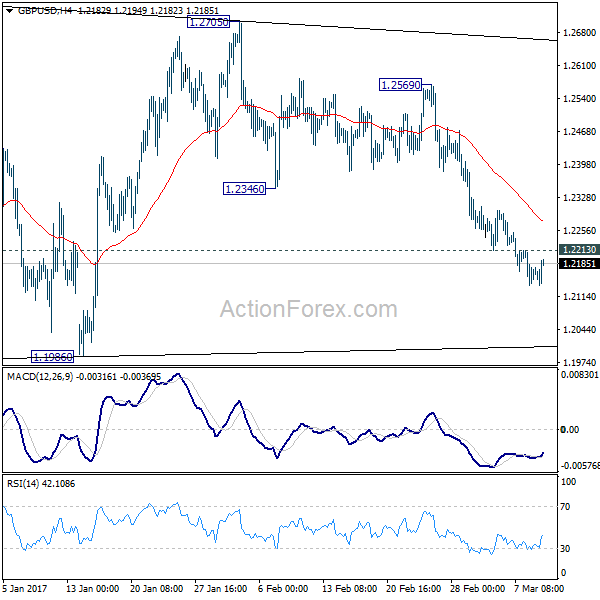
Trade Idea Wrap-up: GBP/USD – Sell at 1.2215
GBP/USD - 1.2152
Most recent candlesticks pattern : N/A
Trend : Near term down
Tenkan-Sen level : 1.2165
Kijun-Sen level : 1.2165
Ichimoku cloud top : 1.2209
Ichimoku cloud bottom : 1.2176
Original strategy :
Sell at 1.2215, Target: 1.2115, Stop: 1.2250
Position : -
Target : -
Stop : -
New strategy :
Sell at 1.2215, Target: 1.2115, Stop: 1.2250
Position : -
Target : -
Stop : -
As cable has remained under pressure after recent selloff, adding credence to our bearish view that recent decline from 1.2706 is still in progress and may extend further weakness to 1.2110-15, then 1.2090, however, loss of near term downward momentum should prevent sharp fall below 1.2070-75 and price should stay above 1.2050, risk from there is seen for a rebound later.
In view of this, would not chase this fall here and would be prudent to sell cable on recovery as 1.2210-15 should limit upside. Above resistance at 1.2253 would defer and suggest a temporary low is possibly formed instead, risk a stronger rebound to 1.2275-80 but price should falter below resistance at 1.2301 and bring another selloff.
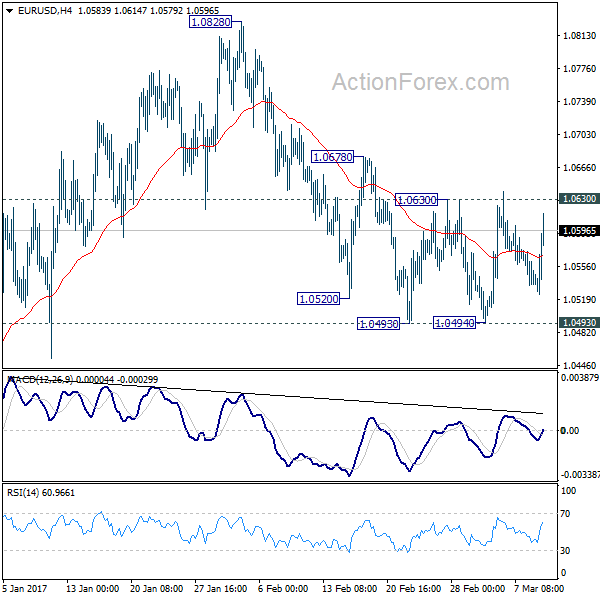
Trade Idea Wrap-up: EUR/USD – Buy at 1.0560
EUR/USD - 1.0582
Most recent candlesticks pattern : N/A
Trend : Sideways
Tenkan-Sen level : 1.0570
Kijun-Sen level : 1.0570
Ichimoku cloud top : 1.0572
Ichimoku cloud bottom : 1.0558
Original strategy :
Buy at 1.0515, Target: 1.0625, Stop: 1.0485
Position : -
Target : -
Stop : -
New strategy :
Buy at 1.0560, Target: 1.0660, Stop: 1.0525
Position : -
Target : -
Stop : -
As the single currency finally staged the anticipated rebound after finding support at 1.0525, suggesting the retreat from 1.0640 has ended at 1.0525 and consolidation with mild upside bias is seen for further gain towards said resistance, however, break there is needed to retain bullishness and signal another leg of the erratic rise from 1.0493 low is underway for retracement of early decline to 1.0660-65 (50% Fibonacci retracement of 1.0829-1.0493) and possibly towards resistance at 1.0680 but price should falter well below 1.0700-05 (61.8% Fibonacci retracement).
In view of this, we are looking to buy euro on dips as 1.0560 should limit downside and bring another rise later. Below said support at 1.0525 would abort and risk test of 1.0493-96 but only break there would shift risk back to the downside and signal recent decline from 1.0829 has resumed for further selloff to 1.0470 and then towards previous support at 1.0454.
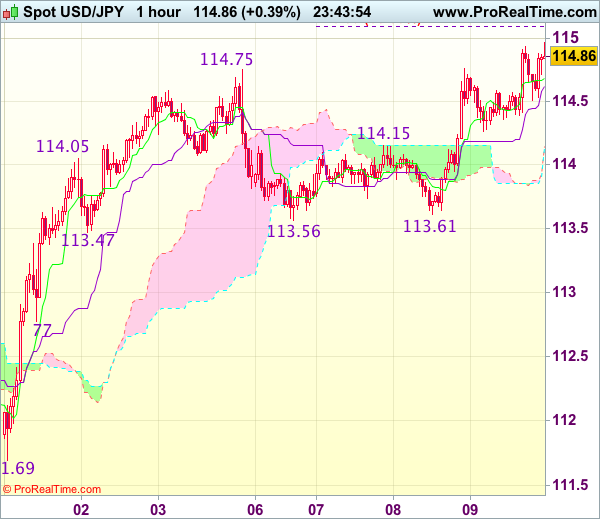
Trade Idea Wrap-up: USD/JPY – Buy at 114.20
USD/JPY - 114.85
Most recent candlesticks pattern : N/A
Trend : Near term up
Tenkan-Sen level : 114.68
Kijun-Sen level : 114.62
Ichimoku cloud top : 114.14
Ichimoku cloud bottom : 114.14
Original strategy :
Buy at 114.20, Target: 115.20, Stop: 113.85
Position : -
Target : -
Stop : -
New strategy :
Buy at 114.20, Target: 115.20, Stop: 113.85
Position : -
Target : -
Stop : -
Yesterday’s rally after finding renewed buying interest at 113.61 signals the rise from 111.69 is still in progress and may extend further gain to previous chart resistance at 114.96, however, break there is needed to signal early erratic rise from 111.59 low has resumed and extend gain towards another previous resistance at 115.38 but price should falter below previous resistance at 115.62, bring retreat later.
In view of this, we are looking to buy dollar on pullback as 114.15 (previous resistance now support) should limit downside and bring another rise later. Below 113.95 support would signal an intra-day top is formed instead, risk weakness towards said strong support at 113.56-61 which is likely to hold from here.
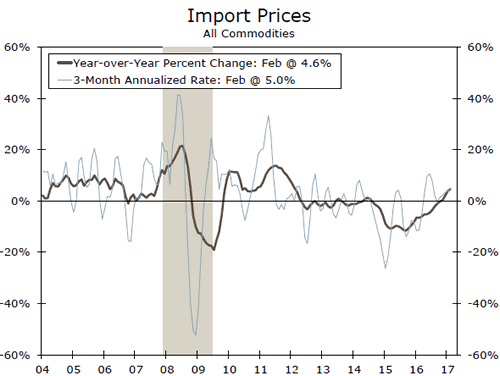
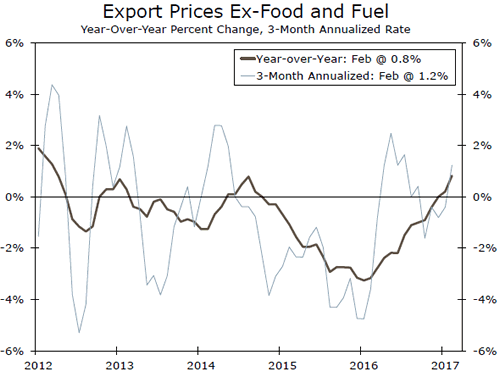
Import Price Pressures Continue to Gradually Firm
Reflation in the U.S. is being supported by a gradual firming in import prices. Import prices rose 0.2 percent in February, but unlike recent months, the gain was driven by nonfuel prices. Export prices were also up.
Reflation Help From Abroad
- For a second consecutive month, import prices rose a bit more than expected, while previous gains were revised upward. Import prices rose 0.2 percent in February, bringing the yearover- year rate to 4.6 percent—the strongest 12-month gain since 2012.
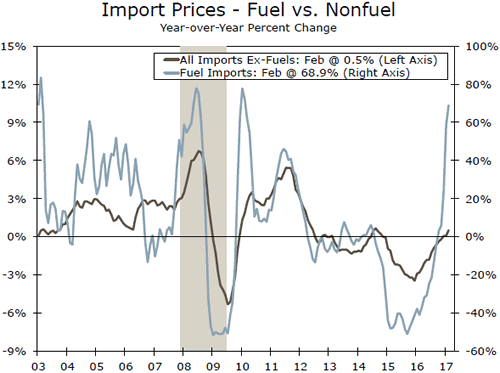
- Unlike the past two months, the gain was not driven by rising energy prices; petroleum prices slipped 0.7 percent.
Exporters Get Some Pricing Power
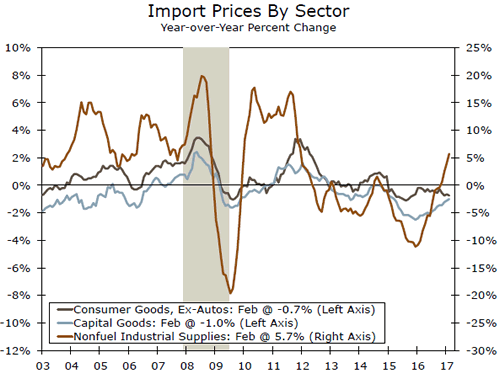
- Excluding fuel, import prices rose 0.3 percent on the back of higher prices for imported consumer goods (ex-autos) and nonfuel industrial supplies.
- Exporters gained some pricing power last month with total export prices up 0.3 percent. Excluding food and fuel, prices were up an even stronger 0.5 percent, led by gains in capital goods and industrial supplies.
USD/CAD Climbs to 2017 High, Canadian Employment Change Next
USD/CAD has edged upwards in the Thursday session. In North American trade, the pair is trading at the 1.35 line. On the release front, Canadian NHPI remained unchanged at 0.1%, matching the forecast. In the US, unemployment claims climbed to 243 thousand, higher than the forecast of 239 thousand. On Friday, the spotlight is on employment data on both sides of the border. In the US, today's key event is unemployment claims, with the markets expecting the indicator to climb to 239 thousand. On Friday, employment numbers will again be in the spotlight. The US will release three key indicators – Nonfarm Payrolls, Average Hourly Earnings and the unemployment rate. Canada will publish Employment Change and the unemployment rate.
Canada's employment market has improved in recent months, buoyed by strong employment gains. The economy added 48.3 thousand jobs and 53.7 thousand jobs in December and January respectively. This surprised the markets, which had predicted declines for each reading. The unemployment rate has also improved, dropping to 6.8%. A strong US economy has been good news for Canada, which is heavily dependent on its southern neighbor. At the same time, speculation of an imminent rate hike by the Fed has boosted the US dollar, which has jumped 2.5% against the Canadian currency since the end of February. USD/CAD has pushed above the 1.35 line, as the pair has hit a high for 2017.
After raising rates in December, the Fed appears ready to make a March move. The odds of a March hike continue to climb, and are currently at 88% percent, according to the CME Group. Fed policymakers have been dropping hints of a March move, and a red-hot labor market and higher inflation levels present further arguments in favor higher rates. Earlier in the year, the Fed had said that it wanted to wait until it had a clearer idea of President Trump's economic policy before it tightened monetary policy. However, Trump has not backed up his promises to reform the tax code and increase fiscal spending with any details. Some Fed policymakers wanted to raise rates earlier this year, so Fed Chair Yellen is under pressure to make a move, and it appears virtually certain that the Fed will raise rates by a quarter-point on March 15.
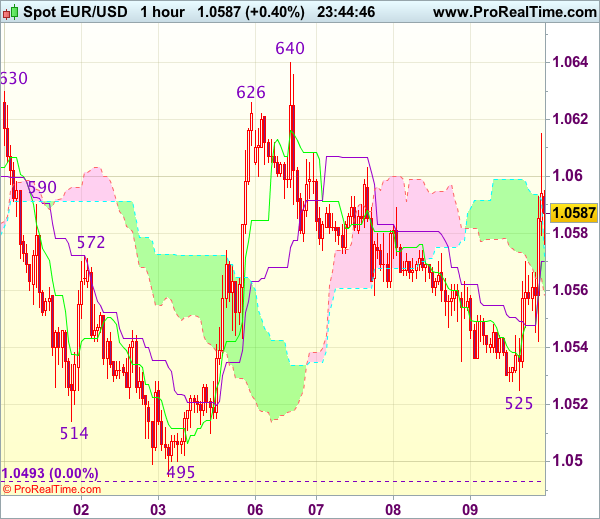
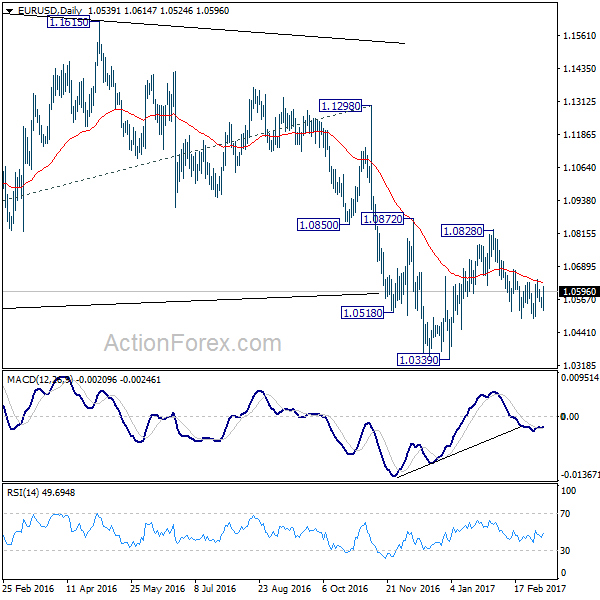
EUR/USD Mid-Day Outlook
Daily Pivots: (S1) 1.0524; (P) 1.0549 (R1) 1.0564; More.....
EUR/USD rebounds after initial dip today. But still it's bounded in range of 1.0493/1.0630. Hence, intraday bias remains neutral first. On the downside, below 1.0493 support will affirm the case that fall from 1.0828 is resuming the larger down trend. In that case, intraday bias will be back to the downside for resting 1.0339 low. On the upside, firm break of 1.0630 resistance will argue that pull back from 1.0828 is completed. Also, rise from 1.0339 could possibly be resuming. In that case, intraday bias will be turned back to the upside for 1.0828 resistance and above.
In the bigger picture, whole down trend from 1.6039 (2008 high) is in progress. Such down trend is expected to extend to 61.8% projection of 1.3993 to 1.0461 from 1.1298 at 0.9115. On the upside, break of 1.1298 resistance is needed to confirm medium term bottoming. Otherwise, outlook will stay bearish in case of rebound.
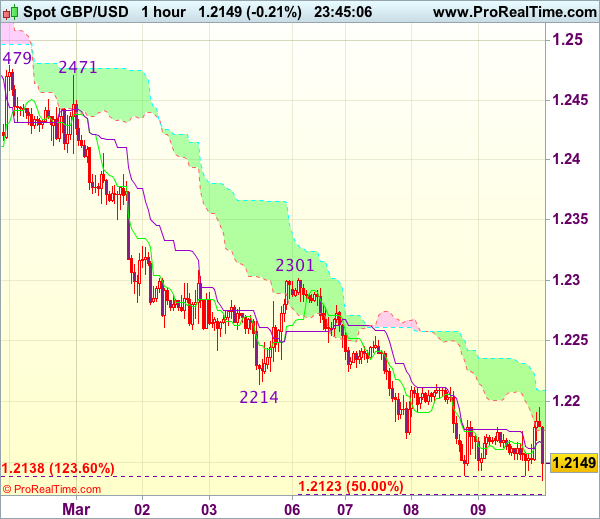
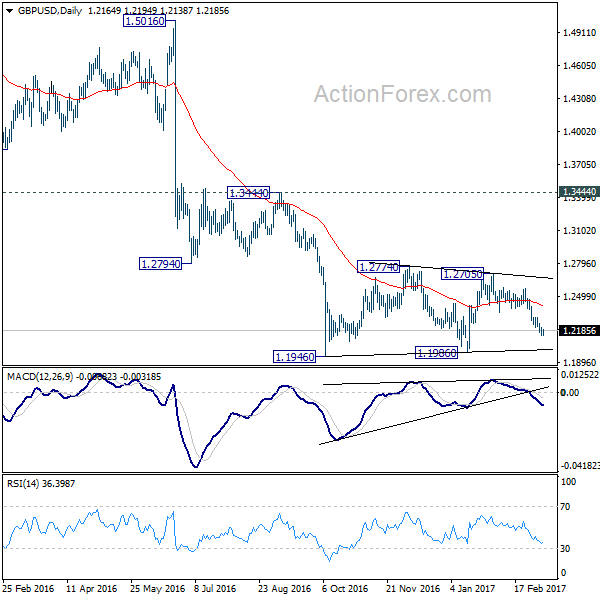
GBP/USD Mid-Day Outlook
Daily Pivots: (S1) 1.2132; (P) 1.2173; (R1) 1.2207; More...
GBP/USD lose some downside momentum as seen in 4 hour MACD. But intraday bias stays on the downside with 1.2213 minor resistance intact. Current decline should target 1.1946/86 key support zone next. As noted before, consolidation pattern from 1.1946 should have completed with three waves to 1.2705 already. Break of 1.1946 will confirm our bearish view and resume the larger down trend. On the upside, above 1.2213 minor resistance will turn bias neutral and bring recovery. But outlook will remain cautiously bearish as long as 1.2346 support turned resistance holds.
In the bigger picture, fall from 1.7190 is seen as part of the down trend from 2.1161. There is no sign of medium term bottoming yet. Sustained trading below 61.8% projection of 2.1161 to 1.3503 from 1.7190 at 1.2457 will target 100% projection at 0.9532. Overall, break of 1.3444 resistance is needed to confirm medium term bottoming. Otherwise, outlook will remain bearish.
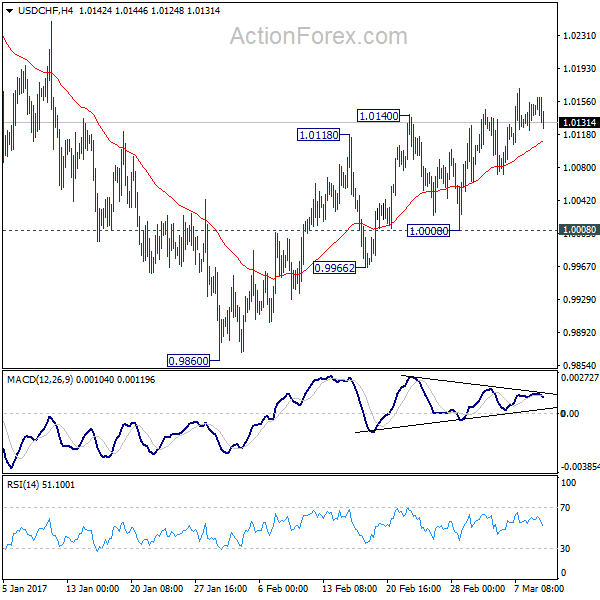
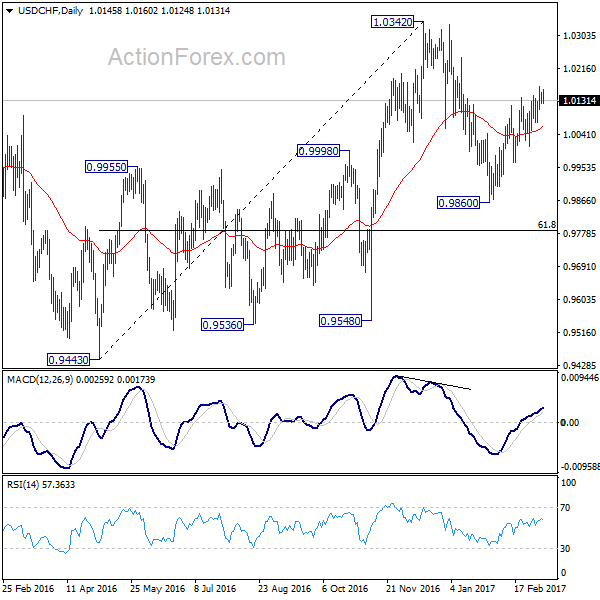
USD/CHF Mid-Day Outlook
Daily Pivots: (S1) 1.0127; (P) 1.0141; (R1) 1.0159; More.....
Upside momentum in USD/CHF is so far unconvincing. But with 1.0008 support intact, further rally is still expected. Rebound from 0.9860 would target a test on 1.0342 key resistance level. As noted before, based on neutral medium term outlook, we'd be cautious on topping at around 1.0342. On the downside, break of 1.0008, however, will indicate completion of the rebound from 0.9860. And intraday bias will be turned back to the downside for 0.9860.
In the bigger picture, prior rejection from 1.0327 resistance argues that USD/CHF is staying in a medium term sideway pattern. In any case, decisive break of 1.0342 resistance is needed to confirm underlying strength. Otherwise, we'll stay neutral in the pair first. In case of another fall, we'd expect strong support from 0.9443/9548 support zone. Meanwhile firm break of 1.0342 will target 38.2% retracement of 1.8305 to 0.7065 at 1.1359.
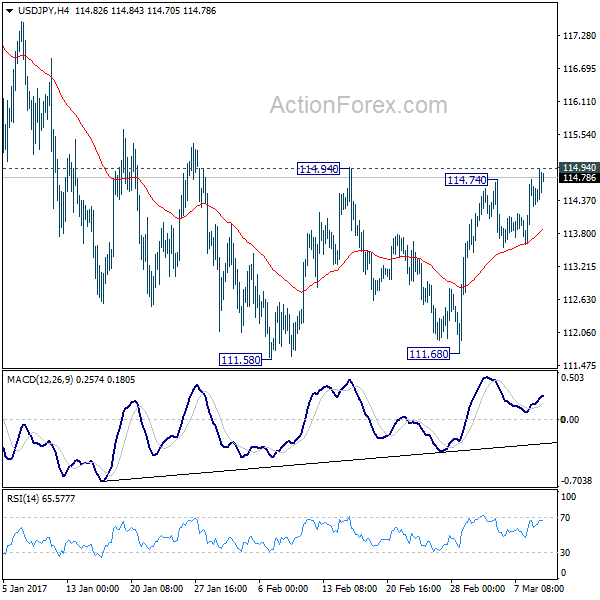
USD/JPY Mid-Day Outlook
Daily Pivots: (S1) 113.73; (P) 114.25; (R1) 114.89; More...
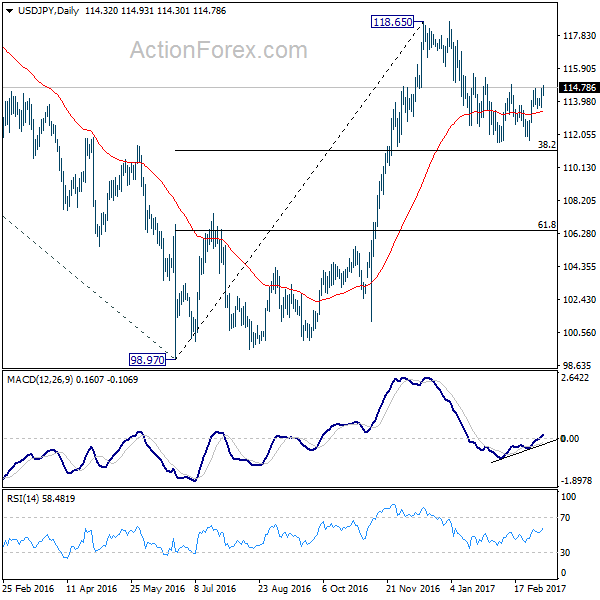
USD/JPY breaches 114.74 in early US session but stays below 114.94 resistance. Intraday bias remains neutral first. On the upside, decisive break of 114.94 resistance should confirm completion of the corrective pull back from 118.65. This would be supported by a double bottom pattern (111.58, 111.68). In such case, intraday bias will be turned to the upside for retesting 118.65. In case of another decline, we'd still expect strong support from 38.2% retracement of 98.97 to 118.65 at 111.13 to contain downside and bring rebound.
In the bigger picture, price actions from 125.85 high are seen as a corrective pattern. The impulsive structure of the rise from 98.97 suggests that the correction is completed and larger up trend is resuming. Decisive break of 125.85 will confirm and target 61.8% projection of 75.56 to 125.85 from 98.97 at 130.04 and then 135.20 long term resistance. Rejection from 125.85 and below will extend the consolidation with another falling leg before up trend resumption.