Sample Category Title
EUR/USD: ECB Leaves Monetary Policy On Hold
For the 24 hours to 23:00 GMT, the EUR rose 0.36% against the USD and closed at 1.0577, after the European Central Bank (ECB) President, Mario Draghi, struck a more optimistic tone on the Euro-zone’s economic recovery.
The ECB, in its latest monetary policy meeting, left the key interest rate unchanged at 0.00%, as widely expected and pledged to keep its unprecedented stimulus in place at least until the end of the year. In a post meeting statement, the ECB President, Mario Draghi, stated that the governing council does not expect to loosen monetary policy further to prop-up growth and inflation in the common currency region. Additionally, the central bank raised its forecasts for economic growth and inflation for this year and next, and now expects growth of 1.8% in 2017 and 1.7% in 2018, compared with earlier forecasts of 1.7% and 1.6%, respectively. Also, the bank sharply raised its inflation projection for this year to 1.7%, from 1.3% estimated in December.
In the US, data indicated that new claims for jobless benefits advanced more-than-expected to a level of 243.0K in the week ended 04 March 2017, compared to a reading of 223.0K in the previous week, while markets anticipated it to advance to a level of 238.0K. Moreover, the nation’s export price index rose more-than-anticipated by 0.3% MoM in February, compared to a revised gain of 0.2% in the prior month. Also, the import price index increased more-than-estimated by 0.2% on a monthly basis in February, after rising by a revised 0.6% in the previous month.
In the Asian session, at GMT0400, the pair is trading at 1.0594, with the EUR trading 0.16% higher against the USD from yesterday’s close.
The pair is expected to find support at 1.0540, and a fall through could take it to the next support level of 1.0485. The pair is expected to find its first resistance at 1.0632, and a rise through could take it to the next resistance level of 1.0669.
Looking ahead, investors will concentrate on Germany’s trade balance figures for January, scheduled to release in a few hours. Moreover, traders would eye crucial economic releases in the US, consisting of non-farm payrolls and unemployment rate, both for February along with monthly budget statement for February, slated to release later today.
The currency pair is trading above its 20 Hr and 50 Hr moving averages.

GBP/USD: Pound Trading A Tad Higher, Ahead Of Key Economic Releases In The UK
For the 24 hours to 23:00 GMT, the GBP declined 0.12% against the USD and closed at 1.2153.
In the Asian session, at GMT0400, the pair is trading at 1.2159, with the GBP trading slightly higher against the USD from yesterday’s close.
The pair is expected to find support at 1.2130, and a fall through could take it to the next support level of 1.2102. The pair is expected to find its first resistance at 1.2191, and a rise through could take it to the next resistance level of 1.2224.
Going ahead, market participants will closely monitor UK’s total trade balance as well as industrial and manufacturing production data, all for January, all slated to release in a few hours.
The currency pair is showing convergence with its 20 Hr and 50 Hr moving averages.

USD/JPY: Japanese Yen Trading On A Weaker Footing This Morning
For the 24 hours to 23:00 GMT, the USD rose 0.56% against the JPY and closed at 115.08.
In the Asian session, at GMT0400, the pair is trading at 115.18, with the USD trading 0.09% higher against the JPY from yesterday's close.
Overnight data showed that Japan's BSI large manufacturing industries index climbed less-than-expected to a level of 1.1 on a quarterly basis in 1Q 2017, following a gain of 7.5 in the prior quarter.
The pair is expected to find support at 114.60, and a fall through could take it to the next support level of 114.01. The pair is expected to find its first resistance at 115.51, and a rise through could take it to the next resistance level of 115.83.
Investors would shift their attention to Bank of Japan's interest rate decision along with Japan's tertiary industry index and industrial production data, all due next week.
The currency pair is trading above its 20 Hr and 50 Hr moving averages.

USD/CHF: Switzerland’s Unemployment Rate Remained Steady In February
For the 24 hours to 23:00 GMT, the USD declined 0.24% against the CHF and closed at 1.0124.
Macroeconomic data revealed that Switzerland's seasonally adjusted unemployment rate remained unchanged at 3.3% in February, meeting market expectations.
In the Asian session, at GMT0400, the pair is trading at 1.0115, with the USD trading 0.09% lower against the CHF from yesterday's close.
The pair is expected to find support at 1.0080, and a fall through could take it to the next support level of 1.0046. The pair is expected to find its first resistance at 1.0155, and a rise through could take it to the next resistance level of 1.0196.
Moving ahead, investors will keep a close watch on Swiss National Bank's (SNB) interest rate decision, due to be announced next week.
The currency pair is trading below its 20 Hr and 50 Hr moving averages.

USD/CAD: Canada’s New House Price Index Climbed As Expected In January
For the 24 hours to 23:00 GMT, the USD rose 0.13% against the CAD and closed at 1.3509.
On the economic front, Canada's new housing price index advanced 0.1% in January, in line with market anticipations and compared to a similar rise in the prior month.
In the Asian session, at GMT0400, the pair is trading at 1.3498, with the USD trading 0.08% lower against the CAD from yesterday's close.
The pair is expected to find support at 1.3473, and a fall through could take it to the next support level of 1.3449. The pair is expected to find its first resistance at 1.3528, and a rise through could take it to the next resistance level of 1.3559.
This afternoon will bring an important Canadian release, namely unemployment rate for February.
The currency pair is trading between its 20 Hr and 50 Hr moving averages.

Will NZD/USD Daily Support Hold For Longs?
A clear as day NZD/USD support level to end a busy week for us here in the Vantage FX office.
We had been shorting NZD/USD off this major resistance level, but the question now has to be asked whether the shorts will run out of steam own here.
NZD/USD Daily:
You don’t really get much clearer daily levels than this, with each touch followed by big rejections in both directions.
Interestingly enough, you can see the time that the level was broken right in the middle of that chart, price absolutely hammered through it without even the hint of a pullback.
Levels are there to be broken and just because they have been broken before, doesn’t invalidate them or give reason to ignore them in the future.
NZD/USD Hourly:
Now we wait to see if the higher time frame support level holds and from there we can zoom into the hourly chart and look to long any pullbacks that coincide with short term retests.
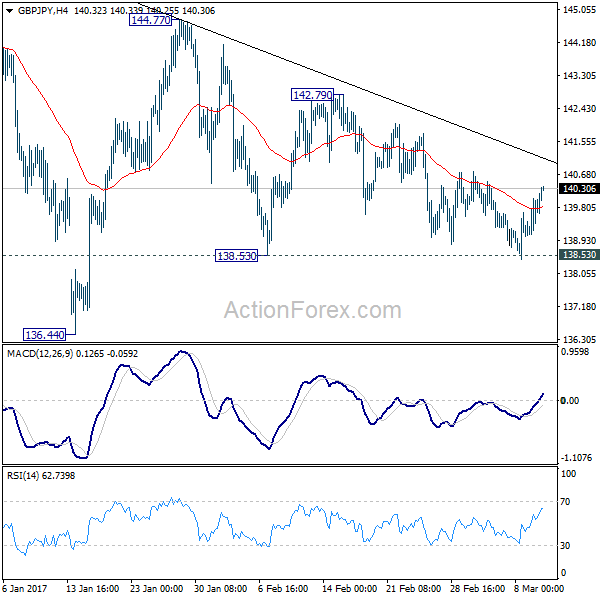
GBP/JPY Daily Outlook
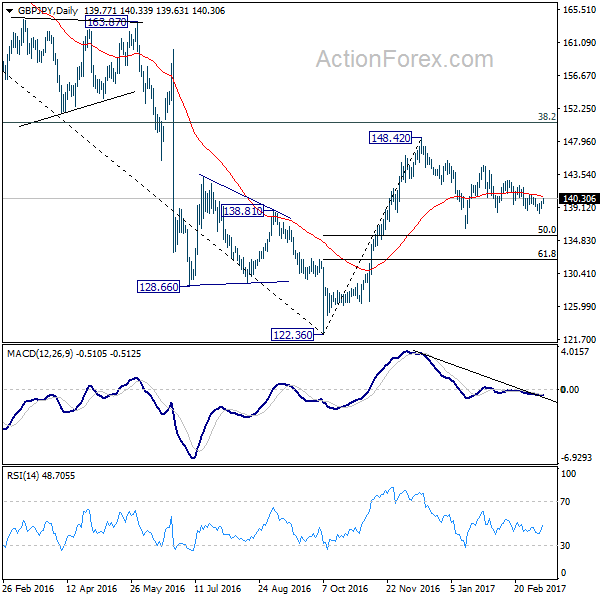
Daily Pivots: (S1) 139.19; (P) 139.60; (R1) 140.20; More...
GBP/JPY breached 138.53 support briefly but quickly recovered. As it's staying in range of 138.53/142.79, intraday bias remains neutral first. Price actions from 148.42 are seen as a corrective pattern. Break of 138.53 support will bring deeper decline to 136.44 support and possibly below. However, we'd expect strong support at 50% retracement of 122.36 to 148.42 at 135.39 to bring rebound. On the upside, above 142.79 will turn bias back to the upside for 144.77 and above.
In the bigger picture, price actions from 122.36 medium term bottom are still seen as a corrective pattern. Main focus is on 38.2% retracement of 195.86 to 122.36 at 150.42. Rejection from there will turn the cross into medium term sideway pattern with a test on 122.36 low next. Though, sustained break of 150.42 will extend the rebound towards 61.8% retracement at 167.78.
EUR/JPY Daily Outlook
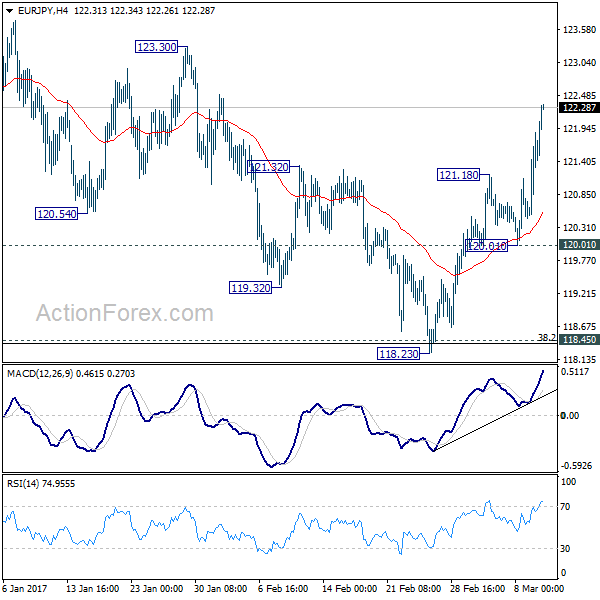
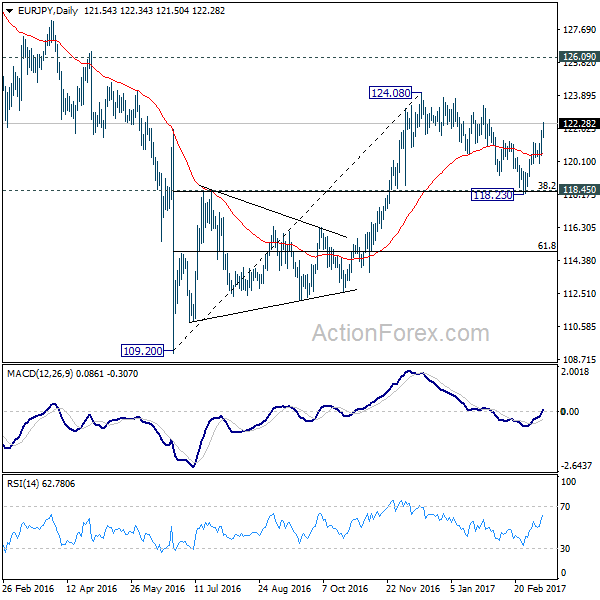
Daily Pivots: (S1) 120.01; (P) 120.56; (R1) 121.11; More...
EUR/JPY's rise from 118.23 accelerates to as high as 122.34 so far today and intraday bias remains on the upside. As noted before, corrective fall from 124.08 has completed at 118.23 after defending 118.45 cluster support (38.2% retracement of 109.20 to 124.08 at 118.39). Rise from there should target a test on 123.30/124.08 resistance zone. Break will extend larger rally from 109.20 to next key resistance at 126.09. On the downside, below 121.18 minor support will turn intraday bias neutral first. But pull back should be contained above 120.01 support and bring another rally.
In the bigger picture, price actions from 109.20 medium term bottom are seen as part of a medium term corrective pattern from 149.76. Strong rebound from 118.45 resistance turned support suggests that it's still in progress. Break of 124.08 will target 126.09 key resistance level. We'd be cautious on strong resistance there to limit upside. However, sustained break there will be a strong sign of medium term momentum and could target 141.04 resistance next.
Daily Technical Outlook And Review
A note on lower timeframe confirming price action...
Waiting for lower timeframe confirmation is our main tool to confirm strength within higher timeframe zones, and has really been the key to our trading success. It takes a little time to understand the subtle nuances, however, as each trade is never the same, but once you master the rhythm so to speak, you will be saved from countless unnecessary losing trades. The following is a list of what we look for:
- A break/retest of supply or demand dependent on which way you're trading.
- A trendline break/retest.
- Buying/selling tails ... essentially we look for a cluster of very obvious spikes off of lower timeframe support and resistance levels within the higher timeframe zone.
- Candlestick patterns. We tend to only stick with pin bars and engulfing bars as these have proven to be the most effective.
EUR/USD
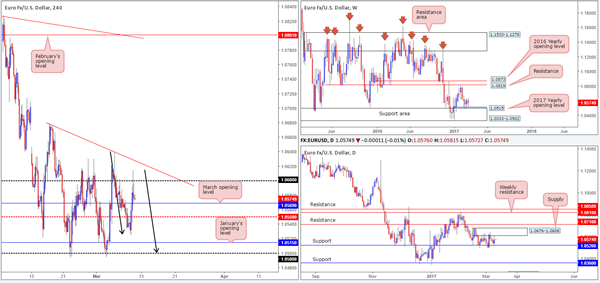
Following a somewhat hopeful ECB press conference on Thursday, the single currency gravitated higher. As you can see though the rally was a relatively short-lived on as price failed to sustain gains beyond the 1.06 handle, and ended the day closing just ahead of the March opening level at 1.0569. Assuming that the bears continue to stamp in their authority today, this monthly level along with the nearby H4 mid-way support at 1.0550 will likely be taken out.
On the whole, this pair has been consolidating since 22nd Feb amid a daily supply at 1.0676-1.0608 and a daily support drawn from 1.0520. Overhead on the weekly chart, nevertheless, we can see that price remains bolstered by a weekly support area at 1.0333-1.0502 and nearby 2017 yearly opening level at 1.0515.
Our suggestions: Based on the above points, our team still has their eye on the 1.05/1.0520 barrier. The area, as far as we can see, boasts the following converging structures: a round number at 1.05, a daily support at 1.0520, a potential symmetrical H4 AB=CD formation completing just ahead of 1.05, the 2017 yearly opening level at 1.0515 as well as collectively being reinforced by the weekly support area at 1.0333-1.0502. In spite of this, we would not be comfortable trading from here without additional lower-timeframe confirmation (see the top of this report) seeing as how the area has been tested twice already.
Data points to consider: US employment report at 1.30pm GMT.
Levels to watch/live orders:
- Buys: 1.05/1.0520 ([wait for a lower-timeframe signal to form before looking to pull the trigger] stop loss: dependent on where one confirms the zone).
- Sells: Flat (stop loss: N/A).
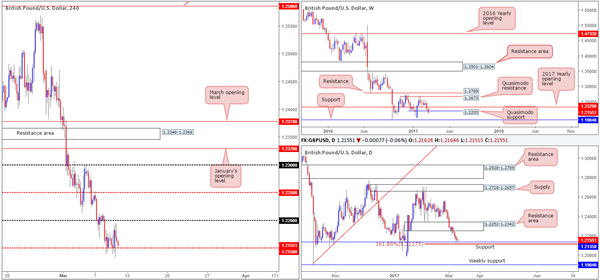
GBP/USD
As can be seen from the H4 chart this morning, the pair spent yesterday's sessions teasing the H4 mid-way support level coming in at 1.2150. Perhaps the most compelling factor here is that this level is joined closely by the daily support barrier seen at 1.2135, which also happens to be positioned just ahead of a daily AB=CD 161.8% Fib ext. at 1.2111 (taken from the high 1.2706). Although these structures establish a relatively solid band of support, it might be worth noting that weekly action recently slipped below a weekly Quasimodo support at 1.22.
As mentioned in yesterday's report, we would not feel comfortable buying this market until we see a H4 close back above the 1.22 handle. This would not only confirm buyer strength, it would also likely open up the doors to the H4 mid-way resistance 1.2250 which denotes the underside of a daily resistance area at 1.2252.
Our suggestions: All in all, we do not see a lot to hang one's hat on at the moment. Even with a H4 close above 1.22, there is not a lot of room for this unit to advance unless one, of course, is able to pin down a setup which requires a reasonably small stop! With that being said, we'll remain flat for the time being and reassess post NFP.
Data points to consider: UK manufacturing at 9.30am. US employment report at 1.30pm GMT.
Levels to watch/live orders:
- Buys: Flat (stop loss: N/A).
- Sells: Flat (stop loss: N/A).
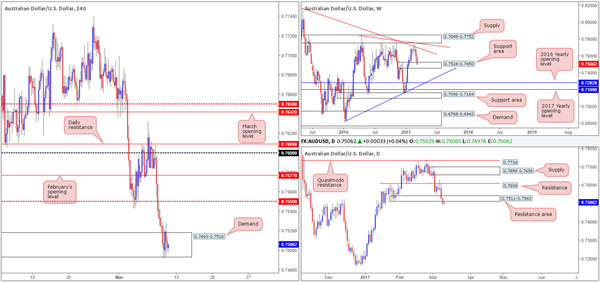
AUD/USD
For those who read yesterday's report you may recall our team mentioning that should a reasonably sized H4 bull candle be seen within the walls of the current H4 demand base at 0.7493-0.7518, we would consider entering long. As you can see, such a candle did present itself going into the US open. We bought at the close (0.7520) and placed our stop below the candle low at 0.7489. We are, as you can see, currently in drawdown and going by the recent daily close beyond daily demand at 0.7511-0.7543 (now considered a resistance area); we may take a small loss here. On a positive note, however, weekly price remains trading within a weekly support area at 0.7524-0.7450.
Our suggestions: Given that our desk is already involved in this market, we will be monitoring how H4 price behaves going into the US employment report later on today. Ultimately, we do not want to run the risk of having the market jump below our stop and magnify losses. As such, we may look to close out this position before our stop is hit.
Data points to consider: US employment report at 1.30pm GMT.
Levels to watch/live orders:
- Buys: 0.7520 ([live] stop loss: 0.7489).
- Sells: Flat (stop loss: N/A).
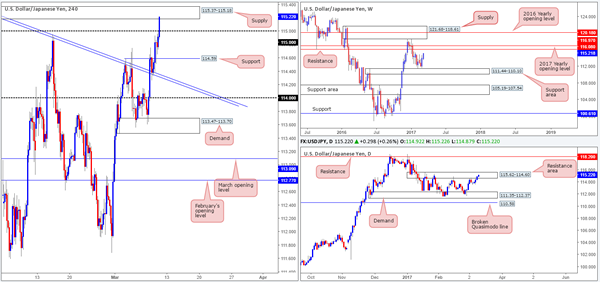
USD/JPY
Kicking this morning's report off with a look at the weekly timeframe, it's clear that the bulls are currently in the driving seat for the time being. The next upside hurdle to have noted can be seen around the weekly resistance level fixed at 116.08. Despite the weekly bulls displaying strength at the moment, daily price is seen trading within the walls of a daily resistance area at 115.62-114.60 (capped upside since mid-Jan 2017). In conjunction with the daily chart, the H4 candles also recently entered into the jaws of a H4 supply zone coming in at 115.37-115.18. However, shorting from this base is challenging owing to the nearby psychological boundary seen directly below at 115.
Our suggestions: We would not consider becoming sellers in this market until a H4 close below 115 has taken shape. The next H4 support target on tap beyond this number is seen relatively nearby at 114.59 – a mere 40 pips to play with. Therefore, unless you're able to pin down a lower-timeframe setup to short beyond 115 that requires a stop of no more than 20 pips, it would not likely be worth trying to short given the risk/reward. On the buy side of this market, we will not look to become buyers in this market today. Ideally, a daily close above the current daily resistance area will need to be seen beforehand.
Data points to consider: US employment report at 1.30pm GMT.
Levels to watch/live orders:
- Buys: Flat (stop loss: N/A).
- Sells: Flat (stop loss: N/A).
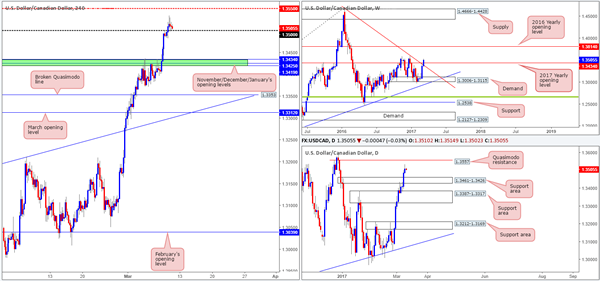
USD/CAD
US dollar bulls closed higher for a fourth consecutive day in recent trading, consequently placing the daily candles within striking distance of the daily Quasimodo resistance line at 1.3557. Looking over to the H4 chart, the pair is now seen retesting the 1.35 handle as support which could potentially be enough to fuel an advance up to the H4 mid-way resistance line at 1.3550 (located seven pips below the aforementioned daily Quasimodo resistance). While we are very interested in selling from the daily Quasimodo level, we are at the same time also a little concerned having seen weekly action break above the 2017 yearly opening level at 1.3434/long-term weekly trendline resistance extended from the high 1.4689.
Our suggestions: In the event that H4 price remains supported by 1.35 and manages to print a lower-timeframe confirming buy signal (see the top of this report), we would look to buy this unit intraday and target 1.3550. On the assumption that this setup comes to fruition, we may also consider shorting from the 1.3550 region. This, however, will depend on the time of day and also if price is able to chalk in a reasonably sized H4 bearish candle.
Data points to consider: US/Canadian employment change at 1.30pm GMT.
Levels to watch/live orders:
- Buys: 1.35 region ([wait for a lower-timeframe signal to form before looking to pull the trigger] stop loss: dependent on where one confirms the zone).
- Sells: 1.3550 region ([wait for a reasonably sized H4 bearish close to form before looking to pull the trigger] stop loss: ideally beyond the trigger candle).
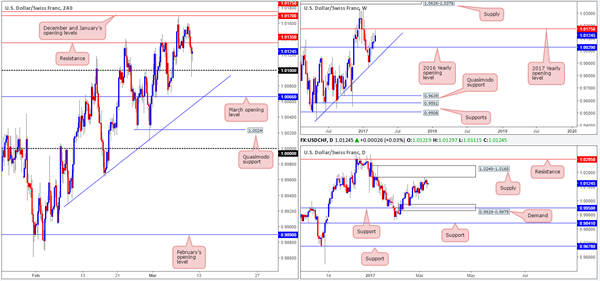
USD/CHF
During the course of yesterday's sessions, the 1.01 psychological handle was brought into the picture and has, as you can see, held firm as support. Despite this, we see very little to hang our hat on looking at H4 structure. Price is currently capped between 1.01 and a nearby H4 resistance level drawn from 1.0135.
Looking over to the bigger picture, weekly action shows price found resistance a few pips ahead of the 2017 yearly opening level at 1.0175 earlier this week. Along the same vein, daily price also recently clipped the underside of a daily supply zone coming in at 1.0248-1.0168 (encapsulates the aforementioned 2017 yearly opening base).
Our suggestions: According to the higher timeframes, further selling could be at hand. A violation of the 1.01 level would likely stimulate a continuation move south down to the March opening level at 1.0066 (converges with a H4 trendline support taken from the low 0.9929). As we're sure you'll agree, this does not leave one a lot of room to play with! With that being the case, and considering the fact that we have the mighty NFP just around the corner, we will remain on the sidelines for the time being.
Data points to consider: US employment report at 1.30pm GMT.
Levels to watch/live orders:
- Buys: Flat (stop loss: N/A).
- Sells: Flat (stop loss: N/A).
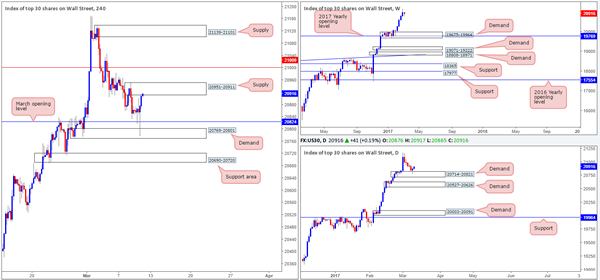
DOW 30
In recent trading, we saw the DOW aggressively spike through the March opening level at 20824 and tag in fresh bids from a H4 demand area coming in at 20769-20801. The move from this area was, as you can probably see, also bolstered by a daily demand zone at 20714-20821 which happens to smother the aforementioned H4 demand area. Despite daily price trading from a daily demand barrier, the H4 chart shows the unit is currently testing the underside of a H4 supply area formed from 20951-20911.
Our suggestions: Essentially, we will not look to become buyers in this market until H4 price takes out the 21000 resistance. A H4 close above this number, followed with a retest and a reasonably sized H4 bullish candle would, in our opinion, be enough to justify a long position here, targeting the H4 supply seen overhead at 21139-21101 and quite possibly beyond.
Data points to consider: US employment report at 1.30pm GMT.
Levels to watch/live orders:
- Buys: Watch for price to engulf 21000 and then look to trade any retest seen thereafter (waiting for a lower-timeframe confirming signal to form following the retest is advised] stop loss: dependent on where one confirms the level).
- Sells: Flat (stop loss: N/A).
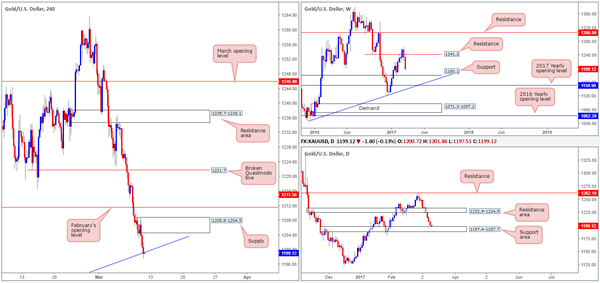
GOLD
The gold market has really been hit hard this week, losing almost $35 in value! In spite of this, we may see the yellow metal recover some of its losses today. From a technical standpoint, weekly price does show that the unit could possibly trade down to 1180.1: a weekly support level. On the other hand though, daily action recently tested the top edge of a daily support area drawn in at 1197.4-1187.7. Along the same vein, the H4 candles also connected with a H4 trendline support extended from the low 1170.8.
As of yet, there's been very little buyer intent registered from this H4 trendline. Should the buyers regain consciousness here, there's a chance we could see price tag the overhead H4 supply area at 1208.8-1204.5. Conversely, a break below the current H4 trendline could lead to further selling down to the H4 support logged at 1187.7 (denotes the lower edge of our daily support zone).
Our suggestions: Given the conflicting signals seen from the weekly and daily timeframes, this is a difficult market to judge. Essentially, neither a long nor short seems attractive. Personally, we may just hang fire for the moment, let the NFP do its thing, and look to reassess post the event.
Levels to watch/live orders:
- Buys: Flat (stop loss: N/A).
- Sells: Flat (stop loss: N/A).
EUR/USD 78.6% Bounce And USD/JPY Break Above 115
Currency pair USD/JPY
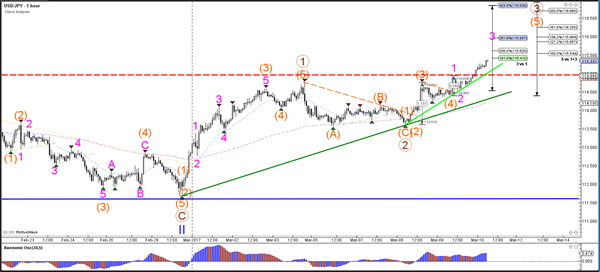
The USD/JPY broke above the resistance top (dotted red) of the wave 1 (blue), which could start the wave 3 (brown) of wave 3 (blue). Price needs to reach at least the 161.8% Fibonacci target before the wave 3 can be confirmed.
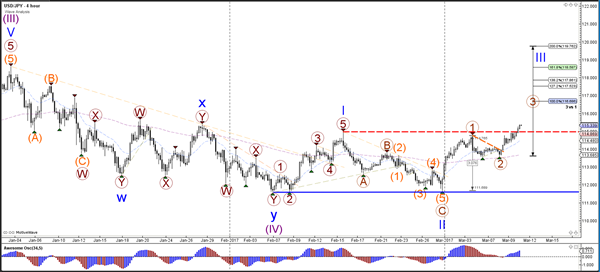
The USD/JPY keeps pushing with higher highs and price seems to be extending the wave 5 (orange) with 5 internal waves (magenta/pink). Once the wave 3 (magenta) is completed, then a corrective chart pattern such as a bull flag or contracting triangle must emerge to confirm wave 4 (magenta). A break of that pattern could lead to a wave 5 (magenta) of wave 5 (orange).
Currency pair EUR/USD
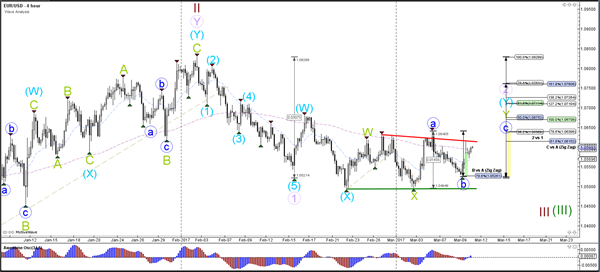
The EUR/USD indeed showed a bullish bounce at the 78.6% Fibonacci retracement level of wave B vs A (blue). Price is now approaching the resistance trend line (red) of the consolidation zone (red/green). A break above resistance (red) could see a test of the wave 2 Fibonacci levels (purple) although a break above the 100% level invalidates the wave structure. A failure to break resistance (red) could see expand within the consolidation (red/green).
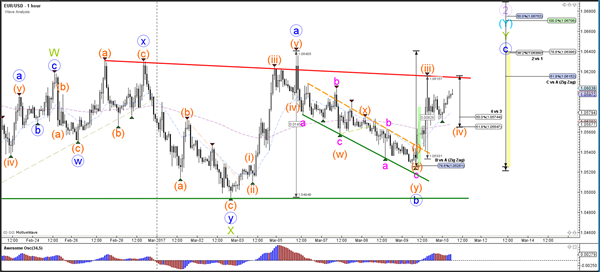
The EUR/USD could be in a bullish 5 wave pattern (orange) within wave C (blue). A break below the fractal at the 50% Fibonacci level of wave 4 vs 3 would invalidate this wave structure. A break above resistance (red) could see a fragile breakout towards the Fib levels.
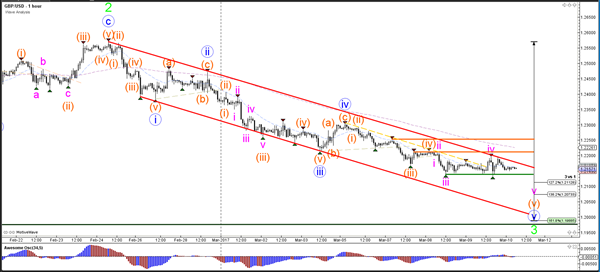
Currency pair GBP/USD
The GBP/USD broke above an inner resistance line (dotted orange) but remains in a downtrend channel (red lines). Price has both channel resistance (red) and horizontal resistance (orange) nearby. A bearish break below support (green) could see price move towards 1.20 which is a psychological round level, previous bottom (green) and 161.8% Fibonacci target.
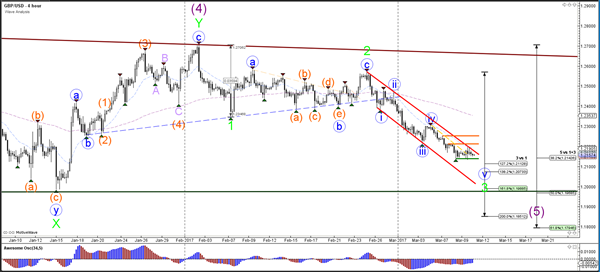
The GBP/USD remains bearish in my view as long as price stays below horizontal resistance levels (orange). The divergence between the bottoms could indicate that a bearish break of support (green) might lack strength but price could reach the bottom of the channel again.