
Sample Category Title
Will the US Jobs Report Seal the Deal a March Hike?
Today, the main event will be the release of the US employment report for February. Nonfarm payrolls are expected to have risen by 190k, less than the 227k in January, but still a solid number that is consistent with further tightening in the labor market. We see the risks surrounding the NFP forecast as skewed to the upside, considering that the ADP report for February showed the private sector added 297k jobs, far more than the anticipated 190k and that initial jobless claims were unusually low throughout the month. The unemployment rate is expected to have ticked down, while average hourly earnings are forecast to have accelerated on both a monthly and a yearly basis. This would be a sign that the softness in January's earnings was just an outlier, and coming on top of a robust NFP number, it may seal the deal for a March rate hike. The probability for a hike next week currently rests at 90% according to the Fed funds futures. In case the employment data are as strong as anticipated, or even better, that percentage could surge even further and thereby bring the dollar under renewed buying interest.
ECB: More optimistic, but still too early to debate tapering
The ECB kept its stimulus program unchanged yesterday, as was widely anticipated. In the accompanying statement, the Bank maintained its dovish forward guidance, reiterating that interest rates will remain at present or lower levels for an extended period of time, and that the Bank stands ready to increase its QE program in terms of size and/or duration if the outlook becomes less favorable.
The press conference following the decision had a more hawkish tilt though. Although President Draghi initially reminded investors that there is still no convincing upward trend in underlying inflation, he continued by pointing out that a dovish sentence from his introductory statement had been removed. The sentence said: "If warranted, to achieve its objective the Governing Council will act by using all the instruments available within its mandate". Draghi indicated this was removed to signal there is no longer that sense of urgency in taking further actions. Perhaps in an even more optimistic twist, the President said that the TLTRO loans are about to expire, and that there has been absolutely no discussion about having another round. He further indicated that the Council previously discussed dropping out the word "lower" from its guidance on interest rates. This may be one of the Bank's next moves.
In our view, these relatively hawkish comments from Draghi suggest that the days of aggressive ECB easing may be behind us. As a result, EUR/USD surged breaking above the 1.0570 (S1) barrier to hit resistance slightly below the 1.0630 (R1) hurdle, which is the upper bound of the sideways range the pair has been trading since the 17th of February. We believe that the euro could remain supported in the next few days, at least in the absence of incoming French polls showing that Le Pen is gaining ground on her rivals. However, we would avoid EUR/USD, considering that today's US jobs data could prove the trigger for a retreat. Investors may settle near the 1.0630 (R1) hurdle waiting for the report, and could push it lower in case of strong numbers, targeting once again the 1.0570 (S1) barrier as a support. A clear dip below that level is possible to open the way for the 1.0525 (S2) level. Instead, EUR/GBP may be a better proxy for potential near-term euro gains, given that the House of Commons could overturn the "soft Brexit" amendment that the House of Lords passed regarding a "meaningful vote" on the final Brexit deal.
As for the rest of today's highlights: During the European day, we get Norway's CPI data for February. The headline rate is forecast to have remained unchanged, while the core rate is expected to have ticked down. Although something like that could bring NOK under renewed selling interest, we doubt that it will have a material impact on the Norges Bank's neutral stance on policy.
From the UK, we get industrial production data for January, and from Germany, we get the trade balance for January.
We also get Canada's employment data for February. The consensus is for the unemployment rate to have held steady and for the net change in employment to have remained in positive territory, albeit marginally. We see the risks surrounding the unemployment rate forecast as skewed to the downside, and we see the case for the overall report to be stronger than expected. We base our expectations on the nation's Markit manufacturing PMI for the month, which showed the strongest increase in employment for 27 months. In case of a better than anticipated report, the Loonie could reverse some of its recent losses. Considering that the US and Canadian data are released at the same time, even in case the Canadian data notably beat expectations and USD/CAD declines, we would expect any such reaction to remain short-lived. The pair could pullback and challenge the 1.3460 (S1) support level, but we still see a short-term uptrend on the 4-hour chart. As such we expect such a retreat to encourage the bulls to initiate new positions and if they prove strong enough to overcome the 1.3530 (R1) level, they may target the key obstacle of 1.3600 (R2). Our view of further near term advances in this pair is also supported by the combination of a hawkish Fed, a dovish BoC, and the latest slide in oil prices. As for the bigger picture though, we prefer to wait for a clear close above 1.3600 (R2), a zone which was proven a strong resistance back in November and December, before we get confident on the resumption of the prevailing longer-term uptrend.
EUR/USD
Support: 1.0570 (S1), 1.0520 (S2), 1.0500 (S3)
Resistance: 1.0630 (R1), 1.0675 (R2), 1.0715 (R3)
USD/CAD
Support: 1.3460 (S1), 1.3425 (S2), 1.3380 (S3)
Resistance: 1.3530 (R1), 1.3600 (R2), 1.3660 (R3)
North Korea Raises US-China Tensions
The US and China are facing many conflicts this year given the more hawkish stance from the Trump Administration. While the risk of a trade war has gained the most attention (see the box below right for some of our recent research), another area of tension has moved to the forefront recently – the threat from North Korea.
On Monday 6 March, North Korea fired four or five missiles into Japanese waters in a response to ongoing annual US-South Korea joint military exercises, code-named Foal Eagle. The actions of North Korea are raising tensions in many ways in the region, not least between the US and China. Former US President Barack Obama highlighted North Korea as the most pressing foreign policy issue for Donald Trump in a meeting following the presidential election.
THAAD adds to US-China tensions
The rising nuclear threat from North Korea has given the US and South Korea a stronger case for taking defensive measures. They have accelerated the deployment of a US missile defence system called THAAD (Terminal High Altitude Area Defense) in South Korea. THAAD is a system that can shoot down ballistic missiles in their terminal phase. While both the US and South Korea maintain it is only for defensive measures, China is strongly opposed to the deployment, as the radars could potentially cover large parts of Chinese territory as well. China is now boycotting South Korean department store chain Lotte, as the company made a land swap deal with the government for the area where THAAD is deployed. China is also banning tourism to South Korea to hit back at them. A spokesperson for the Chinese Foreign Ministry Geng Shuang stated that ‘we will take steps to maintain our security interests' and urged the parties concerned to stop deployment and refrain from going too far along the wrong track.
Trade Idea Update: EUR/USD – Buy at 1.0560
EUR/USD - 1.0613
Original strategy :
Buy at 1.0560, Target: 1.0660, Stop: 1.0525
Position : -
Target : -
Stop : -
New strategy :
Buy at 1.0560, Target: 1.0660, Stop: 1.0525
Position : -
Target : -
Stop : -
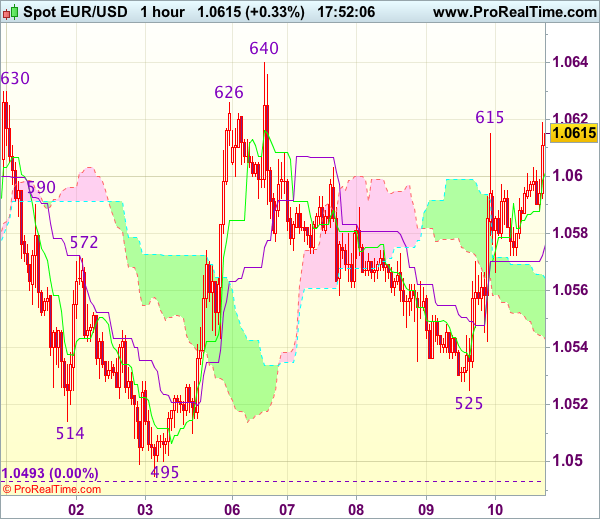
Yesterday’s strong rebound after finding support at 1.0525 suggests the retreat from 1.0640 has ended at 1.0525 and consolidation with mild upside bias is seen for further gain towards said resistance at 1.0640, however, break there is needed to retain bullishness and signal another leg of the erratic rise from 1.0493 low is underway for retracement of early decline to 1.0660-65 (50% Fibonacci retracement of 1.0829-1.0493) and possibly towards resistance at 1.0680 but price should falter well below 1.0700-05 (61.8% Fibonacci retracement).
In view of this, we are looking to buy euro on dips as 1.0560 should limit downside and bring another rise later. Below said support at 1.0525 would abort and risk test of 1.0493-96 but only break there would shift risk back to the downside and signal recent decline from 1.0829 has resumed for further selloff to 1.0470 and then towards previous support at 1.0454.
EUR/USD Rebounds And Trades Near 1.06
'Day two of our 48 hour run of heavy event risk is ahead. And, traders are no doubt hoping for more reaction to the March NFPs.' - John Kicklighter, Daily FX
Pair's Outlook
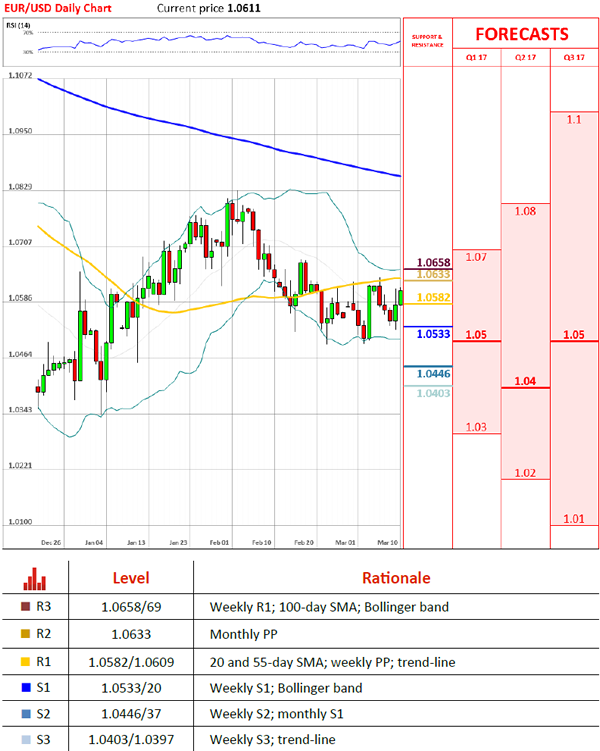
The common European currency traded near the 1.06 mark against the US Dollar on Friday morning. However, the rate showed signs of an upcoming retreat. The move higher was the throughout the week expected consolidation of the US Dollar, as the Greenback retreated. The jump of the rate was stopped by the upper trend line of the medium term descending channel, which is supported by the 55-day SMA at 1.0609 level. Due to that reason and the expected positive US fundamentals the rate is likely to decline during the day. However, the pair's decline will be hindered by the weekly PP at 1.0582.
Traders' Sentiment
SWFX traders are neutral on the pair, as 50% of open positions are long. Meanwhile, 58% of trader set up orders are set to sell the Euro.

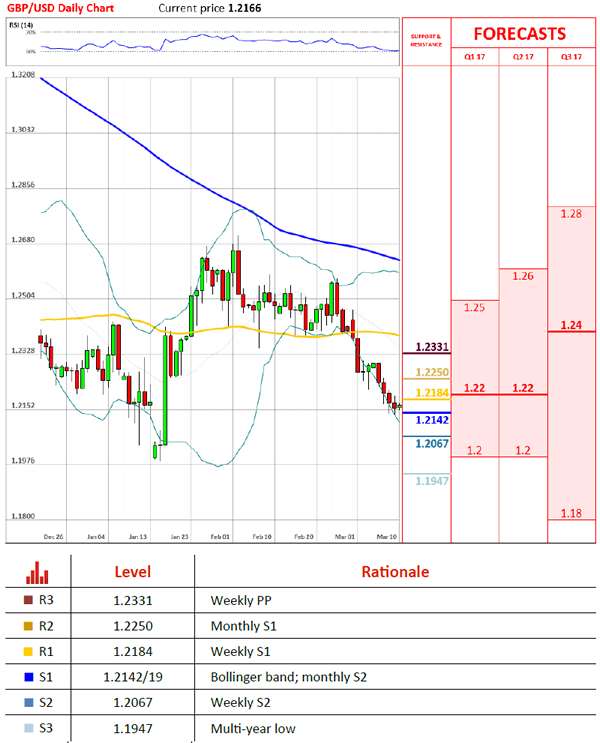
GBP/USD Seen Falling After US NFP
'We judge that expectations for a very strong non-farm payrolls and wages is very high so that the risk of disappointment is high.' – Commonwealth Bank of Australia (based on Market Watch)
Pair's Outlook
The Cable managed to retain its position on Thursday, as the lack of potential market movers contributed to relatively flat trade. Today everything depends on the US NFP data, a positive reading of which is to spark more bearish momentum and is likely to cause a drop below the immediate support , namely the monthly S2 and the lower Bollinger band. Consequently, the channel's lower boundary around 1.20 might even be put to the test. Technical indicators also suggest the Sterling is to suffer another loss today, but in case the NFP data surprises with a weaker reading the 1.23 mark is expected to be the intraday ceiling.
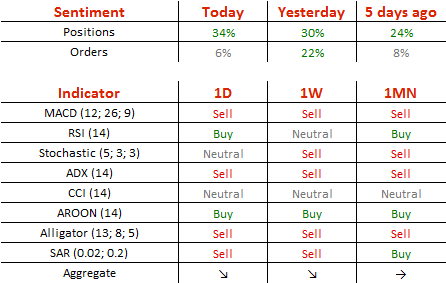
Traders' Sentiment
There are 67% of all open positions being long today, compared to 65% previously. The number of order to acquire the British Pound dropped over the day, namely from 61 to 53%.
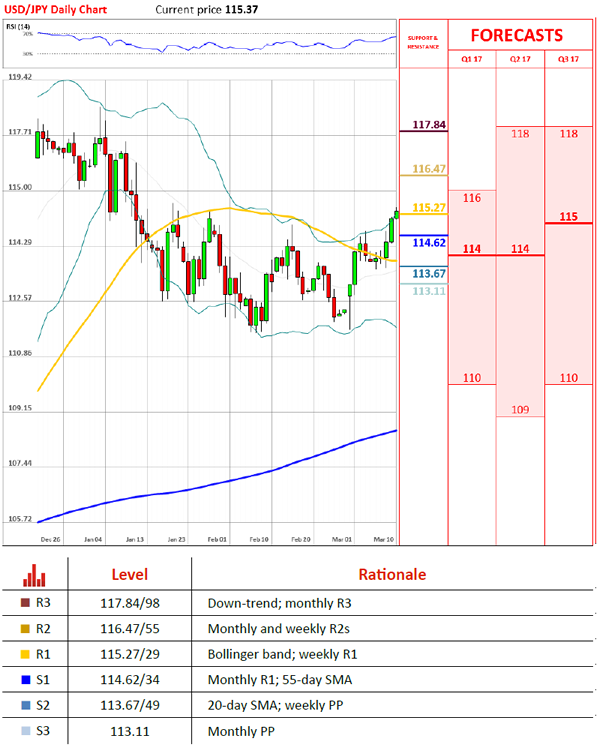
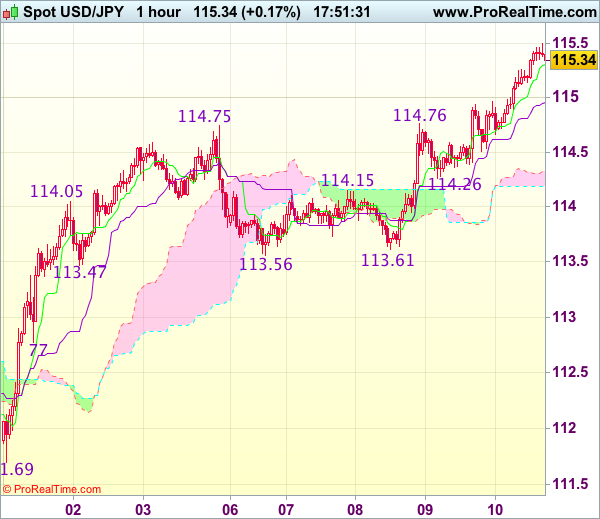
USD/JPY Retests Channel’s Resistance Line
'The dollar has risen as U.S. Treasury yields went up this week, but there appears to be some resistance on the upside around the middle of the 115-yen level.' – Mizuho Securities (based on Reuters)
Pair's Outlook
For the third consecutive day on Wednesday the US Dollar outperformed the Japanese Yen. The Buck itself overperformed, which caused the ascending channel's resistance line to be pierced. Consequently, the 115.00 mark was put to the test, but managed to contain the USD/JPY pair for the time being. However, a breach today is more than possible, as the upcoming NFP data is probably the most anticipated in comparison to all the readings in the last couple of years, as it would indicate whether Fed is to raise rates next week. A positive reading is to boost the Buck and could even push it beyond 116.00, while a disappointment might lead to a drop back to 113.00.
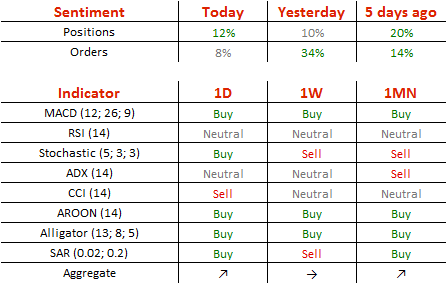
Traders' Sentiment
There are 56% of traders holding long positions today (previously 55%), whereas the share of buy orders slid from 67 to 54%.
Trade Idea Update: USD/JPY – Buy at 114.90
USD/JPY - 115.36
Original strategy :
Buy at 114.90, Target: 115.90, Stop: 114.55
Position : -
Target : -
Stop : -
New strategy :
Buy at 114.90, Target: 115.90, Stop: 114.55
Position : -
Target : -
Stop : -
As the greenback has surged again today and broke above indicated previous resistance at 115.38, adding credence to our bullishness for recent upmove to extend further gain to another previous resistance at 115.62, however, near term overbought condition should prevent sharp move beyond 115.90-00, risk from there has increased for a retreat to take place later.
In view of this, would not chase this rise here and we are looking to buy dollar on pullback as 114.90-00 should limit downside and bring another rise. Below previous resistance at 114.75-76 would defer and risk test of 114.50-55 but break of support at 114.26 is needed to signal top is formed instead.
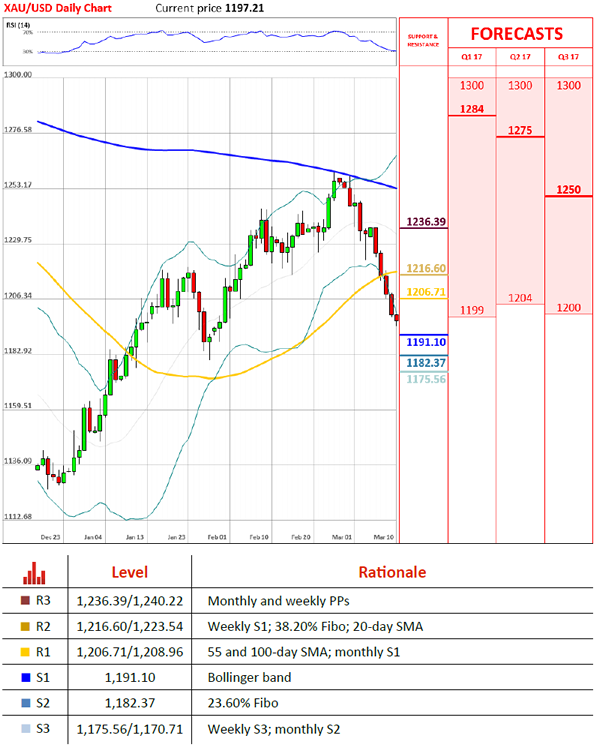
Gold Reaches Possible Long Term Trend Line
'If the (nonfarm payroll) data does come in better than market expectations, it will drag gold prices further.' - Barnabas Gan, OCBC (based on Reuters)
Pair's Outlook
During the early hours of Thursday's trading session the yellow metal's price slipped even further lower, as the price reached below the 1,205 level. However, the bullion managed to find support in a speculative and before the recent moves unconfirmed long term lower trend line of a large scale ascending channel pattern. Due to that reason traders should look at whether a proper rebound occurs, as from the upside there is a strong resistance cluster, which could keep the commodity price lower in the future sessions.
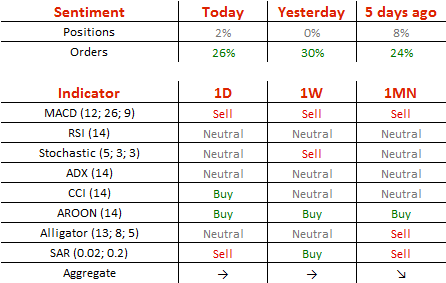
Traders' Sentiment
SWFX traders are neutral at the moment, as 50% of open positions are long. Although, 65% of trader set up orders are set to buy the bullion, and such a high level has not been seen for more than two months.
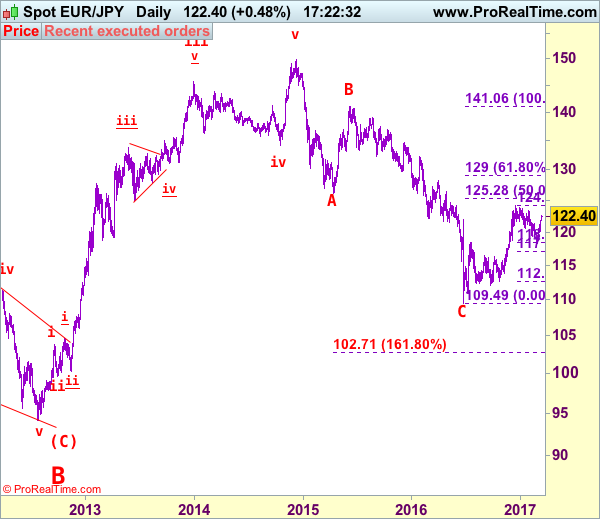
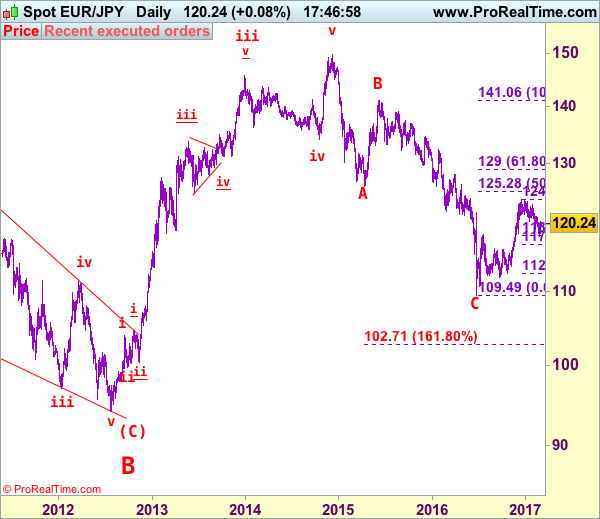
EUR/JPY Elliott Wave Analysis
EUR/JPY - 122.49
EUR/JPY: Wave v as well as larger degree wave (C) ended at 94.11 and first leg of larger degree wave C upmove has possibly ended at 149.79 and wave 2 correction has possibly ended at 109.49.
The single currency only retreated to 120.02 before finding renewed buying interest again and current rally adds credence to our bullish view that low has been formed at 118.24 and upside bias remains for further gain to 123l00 but break of indicated resistance at 123.31 is needed to signal the entire correction from 124.10 top (2016 high) has ended, bring subsequent rise to 123.73, then retest of 124.10. Looking ahead, once this level is penetrated, this would confirm medium term erratic upmove from 109.49 (2016 low) has resumed for headway to 124.50-60, then 125.25-30 (50% Fibonacci retracement of 141.06-109.49).
The daily chart is labeled as attached, early selloff from 169.97 (July 2008) to 112.08 is wave (A) of B instead of end of entire wave B and then the rebound from there to 139.26 is wave (B), hence, wave (C) has possibly ended at 94.12 with a diagonal triangle as labeled in the daily chart, hence upside bias is seen for further gain. Recent rally above indicated retracement level at 116.69 (50% Fibonacci retracement of the intermediate fall from 139.26-94.12) adds credence to this view and signal major reversal has commenced but first leg of this wave C has possibly ended at 149.79, hence wave 2 has commenced with wave A ended at 126.09, followed by wave B at 141.06, wave C commenced and could have ended at 109.49, above 125.00 would add credence to this view.
On the downside, whilst initial pullback to 122.00 cannot be ruled out, reckon downside would be limited to 121.60-70 and bring another rise later. Below previous resistance at 121.19 would defer and risk weakness to 120.50 but only break of said support at 120.02 would abort and signal the rebound from 118.24 has ended instead, then further fall to 119.60-70 and 119.30-35 would follow but said support at 118.24 should remain intact.
Recommendation: Buy at 121.70 for 123.70 with stop below 120.70.
To re-cap the corrective upmove from the record low of 88.93 (18 Oct 2000), the wave A from there is subdivided as: 1:88.93-113.72, 2:99.88 (1 Jun 2001), 3:140.91 (30 May 2003), 4:124.17 (10 Nov 2003) and 5 ended at record high of 169.97 (21 Jul 2008). The brief but sharp selloff to 112.08 is viewed as a-b-c x a-b-c wave (A) of B. The subsequent rebound to 139.26 is (B) of B and (C) of (B) has possibly ended at 94.12 and in any case price should stay well above previous chart support at 88.93, bring rally in larger degree wave C towards 150.00.
The Global Recovery – Glass Half Empty Or Glass Half Full?
The fairly upbeat assessment of the US economy by Fed Chair Janet Yellen last week made the difference. As she hinted strongly that the Fed would raise its benchmark rate unless today's job report disappoints strongly, we have moved our rate hike call for the Fed forward from June to March. We now expect three hikes in 2017 in line with the Fed's median dot plot from December. Wednesday's strong ADP number bodes well for today's payroll; therefore, a Fed rate hike should be a done deal, in our view.
That said, we were a bit surprised by the sudden hawkishness of the Fed, as there were not many signs in the minutes from the latest meeting or Yellen's hearing in Congress that the Fed was going to hike already in March. It seems that the Fed considers the meeting to be a window of opportunity due to strong economic data, a tight labour market, easy financial conditions and record-high stocks.
However, the Fed's fairly positive assessment of the strength of the US economy seems to be shared by US equity markets. Over the past weeks, equity markets have taken another leap higher as we had called for, supported partly by strong economic releases both in the US and elsewhere.
Fixed income and oil markets seem less convinced about the upbeat assessment. Longterm yields have not climbed much since the initial rise after Trump's election victory in November. As a result, we have seen a flattening of the yield curve in the US. Furthermore, inflation expectations are starting to head south and over the past two days, oil markets have seen a sharp sell-off, reminiscent of past occasions over the 2014-16 period, when the Fed turned more hawkish than had been priced into the market.