Sample Category Title
Foreign Exchange Market Commentary
EUR/USD
The EUR/USD pair closed the week a 1.0620, with the American dollar down on Friday, despite Fed's Yellen pretty much confirmed a March hike. The head of the US Central Bank spoke about the US economic outlook at the Executives Club of Chicago, and said that policymakers are ready to act at their next monetary policy meeting, if employment and inflation stay in line with officers expectations. She also added that two more rate hikes this year are likely, as the bank is now working to prevent the US from overheating. The US also released encouraging macroeconomic figures last Friday, as the ISM non-manufacturing PMI rose to 57.6, the highest since April 2015, from 56.5 in January. The Markit services PMI on the other hand, was revised slightly lower to 53.8 from a flash reading of 53.9 and 55.6 in January.
The American currency retreated on profit taking ahead of the weekend, as Yellen pretty much confirmed what Fed's members have been anticipating all through the week, particularly ahead of the release of the US Nonfarm Payrolls report this Friday. Also, the common currency found some support on news that French far-right leader Marine Le Pen was summoned by a judge Friday over allegations of misusing European Union funds.
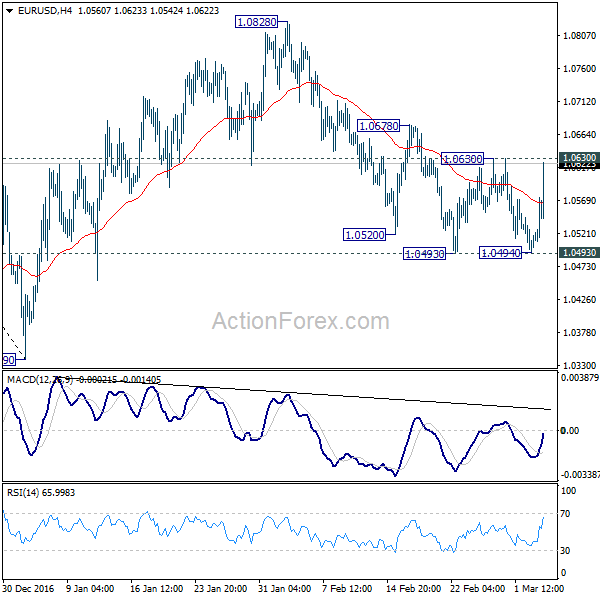
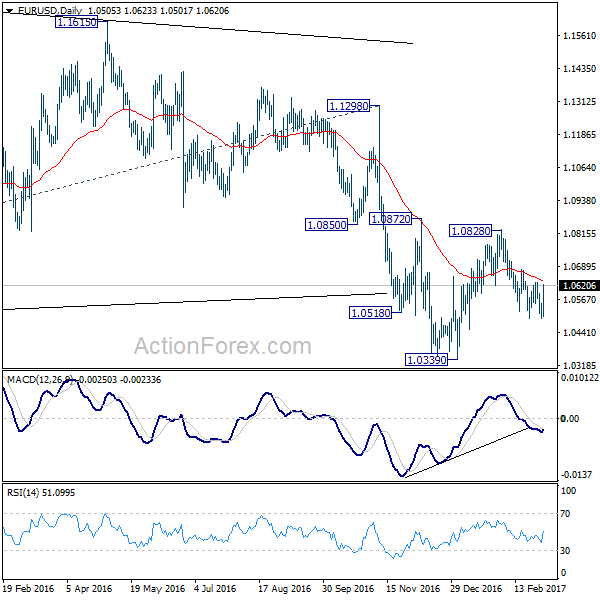
The EUR/USD pair recovery was enough to trim previous week's losses, but not enough to confirm further gains ahead, or even to confirm a bottom, as the price has been unable to extend beyond the 1.0630 region for a third consecutive week. The daily chart shows that the recovery stalled below a sharply bearish 20 SMA, whilst the Momentum indicator has turned flat around its 100 level, failing to enter positive territory, whilst the RSI hovers around 43. In the 4 hours chart, technical readings support a short-term bullish continuation, as the price broke higher pass its 20 and 100 SMAs that anyway maintain their bearish slopes, whilst technical indicators hold well above their mid-lines, barely paring their advances ahead of the weekly close. The recovery can extend up to the critical 1.0700/20 price zone, although strong selling interest is expected to surge around this last, if reached.
Support levels: 1.0590 1.0565 1.0520
Resistance levels: 1.0635 1.0660 1.0710
USD/JPY
The USD/JPY pair closed the week with strong gains around 114.00, but pulled back on Friday from 114.74 as the dollar eased against all of its major rivals. The USD/JPY pair has been trading in a well-limited range ever since early February, with the upside capped by 114.55, the 23.6% retracement of the November/December bullish run. On Friday, Bank of Japan Deputy Governor Hiroshi Nakaso said that the current policy framework offers the flexibility and sustainability to achieve the BOJ's "strong commitment" to raising inflation to a goal. Dollar's strength ever since Donald Trump won the US elections has taken some steam off the Central Bank as the JPY weakened, although the uptick in inflation has been quite shallow so far. From a technical point of view, the daily chart shows that the price has recovered above a bullish 100 DMA, now the immediate support at 113.50, but also that technical indicators lack upward strength, and hover within neutral territory. In the 4 hours chart, technical indicator have pulled down sharply from overbought levels, with the Momentum poised to enter negative territory, whilst the 100 and 200 SMAs converge at 113.25, providing a not so strong support due to the lack of directional strength. February's high stands at 114.95, and the pair needs to settle above it to be able to shrug off its negative tone.
Support levels: 113.50 113.25 112.90
Resistance levels: 114.55 114.95 115.30
GBP/USD
The USD/JPY pair closed the week with strong gains around 114.00, but pulled back on Friday from 114.74 as the dollar eased against all of its major rivals. The USD/JPY pair has been trading in a well-limited range ever since early February, with the upside capped by 114.55, the 23.6% retracement of the November/December bullish run. On Friday, Bank of Japan Deputy Governor Hiroshi Nakaso said that the current policy framework offers the flexibility and sustainability to achieve the BOJ's "strong commitment" to raising inflation to a goal. Dollar's strength ever since Donald Trump won the US elections has taken some steam off the Central Bank as the JPY weakened, although the uptick in inflation has been quite shallow so far. From a technical point of view, the daily chart shows that the price has recovered above a bullish 100 DMA, now the immediate support at 113.50, but also that technical indicators lack upward strength, and hover within neutral territory. In the 4 hours chart, technical indicator have pulled down sharply from overbought levels, with the Momentum poised to enter negative territory, whilst the 100 and 200 SMAs converge at 113.25, providing a not so strong support due to the lack of directional strength. February's high stands at 114.95, and the pair needs to settle above it to be able to shrug off its negative tone.
Support levels: 113.50 113.25 112.90
Resistance levels: 114.55 114.95 115.30
GOLD
Gold bounced on Friday from a fresh 2-week low of 1,222.80, but closed the week with strong losses, with spot at $1,234.15 a troy ounce, bearing anyway pretty well with dollar's strength and the possibility of a March rate hike in the US. The bright metal has been under pressure ever since topping at 1,263.79 at the beginning of the week, undermined by Fed's officers rhetoric, supporting a rate hike as soon as this March, reiterated on Friday by head's Yellen. The bright metal settled above the 50% retracement of the post-US election slump, at 1,230.00, although in the daily chart the price is below a now horizontal 20 DMA, after failing to surpass the 200 DMA, whilst technical indicators present a downward slope, but so far hold above their mid-lines, indicating an increasing bearish potential. In the 4 hours chart, the 20 SMA has turned sharply bearish above the current level and is about to cross below the 100 SMA, while technical indicators have managed to recover from oversold readings, but turned flat within bearish territory.
Support levels: 1,230.00 1,222.80 1,210.90
Resistance levels: 1,238.60 1,245.50 1,255.20
WTI CRUDE
West Texas Intermediate crude oil futures closed the week with modest losses at $53.20 a barrel, recovering on Friday from a fresh 3-week low of 52.53, as the dollar eased against all of its major rivals. Oil was also supported by news coming from the OPEC as early reports of February compliance suggest the organization was close to the 100% in the month. On the downside, the oilfield company Baker Hughes reported that the number of active drilling rigs rose for a seventh consecutive week, up by 7 to a total of 609. From a technical point of view, the daily chart shows that the commodity closed below a horizontal 20 DMA but above a modestly bullish 100 DMA, this last around 51.50, while the Momentum indicator remains flat around its 100 level, and the RSI heads modestly higher around 46, all of which limits chances of a steeper recovery. In the 4 hours chart, the price is well below all of its moving averages, with the 20 SMA having already crossed below the 100 SMA and now converging with the 200 SMA at 53.40, and technical indicators heading nowhere within negative territory, in line with the longer term perspective.
Support levels: 52.50 51.90 51.40
Resistance levels: 53.70 54.20 54.80
DJIA
US equities closed modestly higher on Friday, with the Dow Jones Industrial Average up 2 points, to 21,005.71. The Nasdaq Composite added 9 points and closed at 5,870.75, while the S&P ended at 2,383.12, 0.05% higher. Financial-related equities soared on Yellen's comments about a possible rate hike this March, if employment and inflation continue within FED's expectations. Within the Dow, Caterpillar was the best performer, up 0.81%, followed by Merck & Co that added 0.76%. Nike led decliners, shedding 1.90%, followed by Wal-Mart that closed 1.03% lower. The DJIA daily chart shows that it held far above a bullish 20 DMA, while the Momentum indicator heads sharply lower within positive territory, and the RSI consolidates at 77, correcting part of the extreme overbought readings reached in the week. In the 4 hours chart, the index hovers around a bullish 20 SMA, while the RSI indicator consolidates around 54, but the Momentum indicator heads sharply lower within negative territory, anticipating a downward corrective move on a break below 20,934, Friday's low and the immediate support.
Support levels: 20,934 20,882 20,827
Resistance levels: 21,064 21,114 21,164
FTSE 100
The FTSE 100 closed at 7,374.26 on Friday, down daily basis by 8 points or 0.11%, but firmly higher weekly basis and at record highs. Investors were cautious ahead of speeches from US key policymakers, including FED's head Janet Yellen. A weaker Pound provided support to local equities, although plummeting WWP dragged the benchmark lower. The world's largest advertising company closed down 7.95%, topping losers' list after reporting a sharp decline in its revenue growth. Fresnillo was also among the worst performers, down 2.89%. Old Mutual led advancers adding 1.81%, followed by Standard Live that closed 1.75% higher. Ahead of the weekly opening, the index retains the positive tone, although with no upward strength, as it holds above a bullish 20 DMA, but technical indicators turned modestly lower, the Momentum around its mid-line and the RSI at 66. In the 4 hours chart, the index remains well above a strongly bullish 20 SMA, whilst technical indicators retreated from overbought readings, supporting a downward corrective move on a break below Friday's low at 7,352.
Support levels: 7,352 7,320 7,287
Resistance levels: 7,397 7,420 7,450
DAX
European equities closed in the red on Friday with the German DAX down 32 points to 12,027.36. In the region, banks were among the best performers, while commodity-related equities led declines. Despite Friday's poor performance, the DAX ended above 12,000 its highest weekly settlement since April 2015. Commerzbank topped winners' list, up 4.14%, followed by RWE AG that added 1.36%. Deutsche Bank was the worst performer, down 5.45%. The bank supervisory board is meeting on Sunday to discuss a $8.5B capital raise, after announcing on Friday that its planning an equity offering and the sale of part of its asset management unit after failing to find a buyer for its Postbank consumer business. Technically, the daily chart shows that the benchmark remains firmly above all of its moving averages, while the Momentum indicator holds above its 100 level, lacking certain directional strength and the RSI indicator retreats partially from overbought readings. In the 4 hours chart, the 20 SMA maintains a sharp bullish slope well below the current level, while technical indicators are pulling back from overbought territory, favoring a short term downward correction, particularly on a break below 11,989.
Support levels: 11,989 11,938 11,867
Resistance levels: 12,053 12,100 12,148
GOLD -Retains Upside Pressure Despite Pullback
GOLD - The commodity closed lower the past week though with caution. On the downside, support comes in at the 1,240.00 level where a break will turn attention to the 1,230.00 level. Further down, a cut through here will open the door for a move lower towards the 1,220.00 level. Below here if seen could trigger further downside pressure targeting the 1,210.00 level. Conversely, resistance resides at the 1,260.00 level where a break will aim at the 1,270.00 level. A turn above there will expose the 1,280.00 level. Further out, resistance stands at the 1,290.00 level. All in all, GOLD looks to strengthen further.
So What’s Next
Whatever debate there was regarding the March 15 FOMC was indeed settled by Fed Chair Janet Yellen's remarks to the Executives' Club of Chicago on Friday. March is on! Equity markets took the comments in stride as investors view the rate hike as a positive reflecting an economy that is strengthening. Forex markets reaction was somewhat guarded as the dollar came off intraday highs with the March rate hike is now completely priced. This price action suggests that further dollar upside is limited near term. We've moved from 30 to 80 % probability for a March hike in a mere two weeks, so post-Yellen profit taking was always in the cards. Although I view the March hike as a preemptive strike, I suspect at this stage only an outlier NFP similar to last May which derailed the Fed's June 2016 rate hike, would alter the FOMC decision for March. But the real concern for dollar traders is the trajectory for interest rates in 2017. Dr Yellen did take the sting out her Hawkish delivery, by referencing data dependency. However, if the data suggests that employment and inflation are close and if President Tump follows through with infrastructure spending and tax cuts, traders will then start thinking about the possibility of the fourth hike in 2017, and this will boost the US dollar outlook significantly
Australian Dollar
Eyes will be on today's RBA cash rate decision, and while the RBA is unlikely to shift away from its neutral stance, as usual, the markets will be attuned to the Central Banks views of both domestic and international markets evolution
In early trading, the Aussie is perched just below 76 on a combination of USD longs profit taking and buoyant risk sentiment after equity markets took Dr Yellen remarks well. So long as the global growth story line remains firmly intact, support for the Aussie dollar should remain robust near-term
Japanese Yen
USDJPY continues to hold, but the topside momentum based on March has slowed considerably. As we enter the Fed blackout period, the dollar will get zero support like it did last week from the hawkish chorus of Fed speakers that were underpinning the Greenback. Dealers are looking at 114.95 ( FEB High) as the key for further topside momentum, but at his stage, it's looking like a bridge too far to cross.
Euro
The EUR risk profile in EUR changing with high PMI and inflation was surging. Rate curve volatility is picking up so the higher rates should keep EUR supported near term even more so as French election risk is abating with Le Pen losing ground in the polls.
EUR/USD Finds Support. A Look At Opportunities To Long
Welcome back to your screens for another week. I hope your weekend was refreshing and you’re back ready to crush another trading week!
What better way to spend your Monday Asian session than analysing EUR/USD starting with a clear as day 4 hourly support level on the 4 hourly.
EUR/USD 4 Hourly:
So as you can see, we have a pretty obvious support level at the bottom of the chart thanks to that juicy double bottom.
Both touches of the level come within just a 6 pip zone and more importantly, both touches of the level were met with immediate buying to push out of the level HARD.
EUR/USD 15 Minute:
Zooming into the intraday chart with the period separators on to represent days of the week, you can see that last Thursday push into the higher time frame level was then followed by the multiple chances to get long on any short term pullback into previous resistance that we’d look to act as support.
As the market opens for the week, the highest one shows that the bulls are still in control and we still have a long entry available to start the week if you don’t think the ship has already sailed.
Finally, I just wanted to bring up this daily EUR/USD support level that price held before Draghi helped pull the pair back down again.
USDCHF Remains Vulnerable On Price Rejection
USDCHF: The pair rejected higher prices the past week leaving risk lower. On the downside, support lies at the 1.0000 level. A turn below here will open the door for more weakness towards the 0.9950 level and then the 0.9900 level. On the upside, resistance resides at the 1.0100 level where a break will clear the way for more strength to occur towards the 1.0150 level. Further out, resistance comes in at the 1.0200 level. All in all, USDCHF remains biased to the downside on price weakness.
EURUSD: Rejects Lower Prices, Eyes More Recovery
EURUSD: The pair saw a price rejection the past week, leaving risk higher in the new week. On the upside, resistance comes in at 1.0650 level with a cut through here opening the door for more upside towards the 1.0700 level. Further up, resistance lies at the 1.0750 level where a break will expose the 1.0800 level. Conversely, support lies at the 1.0600 level where a violation will aim at the 1.0550 level. A break of here will aim at the 1.0500 level. All in all, EURUSD faces further downside pressure medium term but faces recovery higher.
Dollar Jumped on March Hike Expectations, But Overwhelmed by Euro on Politics
Dollar strength dominated the forex markets most of the time last week as speculations of a Fed hike in March heated up. Markets were also relieved as US president Donald Trump's first address Congress didn't deliver anything dramatic. Stock indices surged to new record high, taking yields and Dollar up too. Nonetheless, as most of the positive factors in greenback were priced, traders took profit on Dollar long positions after Fed chair Janet Yellen's comments. And more importantly, Euro staged a U turn after polls showed that far-right French president candidate Marine Le Pen lost ground, thus reducing Frexit risks. Euro has indeed ended as the strongest major currency, followed by Swiss France and Dollar. On the other hand, Canadian dollar ended as the weakest on the sharp pull back in oil price.
Fed Yellen affirmed March hike "would" likely be appropriate
After a chorus of hawkish Fed comments, fed fund futures are now pricing 79.7% chance of a rate hike at March 14/15 FOMC meeting. That's more than double of prior week's pricing. Fed chair Janet Yellen's speech on Friday affirmed such expectations. Yellen said that "at our meeting later this month, the committee will evaluate whether employment and inflation are continuing to evolve in line with our expectations, in which case a further adjustment of the federal funds rate would likely be appropriate." And, she also emphasized that "the process of scaling back accommodation likely will not be as slow as it was in 2015 and 2016." This affirmed Fed's last projection of three rate hikes this year. Meanwhile, the new staff projections to be released this month will now be even more important if Fed does hike. We'd like to see if Fed would project a total of four hikes this year.
Euro rebounded as Le Pen lost ground
However, Dollar's strength was overwhelmed by the common currency. Euro has been under much pressure recently due to political uncertainties. It's indeed the weakest one last month. A key factor to watch is French election in April and the run-off in May. A win of anti-Euro far-right leader Marine le Pen will significantly increase risk of Frexit. On Friday, a poll by research firm BVA found that Le Pen would get 26% of votes in the first round in May, down 1.5% from the prior poll on February 23. On the other hand, centrist Emmanuel Macron got 24%, up 3% from prior poll. Conservative Francois Fillon's support was unchanged at 19%. This is consistent with the base case of most analysts. That is, no one will get majority in the first round and Le Pen will face Macron in the run-off. According to BVA, Macron will defeat Le Pen by 62 to 32 in the one-on-one vote.
TNX struggling to breakout
Technically, there are two developments to note. Firstly, the strong rebound in 10 year yield last week eliminated that case of a deep correction to 2.130 retracement level. However, despite all the optimism, the TNX is still held inside established range and struggled to take out 2.5 handle decisively. That is seen as one of the factors that's holding back the rally in the greenback. The markets will look into the non-farm payroll report to be released this Friday. And as noted above, new economic projections by Fed could hold the key. After all, near term outlook in TNX stays neutral for the moment as the consolidation from 2.621 could still extend, even with another fall. But sustained trading above 2.500 will bring a retest of 2.621. Break will resume the medium term up trend from 1.336.
Dollar index strength doubtful
Dollar index resumed the rebound from 99.23 and hit as high as 102.26. Friday's sharp pull back suggests temporary topping and the index could turn into sideway trading initially this week. As long as 100.66 support holds, further rise is still mildly in favor to retest 103.82 high. However, we'll stay cautious for two reasons. Price actions from 99.23 are not clearly impulsive yet and that mixes up the outlook in the index. Also, EUR/USD could have a take on 1.0630 near term resistance soon. And break there will likely drag the Dollar index down. Break of 100.66 support will argue that the rebound from 99.23 is completed and turn bias back to the downside for this support.
Opportunity to turn long in Euro
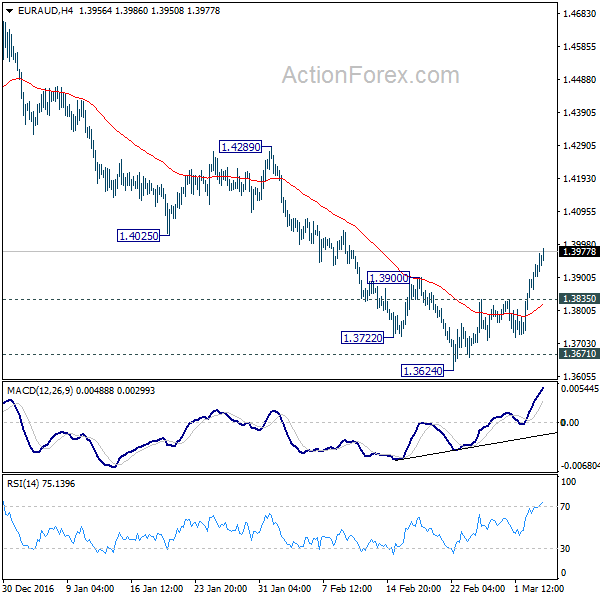
Our EUR/JPY short strategy last week was totally wrong as Yen reversed with treasury yield and Euro staged a strong rebound. Technically, it looks like a good timing to turn long in Euro. That's from the considerations that EUR/JPY defended 118.23 cluster support and rebounded. EUR/AUD defended 1.3671 support and rebounded. Both crosses are likely in near term reversal. 1.0630 resistance in EUR/USD and 0.8643 in EURGBP, if taken out, will affirm the turn in overall trend in Euro too. However, we will be very cautious as it's highly affected by political developments. To play safe, we will buy EUR/AUD on a dip to 1.3900, with a stop at 1.3800 this week.
EUR/USD Weekly Outlook
EUR/USD's decline attempt was contained at 1.0494, above 1.0493 support and rebounded. Initial bias stays neutral this week first. On the upside, break of 1.0630 resistance will argue that pull back from 1.0828 is completed. Also, rise from 1.0339 could possibly be resuming. In that case, intraday bias will be turned back to the upside for 1.0828 resistance and above. On the downside, below 1.0493 support will affirm the case that fall from 1.0828 is resuming the larger down trend. In that case, intraday bias will be back to the downside for resting 1.0339 low.
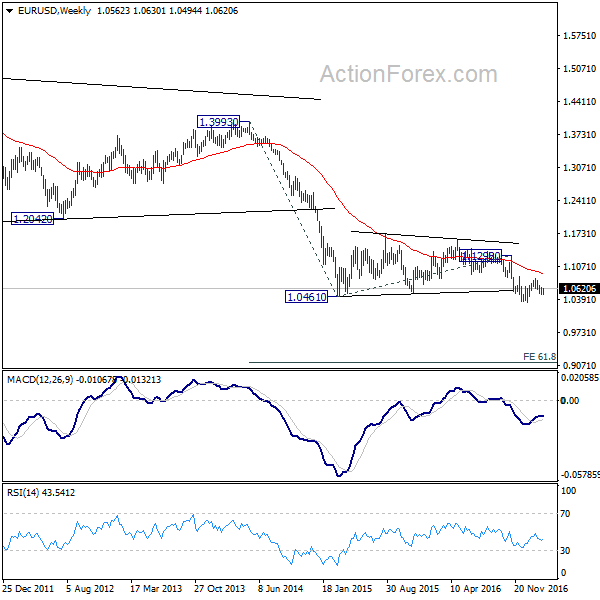
In the bigger picture, whole down trend from 1.6039 (2008 high) is in progress. Such down trend is expected to extend to 61.8% projection of 1.3993 to 1.0461 from 1.1298 at 0.9115. On the upside, break of 1.1298 resistance is needed to confirm medium term bottoming. Otherwise, outlook will stay bearish in case of rebound.
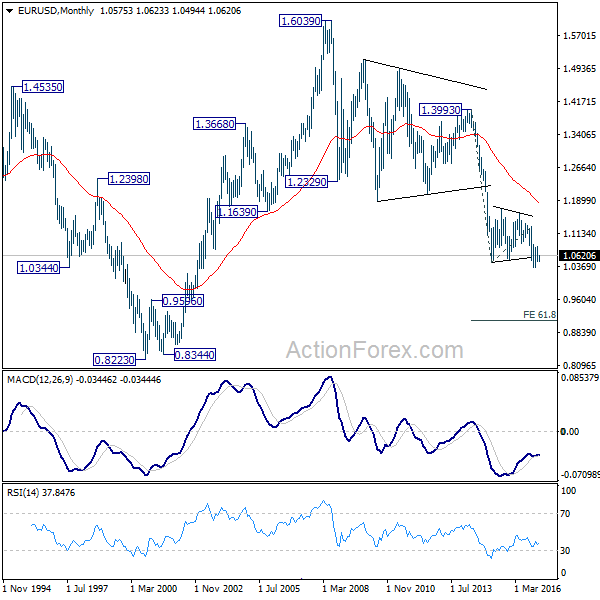
In the long term picture, the down trend from 1.6039 (2008 high) is still in progress and there is no clear sign of completion. We'd expect more downside towards 0.8223 (2000 low) as long as 1.1298 resistance holds.