Sample Category Title
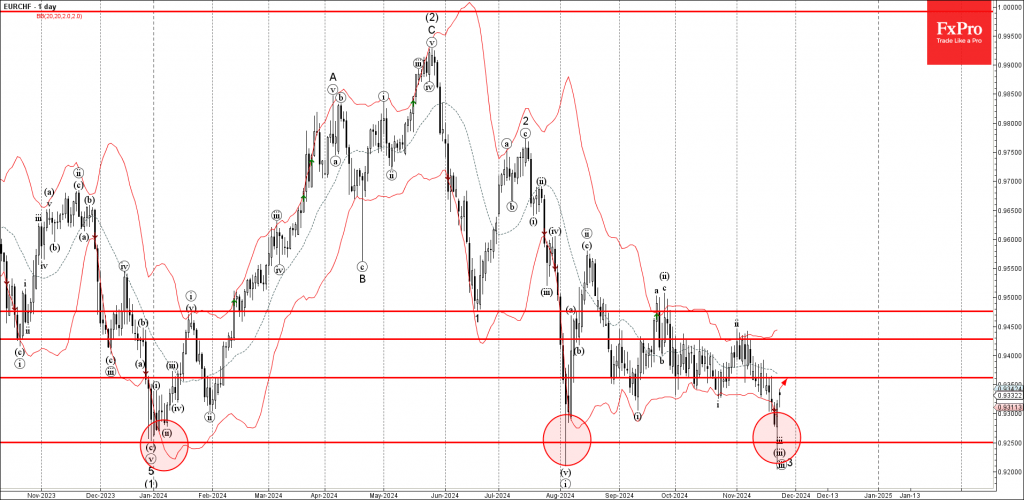
EURCHF Wave Analysis
- EURCHF reversed from support zone
- Likely to rise to resistance level 0.9360
EURCHF currency pair recently reversed up from the support zone located between the long-term support level 0.9250 (which has been reversing the price from the end of December) and the lower daily Bollinger Band.
The upward reversal from this support zone created the daily Japanese candlesticks reversal pattern Bullish Engulfing.
Given the strength of the support level 0.9250 and the bullish euro sentiment seen today, EURCHF currency pair can be expected to rise further to the next resistance level 0.9360.
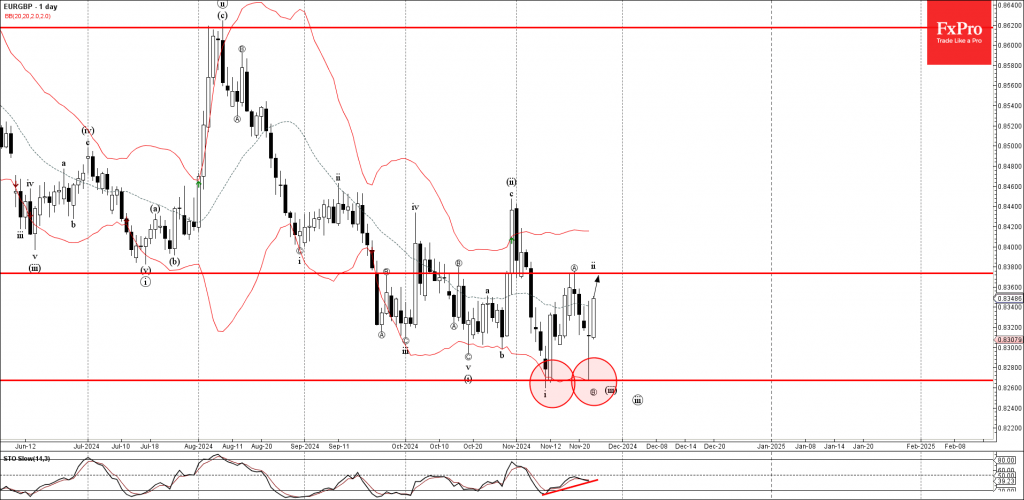
EURGBP Wave Analysis
- EURGBP reversed from support zone
- Likely to rise to resistance level 0.8375
EURGBP currency pair previously reversed up from the support area located at the intersection of the support level 0.8260 (which stopped the previous minor impulse wave i) and the lower daily Bollinger Band.
The upward reversal from this support zone created the daily Japanese candlesticks reversal pattern Long Legged Doji – strong buy signal for this currency pair.
Given the bullish divergence on the daily Stochastic indicator, EURGBP currency pair can be expected to rise further to the next resistance level 0.8375 (top of the previous minor correction a).
Sunset Market Commentary
Markets
Trump’s pick for the US Treasury Secretary triggered a relief rally in the bond market. Scott Bessent brought a catchy 3-3-3 pitch: reduce the government deficit to 3% of GDP, aim for 3% growth and pump up an additional 3 million barrels a day. He favours tariffs and the tax cuts the president-elect plans to push through. But he’s a bit more a moderate voice compared to some of the hardliners in Trump 2.0. Markets expect Bessent to soften some of the sharpest edges of Trump’s America First strategy for the sake of financial and macro stability. In absence of a lot of other major news, it served as a perfect trigger for some short-term consolidation that even might morph into a correction following the blistering yields’ rally since mid-September. US rates ease between 7 and 10 bps in a bull flattening move. German Bunds slightly underperform after Friday’s post-PMI surge. A cautious yield recovery attempt ended in tears nonetheless, especially at the long end of the curve. The 30-yr drops 5 bps. The 2-yr tenor adds about 2 bps. The technical charts offered some help with the 2% support cracking but for the time being surviving. Given what’s priced in for the ECB terminal rate (<1.75%) this level should hold theoretically though there are clear risks for a break lower. Sentiment on stock markets is constructive. The likes of the EuroStoxx50 add a modest 0.3% and Wall Street opens with gains between 0.8-1%. It’s a boon to the euro, which hit a 2-yr low against the dollar just before the weekend. EUR/USD bounced back from 1.043 to 1.052. It’s as much euro strength as dollar weakness though. The trade-weighted greenback slid below 107 (106.64), USD/JPY marches south (153.78). Oil on commodity markets slides to $73.9 per barrel. European natural gas (Dutch TTF) prices rise about 3%, closing in on the €50 mark (per MWh) for the first time in over a year and underscoring once again the loss cheap energy as a competitive advantage. A cold snap is expected for the second part of this week, prompting speculation for higher demand at a time when Europe already tapped earlier than usual in its inventories.
News & Views
Overall confidence in the Czech economy increased in November. The composite indicator (consumer & business confidence) rose from 96.8 to 98 (vs 96.6 consensus), matching its best level since June 2022. Both consumer (101.6 from 100.7; 6-month high) and business confidence (97.3 from 96; 5-month high) contributed to the improvement. The number of consumers who do not plan to make large purchases in the next 12 months has decreased. Households' concerns about an increase in unemployment over the next year have decreased slightly as well. In contrast, the number of households concerned about further price increases has increased. Details of the business survey showed a mixed picture. Improvements in construction, trade and selected services was partly offset by a weakening in industry confidence. Especially the share of respondents expecting an increase in the pace of production activity in the next three months fell significantly. CZ markets didn’t respond to the release. The Czech krone keeps trading on the weak side (EUR/CZK 25.30) with tighter financial conditions in the US, the proximity to war in Ukraine, a struggling German economy and increasing gas prices all contributing.
The Hungarian government announced that minimum wage will increase by 9% next year, followed by 13% and 14% increases in 2026 and 2027. PM Orban hopes to revive the economy in the run-up to general elections in 2026. They aim to keep workers from seeking employment abroad and are based on a scenario where economic growth and productivity increase hand-in-hand. The government, labour unions and employers agreed to review the wage hike target should key indicators for growth and especially inflation miss government forecasts. MNB vice-governor Virag already warned against boosting growth at the cost of higher inflation. The forint today rebounds off YTD lows, from EUR/HUF 412.50 to 409.50.
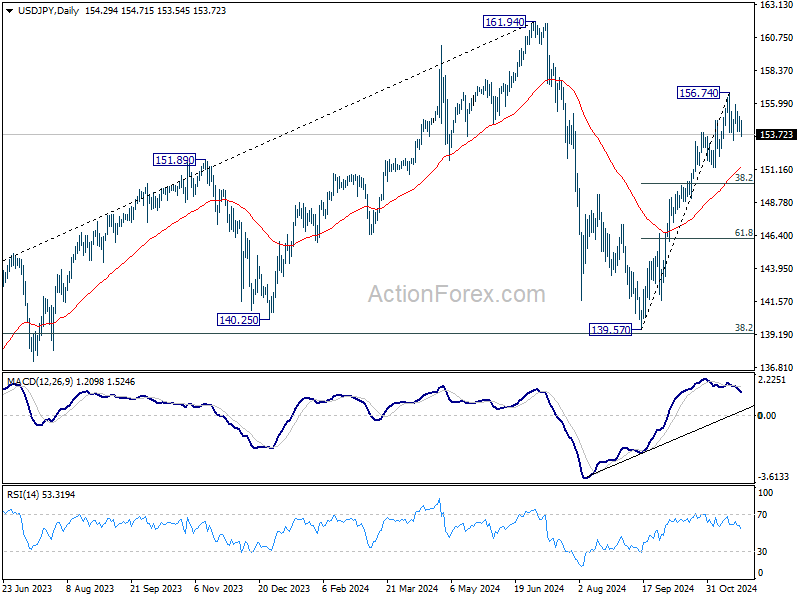
USD/JPY Mid-Day Outlook
Daily Pivots: (S1) 153.82; (P) 154.64; (R1) 155.36; More...
USD/JPY is extending consolidation pattern from 156.74 and intraday bias remains neutral. On the downside, break of 153.27 will bring deeper correction to 38.2% retracement of 139.57 to 156.74 at 150.18. Meanwhile, on the upside, firm break of 156.74 will resume the rally from 139.57 towards 161.95 high.
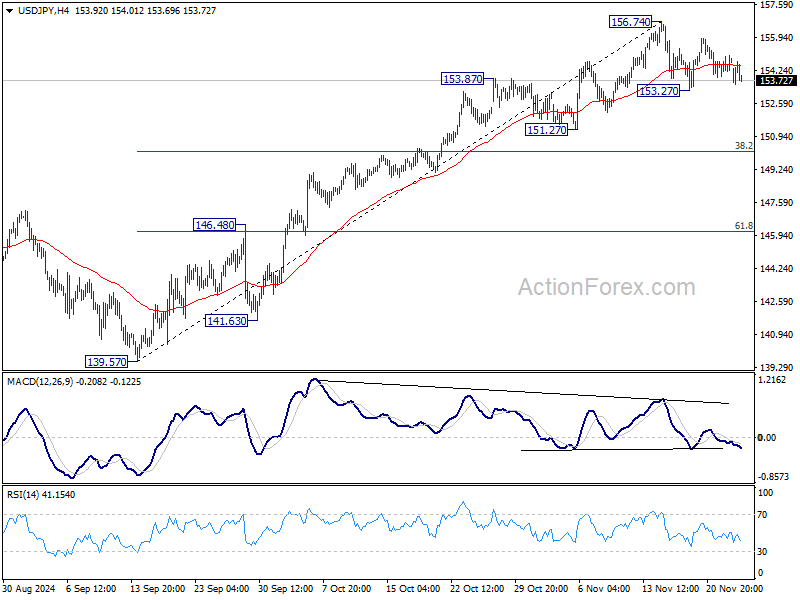
In the bigger picture, price actions from 161.94 are seen as a corrective pattern to rise from 102.58 (2021 low). The range of medium term consolidation should be set between 38.2% retracement of 102.58 to 161.94 at 139.26 and 161.94. Nevertheless, sustained break of 139.26 would open up deeper medium term decline to 61.8% retracement at 125.25.
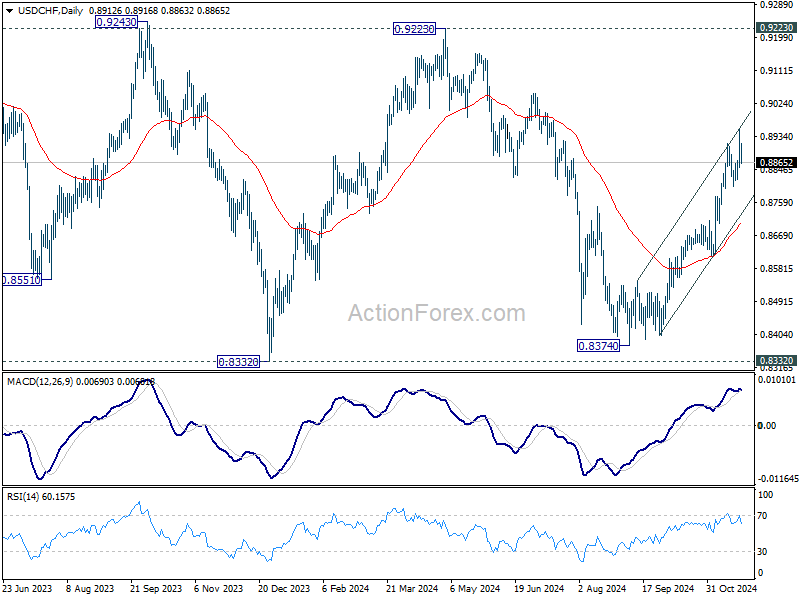
USD/CHF Mid-Day Outlook
Daily Pivots: (S1) 0.8877; (P) 0.8918; (R1) 0.8983; More…
Intraday bias in USD/CHF remains neutral as consolidations continue below 0.8956. Outlook will stay bullish as long as 0.8800 support holds, in case of retreat. Break of 0.8956 will resume the rally from 0.8374, and target 0.9223 key resistance next.
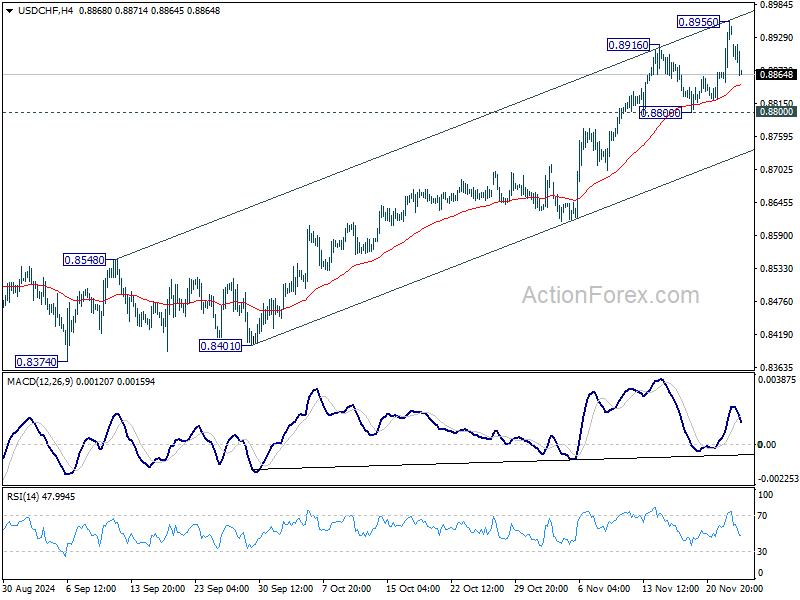
In the bigger picture, price actions from 0.8332 (2023 low) are currently seen as a medium term corrective pattern. Rise from 0.8374 is seen as the third leg. Overall outlook will continue to stay bearish as long as 0.9223 resistance holds. Break of 0.8332 low is in favor at a later stage when the consolidation completes.
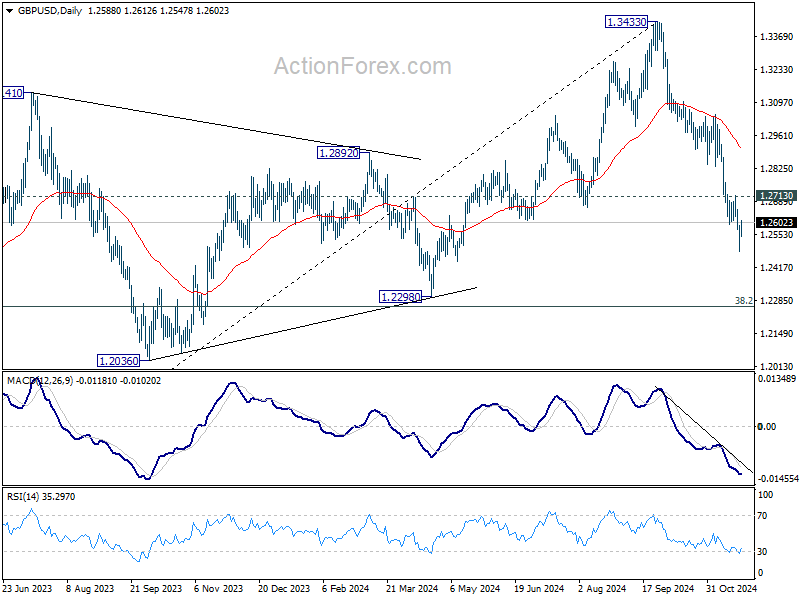
GBP/USD Mid-Day Outlook
Daily Pivots: (S1) 1.2480; (P) 1.2539; (R1) 1.2590; More...
Intraday bias in GBP/USD remains neutral and more consolidations would be seen above 1.2486. But outlook will stay bearish as long as 1.2713 resistance holds. Break of 12487 will resume the fall from 1.3433 to 1.2298 cluster support zone.
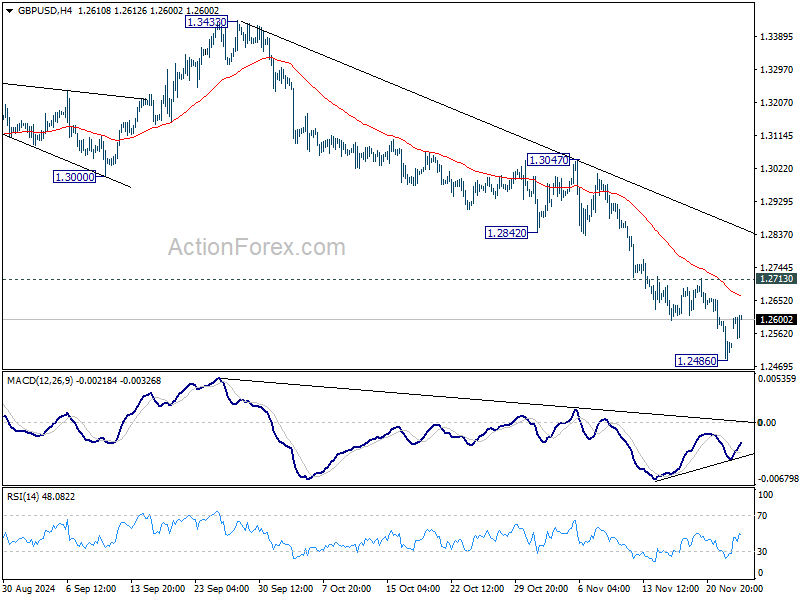
In the bigger picture, a medium term top should be in place at 1.3433, and price actions from there are correcting whole up trend from 1.0351 (2022 low). Deeper decline is now expected as long as 55 D EMA (now at 1.2918) holds, to 38.2% retracement of 1.0351 to 1.3433 at 1.2256, which is close to 1.2298 structural support. Strong support should be seen there to bring rebound.
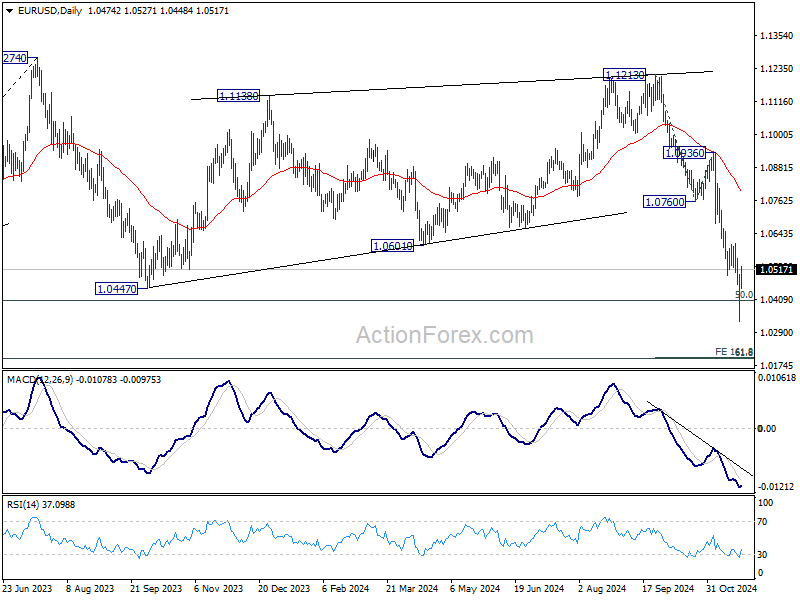
EUR/USD Mid-Day Outlook
Daily Pivots: (S1) 1.0335; (P) 1.0416; (R1) 1.0500; More...
EUR/USD's recovery from 1.0330 extends higher today but stays below 1.0609 resistance. Intraday bias remains neutral and further decline is still in favor. On the downside, sustained trading below 1.0404 key fibonacci level will carry larger bearish implication and target next level at 161.8% projection of 1.1213 to 1.0760 from 1.0936 at 1.0203. However, firm break of 1.0609 will confirm short term bottoming, and turn bias back to the upside for 1.0760 support turned resistance first.
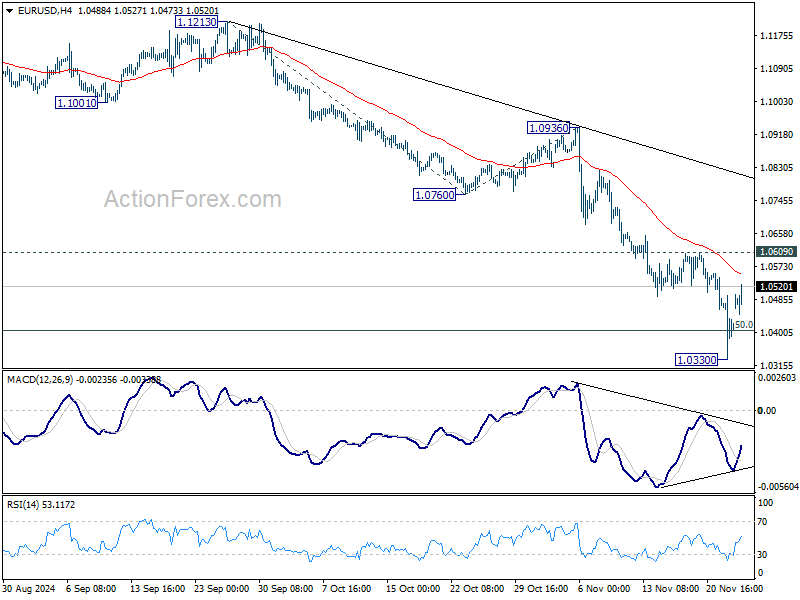
In the bigger picture, immediate focus is now on 50% retracement of 0.9534 (2022 low) to 1.1274 at 1.0404. Strong rebound from this level will keep price actions from 1.1273 (2023 high) as a medium term consolidation pattern only. However, sustained break of 1.0404 will raise the chance that whole up trend from 0.9534 has reversed. That would pave the way to 61.8% retracement at 1.0199 first. Firm break there will target 0.9534 low again.
Dollar Stays Soft With Falling Yields and Stocks Rally
Dollar remains under pressure as the market heads into the US session, with selling momentum picks up slightly alongside a continued decline in Treasury yields. US stock futures are staging a robust rally, reflecting optimism over President-elect Donald Trump's selection of Scott Bessent as Treasury Secretary. Bessent is viewed as a safe choice for implementing key policies, including tariffs, with a measured approach.
On the other hand, Euro stands out as the strongest performer so far, shrugging off disappointing German Ifo Business Climate data. Swiss Franc follows as the second strongest, while Yen rounds out the top three. In contrast, Canadian Dollar is among the weakest, followed by Australian Dollar, with Kiwi and Sterling occupying middle-ground positions.
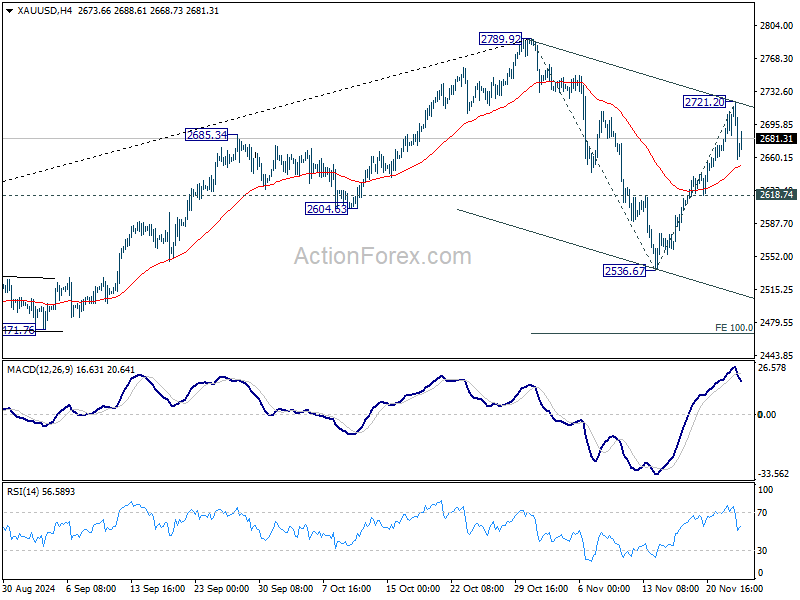
Technically, Gold is also weakening slightly in spite of the pullback in Dollar. Rebound from 2536.67 stalled after reaching 2721.20. While another rise cannot be ruled out, upside should be limited by 2789.92 resistance. Break of 2618.74 support would argue that the corrective pattern from 2789.92 has started the third leg for 2536.67 again, and possibly below.
In Europe, at the time of FTSE is up 0.33%. DAX is up 0.43%. CAC is up 0.14%. UK 10-year yield is down -0.048 at 4.344. Germany 10-year yield is down -0.0203 at 2.227. Earlier in Asia,Nikkei rose 1.30%. Hong Kong HSI fell -0.41%. China Shanghai SSE fell -0.11%. Singapore Strait Times fell -0.39%. Japan 10-year JGB yield fell -0.0057 to 1.074.
BoE’s Lombardelli warns of costly risks if inflation upside materializes
I view the probabilities of downside and upside risks to inflation as broadly balanced. But at this point I am more worried about the possible consequences if the upside materialised, as this could require a more costly monetary policy response.
Lombardelli said the level of interest rates was “comfortably in restrictive territory at the moment” and supported “a gradual removal of monetary policy restriction” but the data over the coming months will be critical and need “careful observation.”
“There are some signs that the process of wage disinflation may be slowing, so it’s too early to declare victory on inflation. It’s often been said that the last mile may be the hardest, and that’s where we are now.”
ECB's Lane warns against prolonged restrictive policy
In an interview with Les Echos, ECB Chief Economist Philip Lane highlighted that "monetary policy should not remain restrictive for too long".
He explained the challenges of maintaining restrictive monetary policy stance for an extended period, cautioning that it could stifle economic growth and lead to inflation falling below ECB’s 2% target.
However, while markets currently assign a 50% probability to a 50bps rate cut in December, Lane appeared to moderate these expectations by emphasizing that inflation remains above target in key areas, particularly services, and that much of the recent decline stems from easing energy costs rather than broad-based price adjustments.
"There is still some distance to go in terms of adjustment for inflation to return to the desired level in a more sustainable way," Lane noted.
German Ifo falls to 85.7, further deteriorations
Germany’s Ifo Business Climate Index declined to 85.7 in November, down from 86.5 in October, reflecting growing pessimism across key sectors of Europe’s largest economy. Current Assessment Index dropped from 85.7 to 84.3, indicating weaker confidence in present conditions. Expectations Index edged slightly lower from 87.3 to 87.2, suggesting limited optimism for the months ahead.
Sector-specific data painted a grim picture. Manufacturing sentiment worsened, dropping from -20.6 to -21.9, and the services sector also reversed, declining from 0.1 to -3.6. Construction sentiment weakened significantly, falling from -25.7 to -28.5. Trade was the only sector to show some improvement, rising from -29.4 to -26.6, though it remains firmly in negative territory.
Ifo President Clemens Fuest characterized the situation as increasingly bleak, remarking that sentiment among German companies has turned "gloomier" and that the economy is "floundering."
New Zealand's Q3 retail sales down -0.1% qoq, ex-auto sales slumps -0.8% qoq
New Zealand’s retail sales volume for Q3 showed a marginal decline of -0.1% qoq, a better outcome than the expected -0.5% qoq contraction. However, the data revealed underlying weakness, as retail sales excluding autos fell by a sharper-than-expected -0.8% qoq, missing the forecast of -0.3% qoq.
A breakdown of the data shows that 10 out of 15 retail industries experienced lower sales volumes during the quarter.
Meanwhile sales value dropped significantly by -0.7% qoq. Regionally, 15 of the 16 regions reported lower seasonally adjusted sales values, underscoring the broad-based nature of the decline.
As Michael Heslop, an economic indicators spokesperson, noted, “Retail activity was flat in the September 2024 quarter, with a decrease in spending in most retail industries being offset by an increase in motor vehicles and electrical and electronic goods.”
New Zealand's goods exports rises 7.5% yoy in Oct, goods imports up 3.0% yoy
New Zealand's goods exports increased by 7.5% yoy in October, reaching NZD 5.8B, while total goods imports rose by 3.0% yoy to NZD 7.3B. This resulted in a trade deficit of NZD -1.54B, which, although significant, was better than the expected deficit of NZD -1.76B.
Key export markets demonstrated robust growth, with exports to China rising by NZD 113m (8.4% yoy), Australia up by NZD 60m (8.3% yoy), the US surging NZD 90m (15% yoy), the EU increasing NZD 48m (18% yoy), and Japan gaining NZD 19m (6.7% yoy).
On the import side, trends were more mixed. Imports from China and the EU declined, falling NZD 42m (-2.7% yoy) and NZD 35m (-3.2% yoy) respectively. However, imports from the US surged by NZD 459m (79% yoy), while South Korea and Australia saw notable increases of NZD 148m (32% yoy) and NZD 58m (7.5% yoy) respectively.
EUR/USD Mid-Day Outlook
Daily Pivots: (S1) 1.0335; (P) 1.0416; (R1) 1.0500; More...
EUR/USD's recovery from 1.0330 extends higher today but stays below 1.0609 resistance. Intraday bias remains neutral and further decline is still in favor. On the downside, sustained trading below 1.0404 key fibonacci level will carry larger bearish implication and target next level at 161.8% projection of 1.1213 to 1.0760 from 1.0936 at 1.0203. However, firm break of 1.0609 will confirm short term bottoming, and turn bias back to the upside for 1.0760 support turned resistance first.
In the bigger picture, immediate focus is now on 50% retracement of 0.9534 (2022 low) to 1.1274 at 1.0404. Strong rebound from this level will keep price actions from 1.1273 (2023 high) as a medium term consolidation pattern only. However, sustained break of 1.0404 will raise the chance that whole up trend from 0.9534 has reversed. That would pave the way to 61.8% retracement at 1.0199 first. Firm break there will target 0.9534 low again.
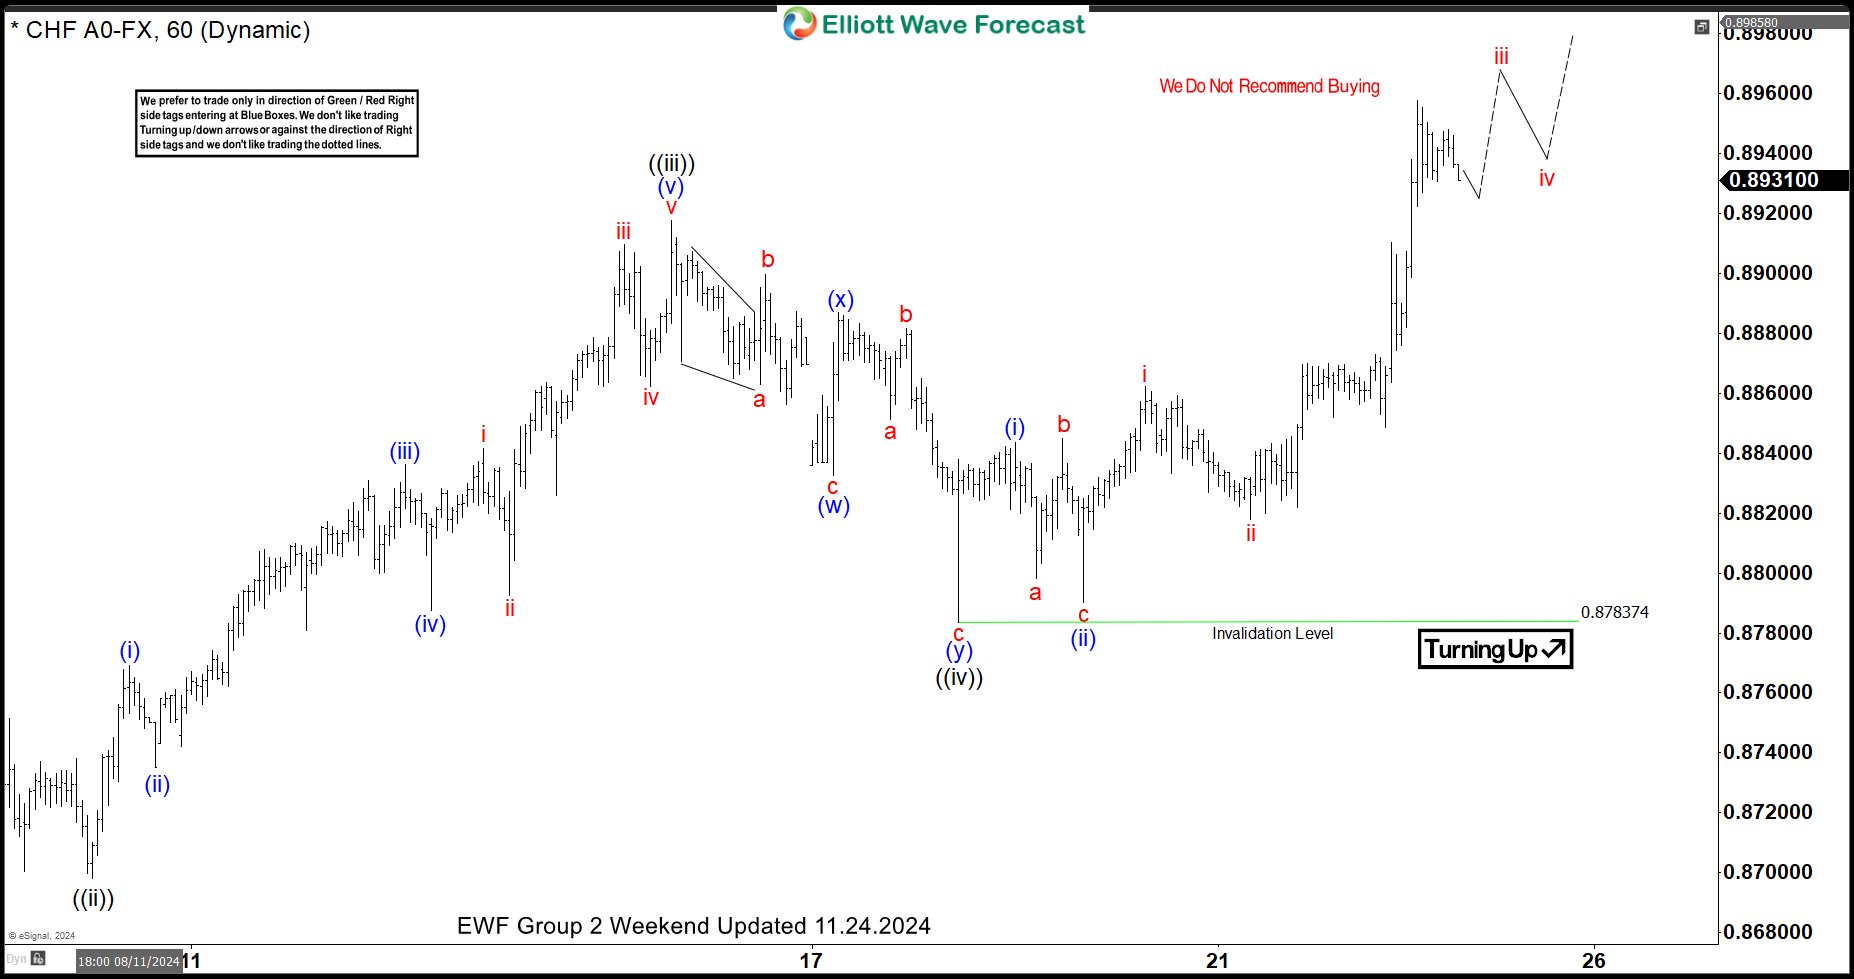
USDCHF Calling the Rally After Elliott Wave Double Three Pattern
Hello fellow traders. In this technical article we’re going to take a look at the Elliott Wave charts charts of USDCHF Forex pair published in members area of the website. Our members know USDHCF recently made a clear three-wave correction. The pull back completed as Elliott Wave Double Three pattern and made rally toward new highs as expected. In this discussion, we’ll break down the Elliott Wave pattern and forecast.
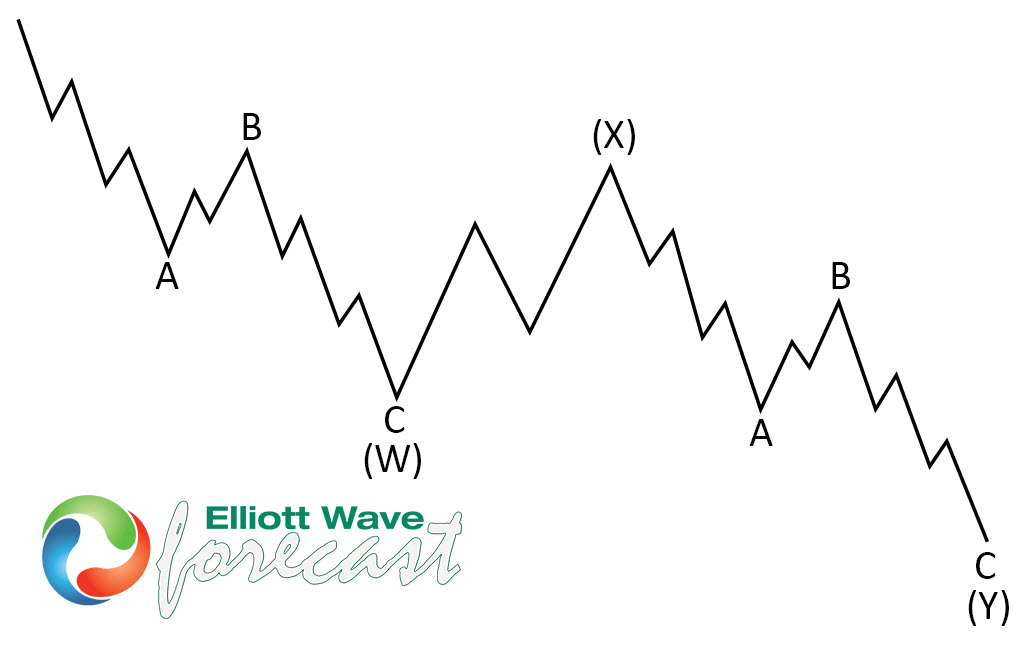
Elliott Wave Double Three Pattern
Double three is the common pattern in the market , also known as 7 swing structure. It’s a reliable pattern which is giving us good trading entries with clearly defined invalidation levels.
The picture below presents what Elliott Wave Double Three pattern looks like. It has (W),(X),(Y) labeling and 3,3,3 inner structure, which means all of these 3 legs are corrective sequences. Each (W) and (Y) are made of 3 swings , they’re having A,B,C structure in lower degree, or alternatively they can have W,X,Y labeling.
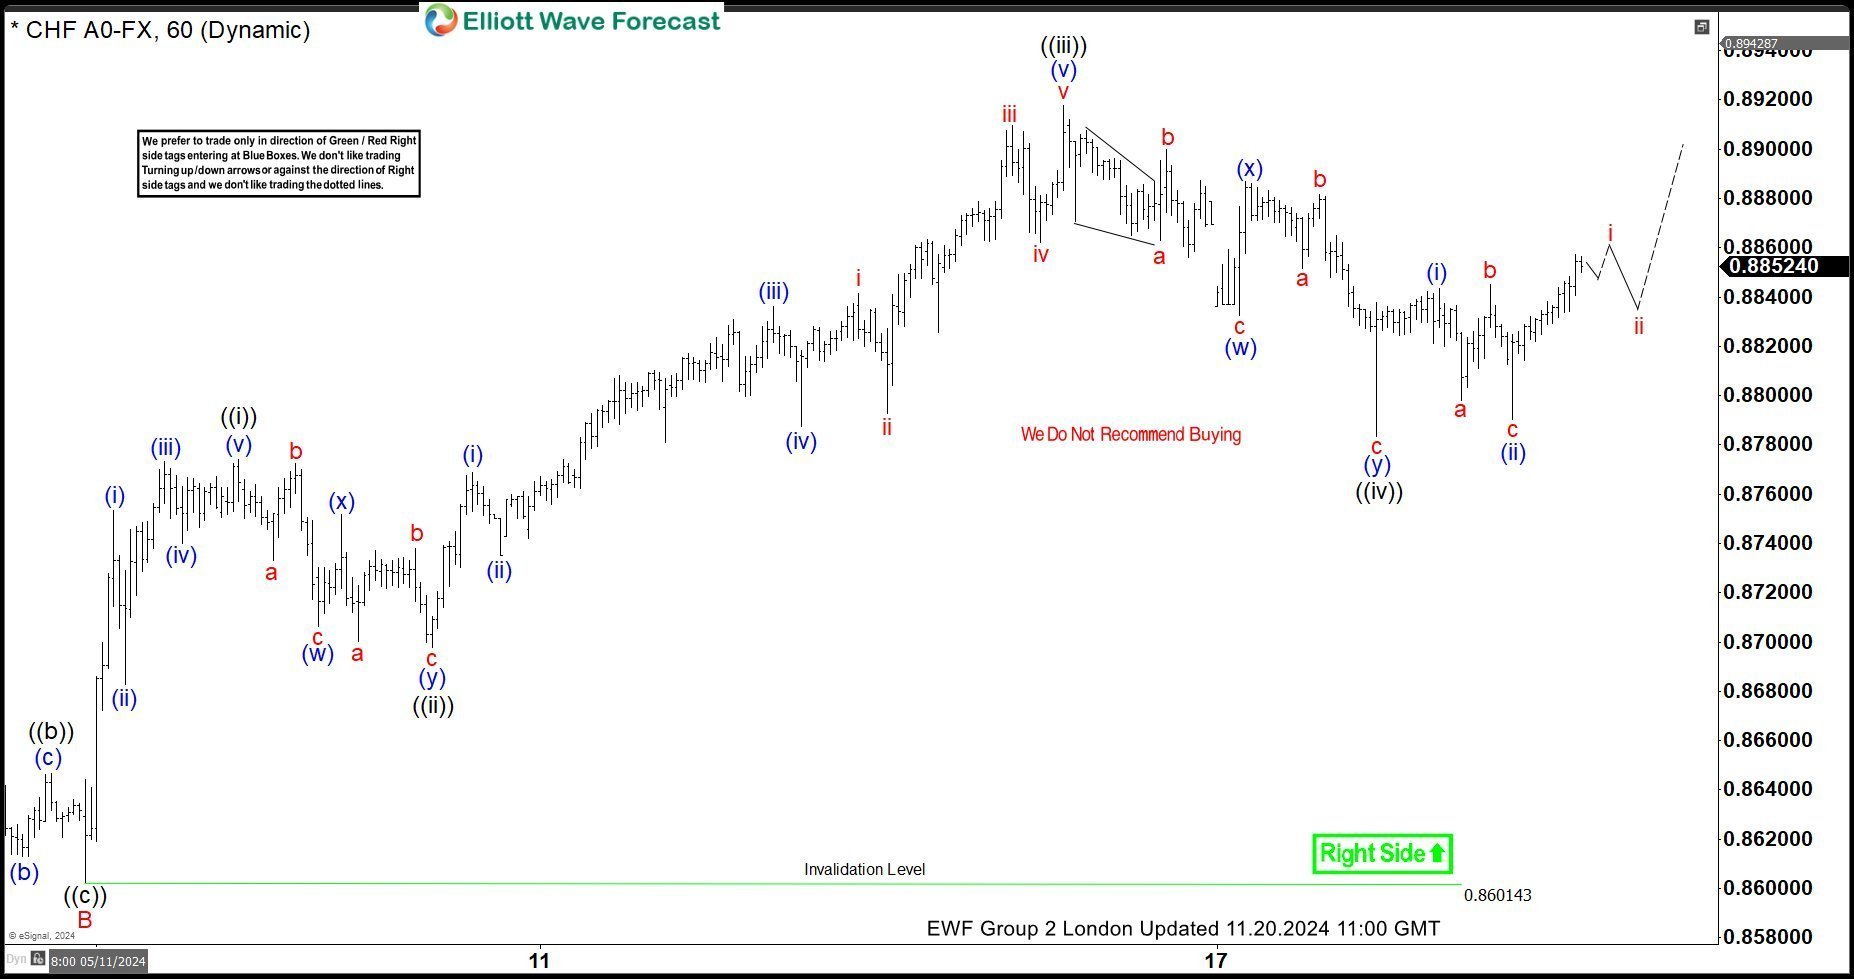
USDCHF Elliott Wave 1 Hour Chart 11.20.2024
USDCHF is showing higher high sequences in the cycle from the September 6th low , suggesting further strength ahead. The structure of this pullback shows clear 7 swings – Double Three Pattern. The first leg, shows a clear 3-wave structure a,b,c red, followed by a 3-wave bounce in (x) blue. We can also count 3 swings in (y) blue leg. We advise against selling $USDCHF and instead favor the long side. While the price stays above ((iv)) black low, we expect to see further rally toward new highs.
USDCHF Elliott Wave 1 Hour Chart 11.24.2024
USDCHF found buyers as expected. The forex pair has reacted strongly and eventually we got a break toward new highs. Now, intraday pull backs should ideally keep finding buyers as far as 0.8783 pivot holds.