
Sample Category Title
US: Payrolls Disappoint in October, But Unemployment Rate Holds Steady at 4.1%
Non-farm employment rose a meager 12k in October, well below the consensus forecast calling for a gain of 100k. Job gains over the two prior months were revised lower by 112k.
- The Bureau of Labor Statistics noted that Hurricane's Helene and Milton "likely" affected estimates in some industries, though did not provide any point estimates.
- Over the past three months, payroll gains averaged 104k, well below the 194k averaged over the prior twelve-month period.
Private payrolls were lower by 28k in October, with the largest declines seen in professional & business services (-47k) – all related to a pullback in temporary help (-48.5k) - and manufacturing (-46k), though this was largely due to the ongoing Boeing strike. Meanwhile, education & healthcare (+57k) and government (+40k) recorded solid gains last month. Job creation across most other industries was relatively flat.
In the household survey, a sharp decline in civilian employment (368k) largely offset a pullback in the labor force (-220k), keeping the unemployment rate steady at 4.1%. The labor force participation rate fell 0.1 percentage points to 62.6%.
Average hourly earnings (AHE) rose 0.4% month-on-month (m/m), a modest acceleration from September's downwardly revised reading of 0.3% m/m. On a twelve-month basis, AHE were up 4.0% (from 3.9% in September).
Key Implications
Between the ongoing Boeing strike and the devastating impacts of Hurricane's Helene and Milton, we knew this was going to be messy employment report. While the Bureau of Labor Statistics didn't provide any point estimates of hurricane impacts, they did note that the storms "likely" had some impact on last month's figures. Putting that aside, revisions to prior months were meaningfully lower, which on top of October's disappointing reading pulled the three-month moving average down to 104k, well below what's required to meet current growth in the labor force. However, given the various factors impacting last month's numbers, it's too early to draw any meaningful conclusions from today's report.
Other data out this week continued to point to a labor market that is decelerating but not necessarily deteriorating. Job openings continued to trend lower in September while hire and quit rates are now at or below pre-pandemic levels. This has helped to pressure compensation growth lower, with the Employment Cost Index slowing to 3.9% on a year-ago basis in the third quarter. Amid the ongoing pickup in productivity, this suggests the Fed's preferred wage metric is now growing at a pace broadly consistent with 2% inflation. This should give policymakers all the confidence they need to gradually reduce the policy rate by quarter-point increments at each of its upcoming meetings.
Dollar Falls on Weak NFP Job Growth, But Losses Remain Limited
Dollar saw broad-based weakness in early US session following a much weaker-than-expected non-farm payroll report. Headline job growth came in well below forecasts, though market reaction remains tempered, as the data is widely believed to be heavily skewed by recent hurricanes and strikes. With unemployment rate holding steady and wage growth surpassing expectations, the underlying labor market still appears resilient. While this report slightly adjusted market expectations, there remains a near 95% probability of a 25 bps rate cut by Fed next week.
In terms of weekly currency performance so far, Euro remains firmly in the lead. Yen has climbed to second place, benefiting from a post-NFP decline in US Treasury yields. Swiss franc ranks third, though its performance was dampened by weaker-than-expected inflation data, solidifying the chance of another SNB rate cut in December. Aussie remains at the bottom of the chart, followed closely by the Loonie. Sterling, despite a sharp drop on the UK budget news, managed to regain some ground and now ranks as the third weakest. Dollar and Kiwi are positioned mid-range.
In Europe, at the time of writing, FTSE is up 0.90%. DAX is up 0.65%. CAC is up 0.76%. UK 10-year yield is down -0.033 at 4.401. Germany 10-year yield is down -0.017 at 2.373. Earlier in Asia, Nikkei fell -2.63%. Hong Kong HSI rose 0.93%. China Shanghai SSE fell -0.24%. Singapore Strait Times fell -0.10%. Japan 10-year JGB yield rose 0.004 to 0.945.
US NFP grows only 12k in Oct, unemployment rate steady at 4.1%
US non-farm payroll employment grew only 12k in October, well below expectation of 106k. That compares to average monthly gain of 194k over the prior 12 months.
Nevertheless, unemployment rate was unchanged at 4.1%, matched expectations. number of unemployed people was little changed at 7.0m. Participation rate ticked down from 62.7% to 62.6%.
Average hourly earnings rose 0.4% mom, above expectation of 0.3% mom. Annual growth of average hourly earnings ticked up from 3.9% yoy to 4.0% yoy.
UK PMI manufacturing finalized at 49.9, wait-and-see ahead of budget
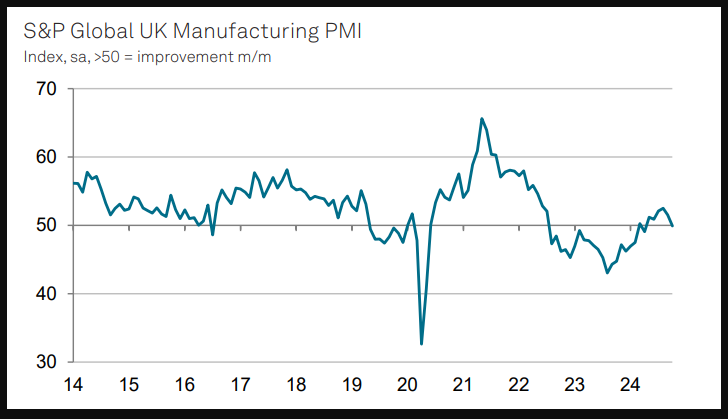
UK’s PMI Manufacturing was finalized at 49.9 for October, down from September's 51.5, marking the first contraction since April.
Rob Dobson, Director at S&P Global Market Intelligence, noted that the sector has entered Q4 on an "uncertain footing," as businesses adopt a wait-and-see approach amid policy speculation leading up to the recent Budget. This cautious stance has weighed on investment and spending, with business optimism hovering just above September’s nine-month low.
However, there was positive news on inflation. Input costs dropped to a 10-month low, with inflation easing significantly—one of the largest declines in the survey’s 33-year history. Selling price inflation also moderated, giving BoE additional flexibility to support growth should demand weaken further.
Looking forward, Dobson noted that November’s PMI release will be closely watched for signs of how the Budget impacts business conditions and confidence level.
Swiss CPI down further to 0.6% yoy in Oct
Switzerland’s CPI decreased by -0.1% mom in October, missing expectations of flat growth. Core CPI, which excludes fresh and seasonal products, energy, and fuel, edged up by 0.1% mom. Prices for both domestic and imported products each declined by -0.1% month-over-month.
On an annual basis, headline CPI dropped to 0.6% yoy from 0.8% yoy, falling short of the anticipated 0.8% yoy increase. Core CPI similarly softened, slipping from 1.0% yoy to 0.8% yoy. Domestic product prices grew at a slower pace, declining from 2.0% yoy to 1.8% yoy, while imported product prices saw a deeper contraction, from -2.7% yoy to -3.1% yoy.
Japan's PMI manufacturing finalized at 49.2, weak domestic and global demand
Japan’s PMI Manufacturing was finalized at 49.2 in October, a decline from September's 49.7, signaling continued contraction in the sector.
Usamah Bhatti at S&P Global Market Intelligence noted that while output fell only slightly, it was at the sharpest rate since April, with new orders contracting at their fastest pace in three months. Companies cited “weakness in domestic and global demand” as weighing heavily on sales and output, particularly in the semiconductor and auto industries.
Bhatti added that “near-term outlook is clouded” as firms worked through backlogs, suggesting that incoming orders are insufficient to support ongoing production. Business confidence also remained subdued, hovering near a two-year low, with firms expressing concerns about the timeline for recovery from the current “economic malaise.”
China’s Caixin PMI manufacturing rises to 50.3, domestic demand recovery amid weak exports
China’s Caixin Manufacturing PMI improved to 50.3 in October, up from 49.3 and surpassing expectations of 49.5.
According to Wang Zhe, Senior Economist at Caixin Insight Group, October brought a mix of positive developments, including “growth in manufacturing supply and demand, increases in prices, proactive inventory replenishment by companies, and logistics delays.”
However, challenges persist as external demand remains soft; new export orders contracted for the third consecutive month. Wang added that declining employment levels and weak foreign demand continue to weigh on the sector.
EUR/USD Mid-Day Outlook
Daily Pivots: (S1) 1.0856; (P) 1.0872; (R1) 1.0900; More...
EUR/USD's rebound from 1.0760 short term bottom continues today and intraday bias stays on the upside for 55 D EMA (now at 1.0945). Strong resistance should be seen there to limit upside. On the downside, below 1.0843 minor support will turn intraday bias back to the downside. Sustained break of 61.8% retracement of 1.0447 to 1.1213 at 1.0740 will extend the fall from 1.1213 to 1.0601 support next.
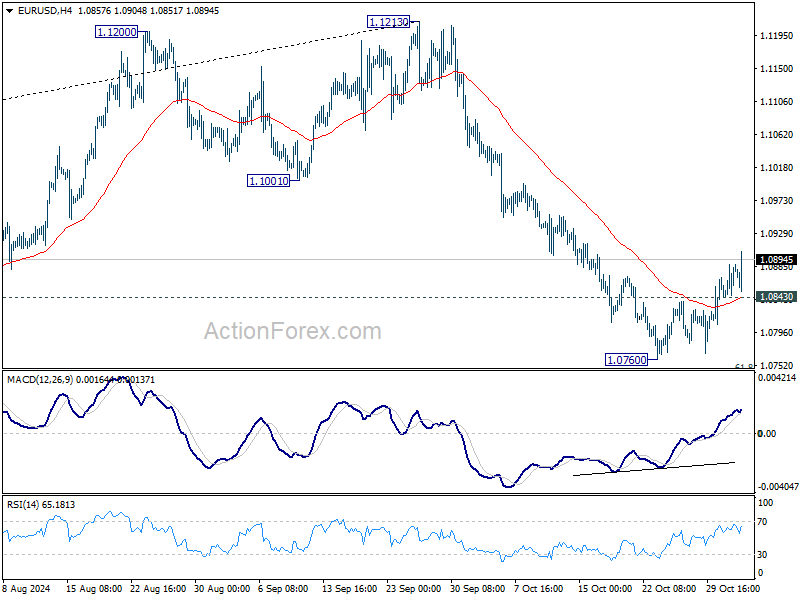
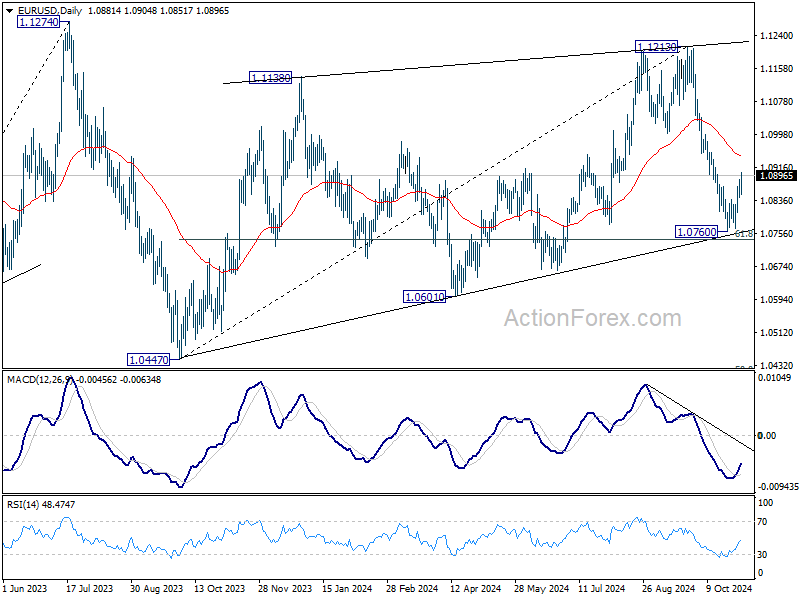
In the bigger picture, price actions from 1.1274 (2023 high) are seen as a consolidation pattern to up trend from 0.9534 (2022 low), with fall from 1.1213 as the third leg. Downside should be contained by 50% retracement of 0.9534 (2022 low) to 1.1274 at 1.0404, to bring up trend resumption at a later stage.
USD/JPY Mid-Day Outlook
Daily Pivots: (S1) 151.39; (P) 152.49; (R1) 153.14; More...
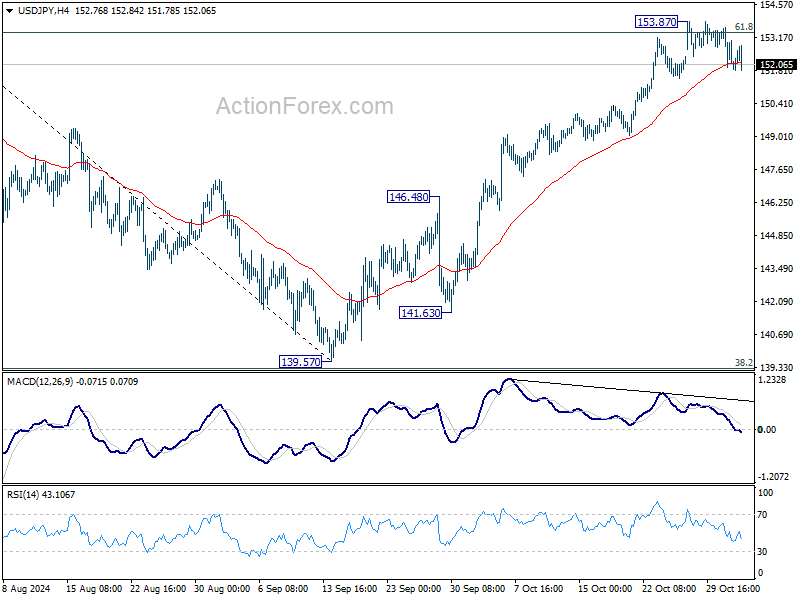
USD/JPY is still extending the consolidation pattern from 153.87 and intraday bias remains neutral. Deeper retreat cannot be ruled out but further rally is expected as long as 55 D EMA (now at 148.95) holds. Sustained trading above 61.8% retracement of 161.94 to 139.57 at 153.39 will pave the way to retest 161.94 high.
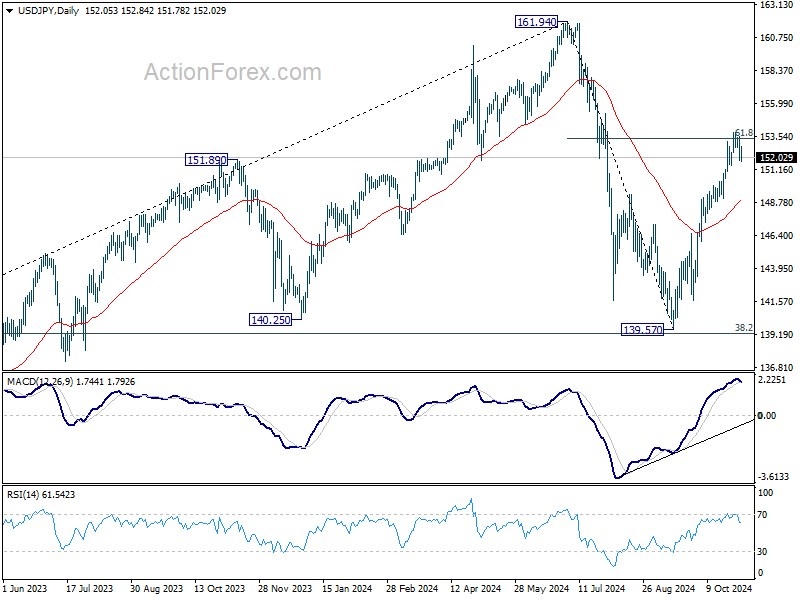
In the bigger picture, price actions from 161.94 are seen as a corrective pattern to rise from 102.58 (2021 low). The range of medium term consolidation should be set between 38.2% retracement of 102.58 to 161.94 at 139.26 and 161.94. Nevertheless, sustained break of 139.26 would open up deeper medium term decline to 61.8% retracement at 125.25.
USD/CHF Mid-Day Outlook
Daily Pivots: (S1) 0.8622; (P) 0.8646; (R1) 0.8659; More…
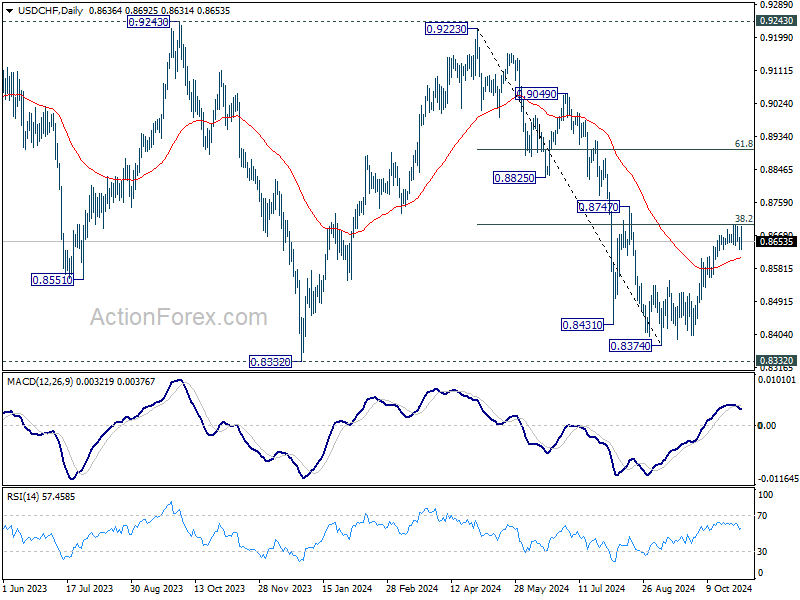
USD/CHF is still extending consolidation from 0.8699 and intraday bias remains neutral. Further rally remains in favor as long as 55 D EMA (now at 0.8609) holds. On the upside, decisive break of 38.2% retracement of 0.9223 to 0.8374 at 0.8698 will argue that fall from 0.9223 has completed after defending 0.8332 low. Further rally should then be seen to 61.8% retracement at 0.8899 next.
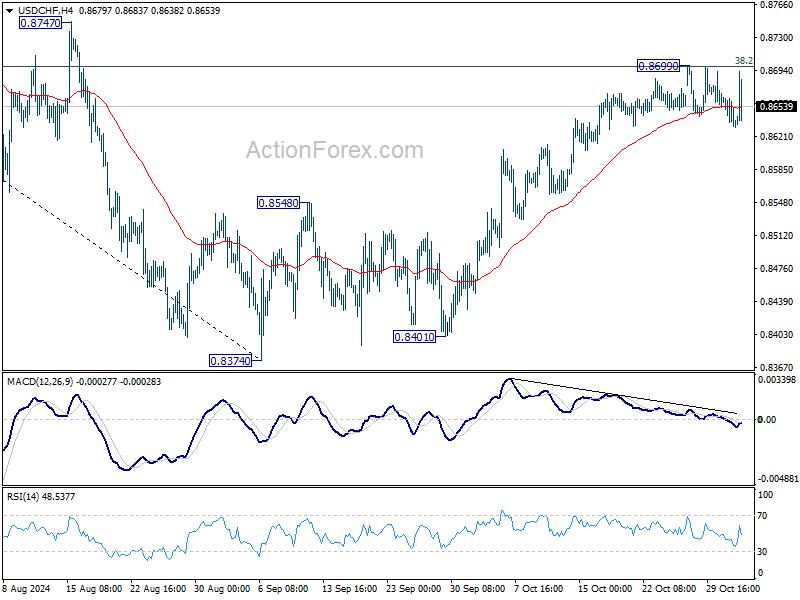
In the bigger picture, price actions from 0.8332 (2023 low) are currently seen as a medium term corrective pattern, with fall from 0.9223 as the second leg. Strong support could be seen from 0.8332 to bring rebound. Yet, overall outlook will continue to stay bearish as long as 0.9243 resistance holds. Firm break of 0.8332, however, will resume larger down trend from 1.0146 (2022 high).
GBP/USD Mid-Day Outlook
Daily Pivots: (S1) 1.2830; (P) 1.2915; (R1) 1.2984; More...
GBP/USD rebounded notably after dipping to 1.2842 and intraday bias is turned neutral again first. Further decline is expected as long as 1.3042 resistance holds. Below 1.2842 will resume the fall from 1.3433 to 61.8% retracement of 1.2298 to 1.3433 at 1.2732. However, firm break of 1.3042 will indicate short term bottoming, and turn bias back to the upside.
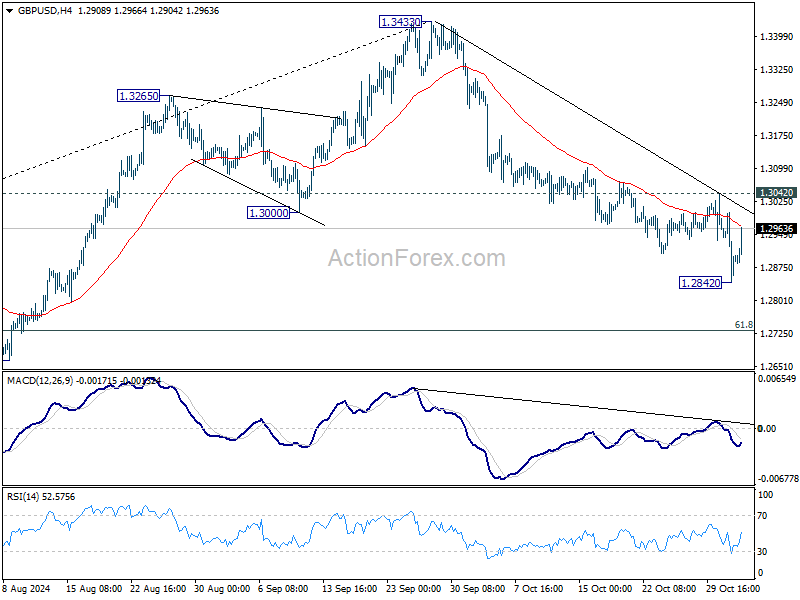
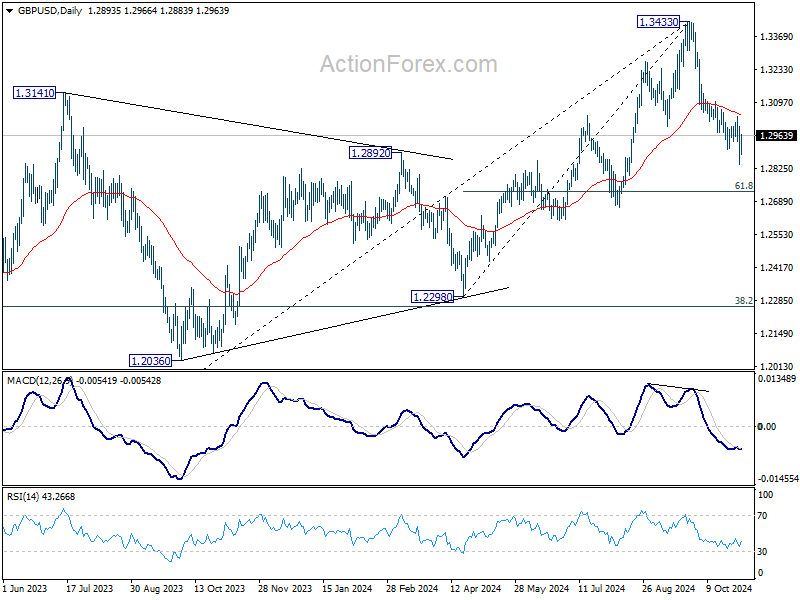
In the bigger picture, considering mildly bearish divergence condition in D MACD, a medium term top is likely in place at 1.3433 already. Price actions from there are seen as correction to whole up trend from 1.0351 (2022 low). Deeper decline would be seen to 38.2% retracement of 1.0351 to 1.3433 at 1.2256, which is close to 1.2298 structural support. Strong support should be seen there to bring rebound.
EUR/USD Mid-Day Outlook
Daily Pivots: (S1) 1.0856; (P) 1.0872; (R1) 1.0900; More...
EUR/USD's rebound from 1.0760 short term bottom continues today and intraday bias stays on the upside for 55 D EMA (now at 1.0945). Strong resistance should be seen there to limit upside. On the downside, below 1.0843 minor support will turn intraday bias back to the downside. Sustained break of 61.8% retracement of 1.0447 to 1.1213 at 1.0740 will extend the fall from 1.1213 to 1.0601 support next.
In the bigger picture, price actions from 1.1274 (2023 high) are seen as a consolidation pattern to up trend from 0.9534 (2022 low), with fall from 1.1213 as the third leg. Downside should be contained by 50% retracement of 0.9534 (2022 low) to 1.1274 at 1.0404, to bring up trend resumption at a later stage.
US NFP grows only 12k in Oct, unemployment rate steady at 4.1%
US non-farm payroll employment grew only 12k in October, well below expectation of 106k. That compares to average monthly gain of 194k over the prior 12 months.
Nevertheless, unemployment rate was unchanged at 4.1%, matched expectations. number of unemployed people was little changed at 7.0m. Participation rate ticked down from 62.7% to 62.6%.
Average hourly earnings rose 0.4% mom, above expectation of 0.3% mom. Annual growth of average hourly earnings ticked up from 3.9% yoy to 4.0% yoy.
GBP/USD Technical: Trendline Break Sets the Stage for Further Downside
- GBP/USD has broken below a long-term ascending trendline, signaling potential further downside.
- UK budget concerns and a drop in manufacturing PMI have contributed to the Pound’s struggle.
- UK budget concerns and a drop in manufacturing PMI have contributed to the Pound’s struggle.
Cable has struggled this week following the UK budget. Pound Sterling should have appreciated against the greenback considering the paring back of rate cut expectations from the Bank of England (BoE).
Following the UK budget expectations for the Bank of England to lower interest rates have dropped. This change came after the UK Chancellor announced the biggest tax increase since 1993, worth 40 billion pounds, along with plans to increase government spending and investment by raising the fiscal deficit. Additionally, the Office for Business Responsibility predicted higher inflation rates of 2.5% in 2024 and 2.6% in 2025, leading traders to reduce their bets on rate cuts by the Bank.
There are some other concerns around the UK budget which was raised by Moodys as well and could explain the British Pounds struggle. There are concerns that the added borrowing will impact the UKs ability to bring their finances in order. Moodys also stated that the UK budget creates challenges and cautioned that we could see muted growth from the UK moving forward.
The continued selloff in the US Dollar was not enough to arrest the slide in GBP/USD before a bounce occurred this morning. The release of the S&P Global Flash UK Manufacturing PMI dropped to 49.9 in October 2024, down from 51.5 the previous month. This was lower than expected and shows the first drop in factory activity since April. New orders decreased as clients waited for the UK budget.
Orders from abroad also fell for the 33rd month, with fewer orders from Europe, China, and the US. Production increased slightly as factories worked through their backlog of orders. Manufacturing jobs grew for the third time in four months, but more slowly because of fewer new orders. Costs for materials dropped to their lowest in ten months, and selling prices went up the least since February. Business optimism improved a little from a nine-month low in September. The data however appeared to have little impact on GBP/USD ahead of the US session
Source: FinancialJuice (click to enlarge)
A batch of US data awaits later in the day with the US jobs report chief among them. Markets are anticipating a strong number following labor data seen earlier in the week and should this come to pass, it will be interesting to gauge if cable can shrug off the US data and continue its move higher today.

GBP/USD Technical Analysis
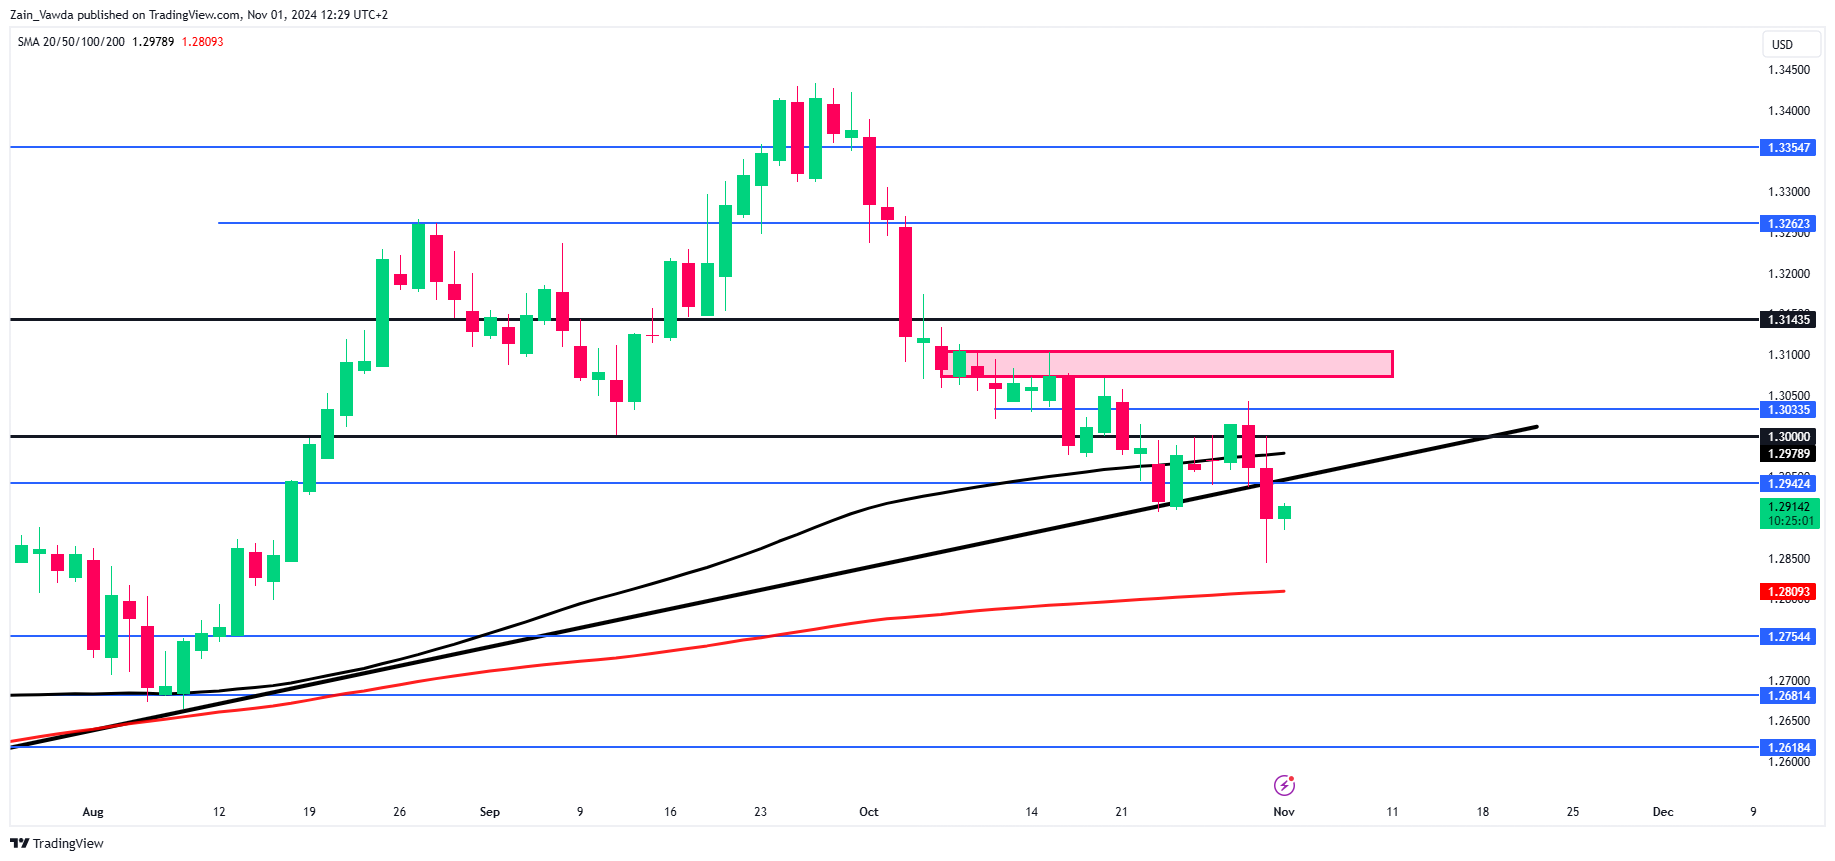
GBP/USD is now at an interesting place as it has broken below the long-term ascending trendline which began back in April.
This trendline break opens up a host of scenarios and potential opportunities in cable moving forward. I could see a retest of the trendline developing before a continuation of the move lower with a deeper pullback to the 1.300 handle also a possibility.
Any such pullback may be preferred for any would-be-shorts looking to get involved. A break and daily candle close above the 1.30150 handle would invalidate the bearish setup.
Looking at the downside, support rests at the 200-day MA around 1.2800 before the 1.2750 and 1.2681 handles come into focus.
GBP/USD Daily Chart, November 1, 2024
Source: TradingView.com (click to enlarge)
Support
- 1.2845
- 1.2800
- 1.2750
Resistance
- 1.2942
- 1.3000
- 1.3033
SPX 500: Second Sign of Downside Volatility Emerges, Odds of Medium-Term Corrective Decline Increase
- Bearish reversal detected below 5,930 key medium-term resistance of the SPX 500.
- Market breadth indicator (% of component stocks above 20-day and 50-day moving averages) has deteriorated.
- The odds have increased for a medium-term corrective decline on the SPX 500 as the key US presidential election risk event looms on 5 November.
Since our last publication, the S&P 500 has reversed down by 3% from its current all-time high of 5,878 printed on 17 October, and right below the 5,930 key medium-term resistance highlighted earlier. It also ended October with a monthly loss of almost 1% dragged down by lackluster revenue guidance from three mega-cap technology stocks: Microsoft, Meta Platforms, and Apple.
Market breadth has turned weak

Fig 1: % of S&P 500 & Nasdaq 100 component stocks trading above 20-day & 50-day moving averages of 31 Oct 2024 (Source: TradingView)
One of the market breadth measurements on the S&P 500 has turned weak where the percentage of its component stocks trading above their respective 20-day and 50-day moving averages have turned southward bound.
The percentage of S&P 500 component stocks trading above their 20-day moving averages has declined sharply from 72% to 32% within two weeks.
A similar observation can also be seen in the percentage of S&P 500 component stocks trading above 50-day moving averages as it dropped from 77% to 47% over the same period (see Fig 1).
The rapid deterioration seen in these market breadth indicators of the S&P 500 to breach below their respective 50% levels has suggested that the medium-term uptrend phase of the S&P 500 has been damaged ahead of next week’s key US presidential election polling day on 5 November.
Bearish breakdown of “Ascending Wedge”
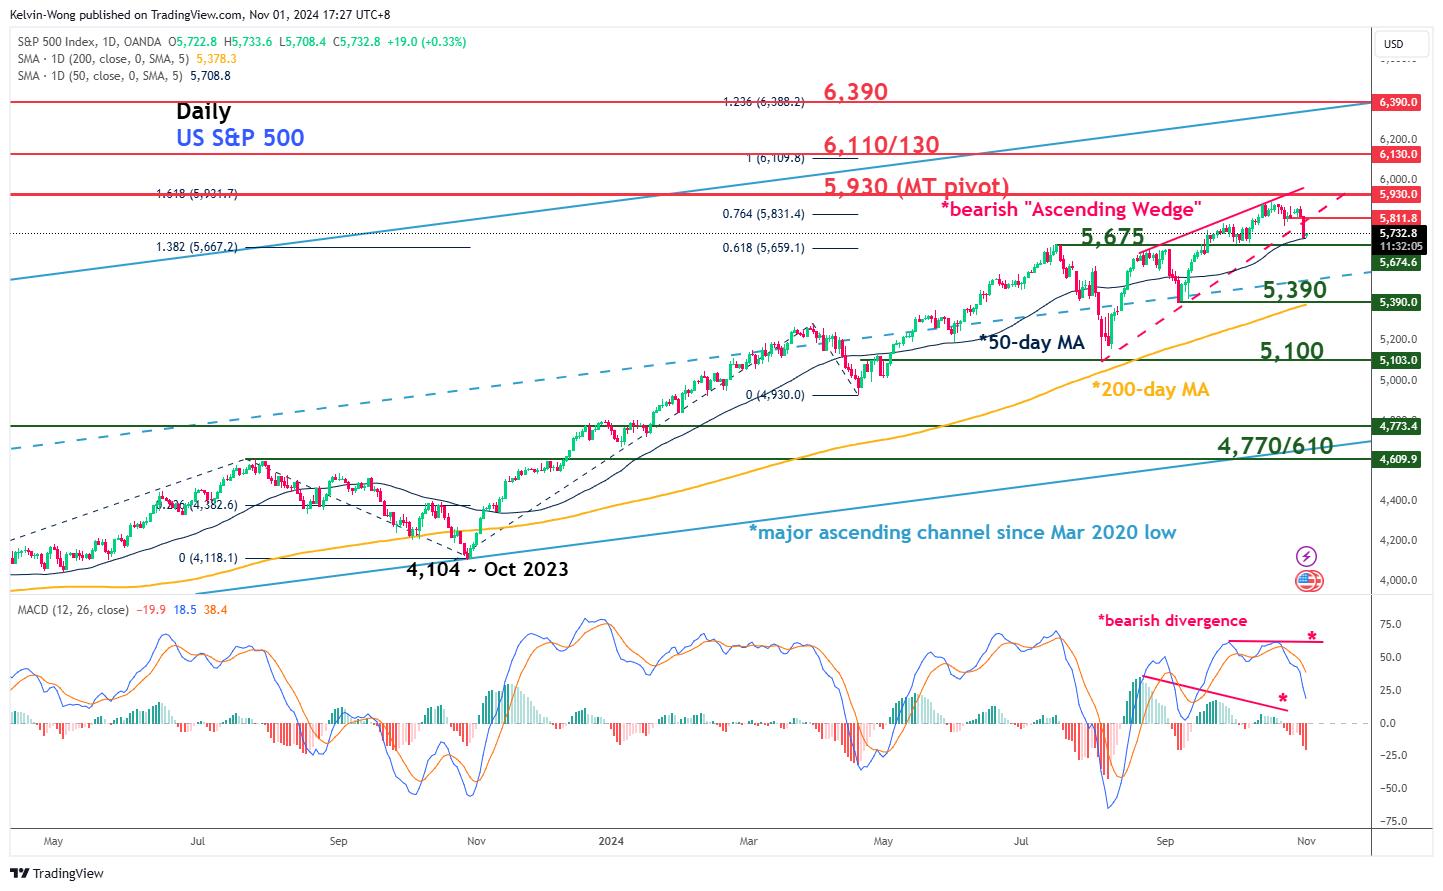
Fig 2: Medium-term & major trends of the US S&P 500 CFD Index as of 1 Nov 2024 (Source: TradingView)
Thursday, 31 October price actions seen on the US S&P 500 CFD Index (a proxy of the S&P 500 E-mini futures) have staged a bearish breakdown below the bearish reversal “Ascending Wedge” support from 5 August 2024 swing low now turns an intermediate pull-back resistance at 5,811.
In addition, the MACD trend indicator traced out a prior bearish divergence condition earlier on 23 October after a similar bearish divergence flashed out on the leading MACD Histogram a week earlier on 14 October.
These observations suggest that the US S&P 500 CFD Index may have formed a medium-term top and is in the process of shaping a potential medium-term (multi-week) corrective decline sequence.
Watch the 5,930 key medium-term pivotal resistance, and a breakdown with a daily close below 5,675 (close to the 50-day moving average) sees the next medium-term supports coming in at 5,390 (also the 200-day moving average) and 5,100.
On the other hand, a clearance with a daily close above 5,930 invalidates the bearish tone to expose the next medium-term resistances at 6,110/130 and 6,390 (also the upper boundary of the major ascending channel from March 2020 low).
Crypto Takes a Step Back, Ready for Volatility
Market Picture
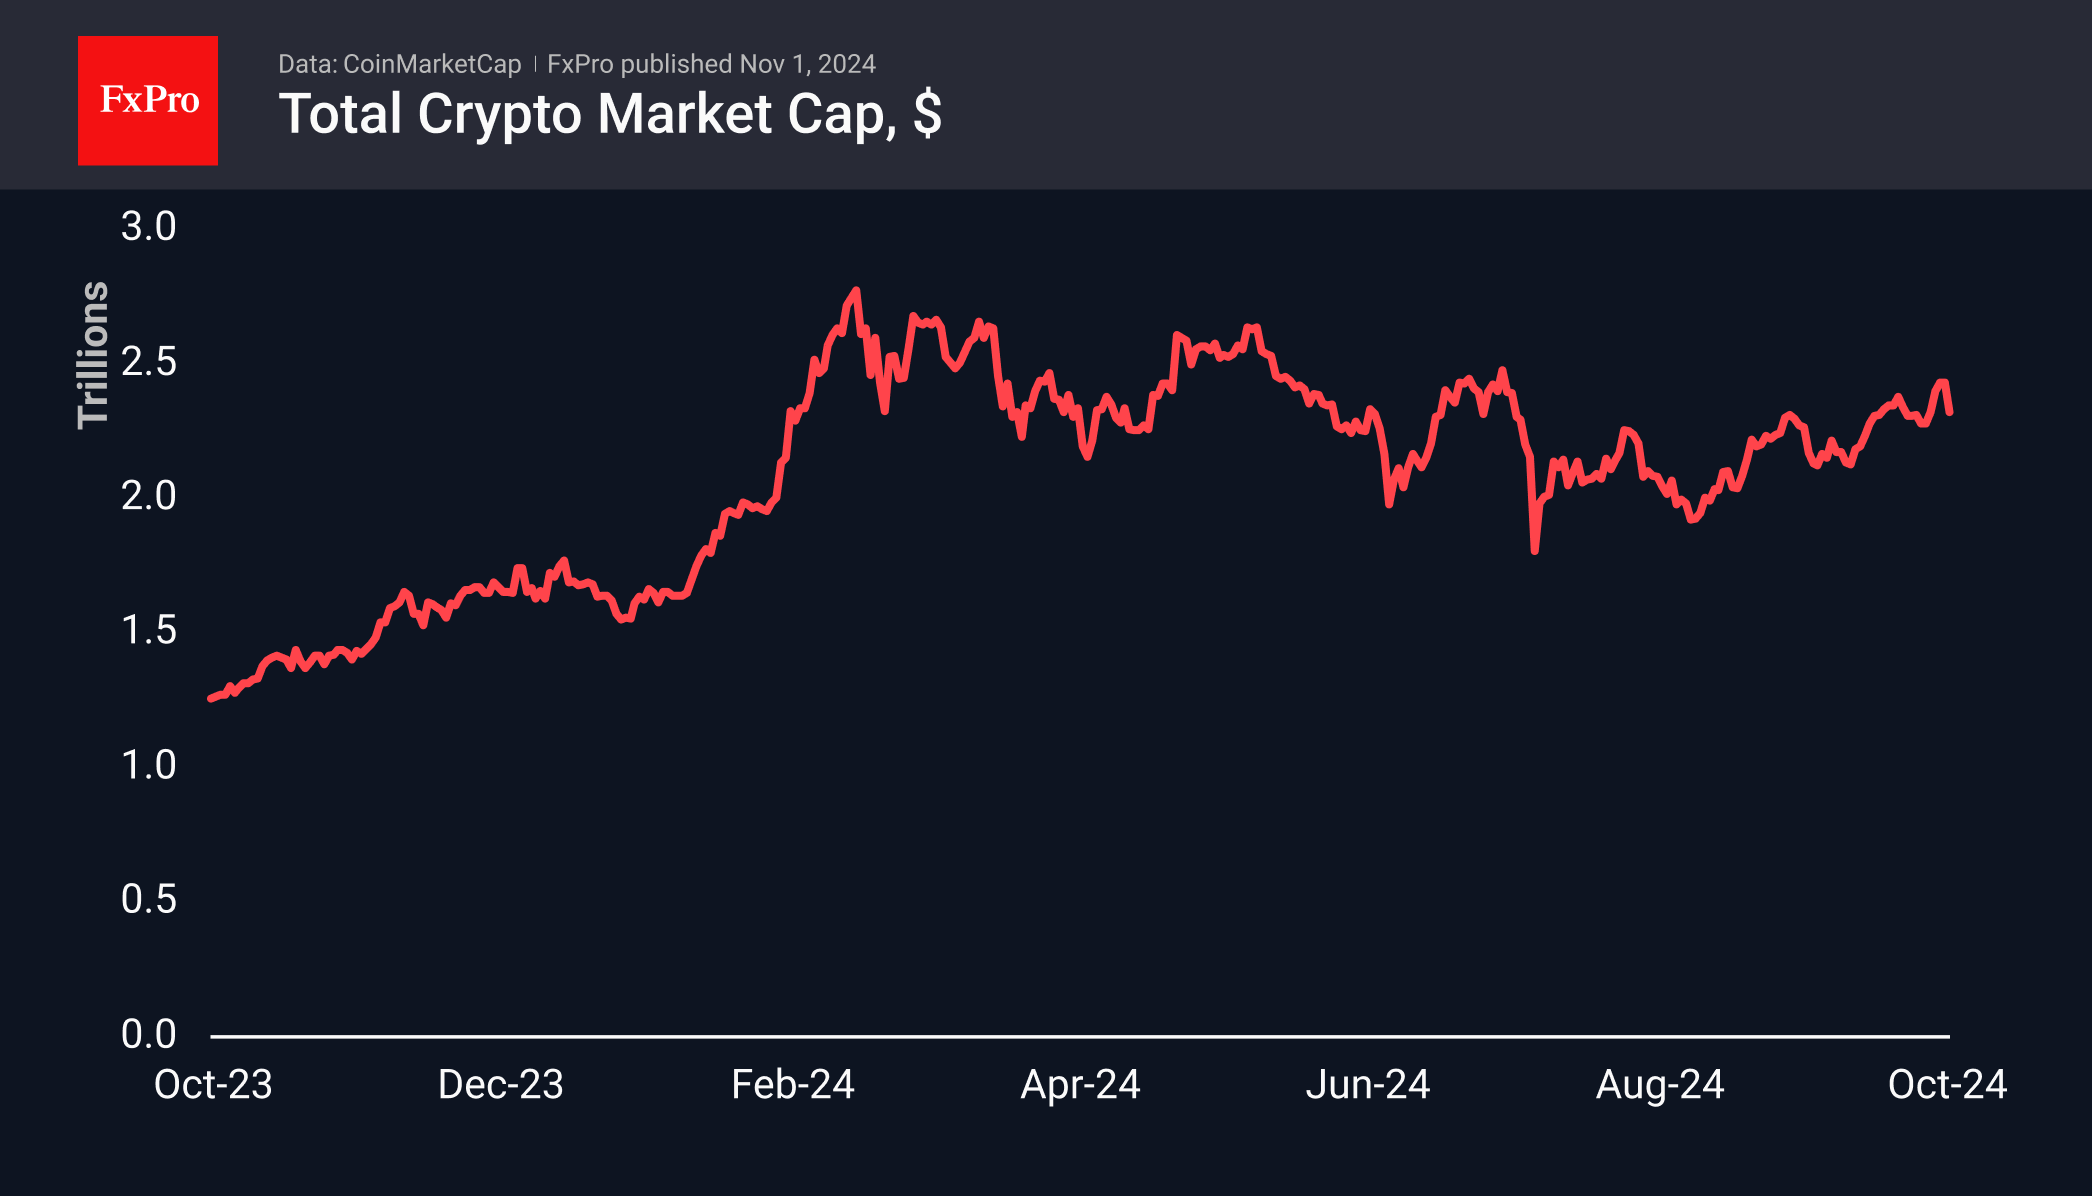
The crypto market stumbled on the last day of October, losing over 5.5% in 24 hours as investors turned to profit-taking. The drop coincided with the stock market entering a period of high uncertainty ahead of a mix of influential events: the NFP on Friday, the US election results on Wednesday and the Fed meeting on Thursday.
The total crypto cap rolled back to $2.33 trillion, where the market consolidated in the 10 days to 25 October. While painfully sharp, it fits well with the upward trend that has been building since early September.
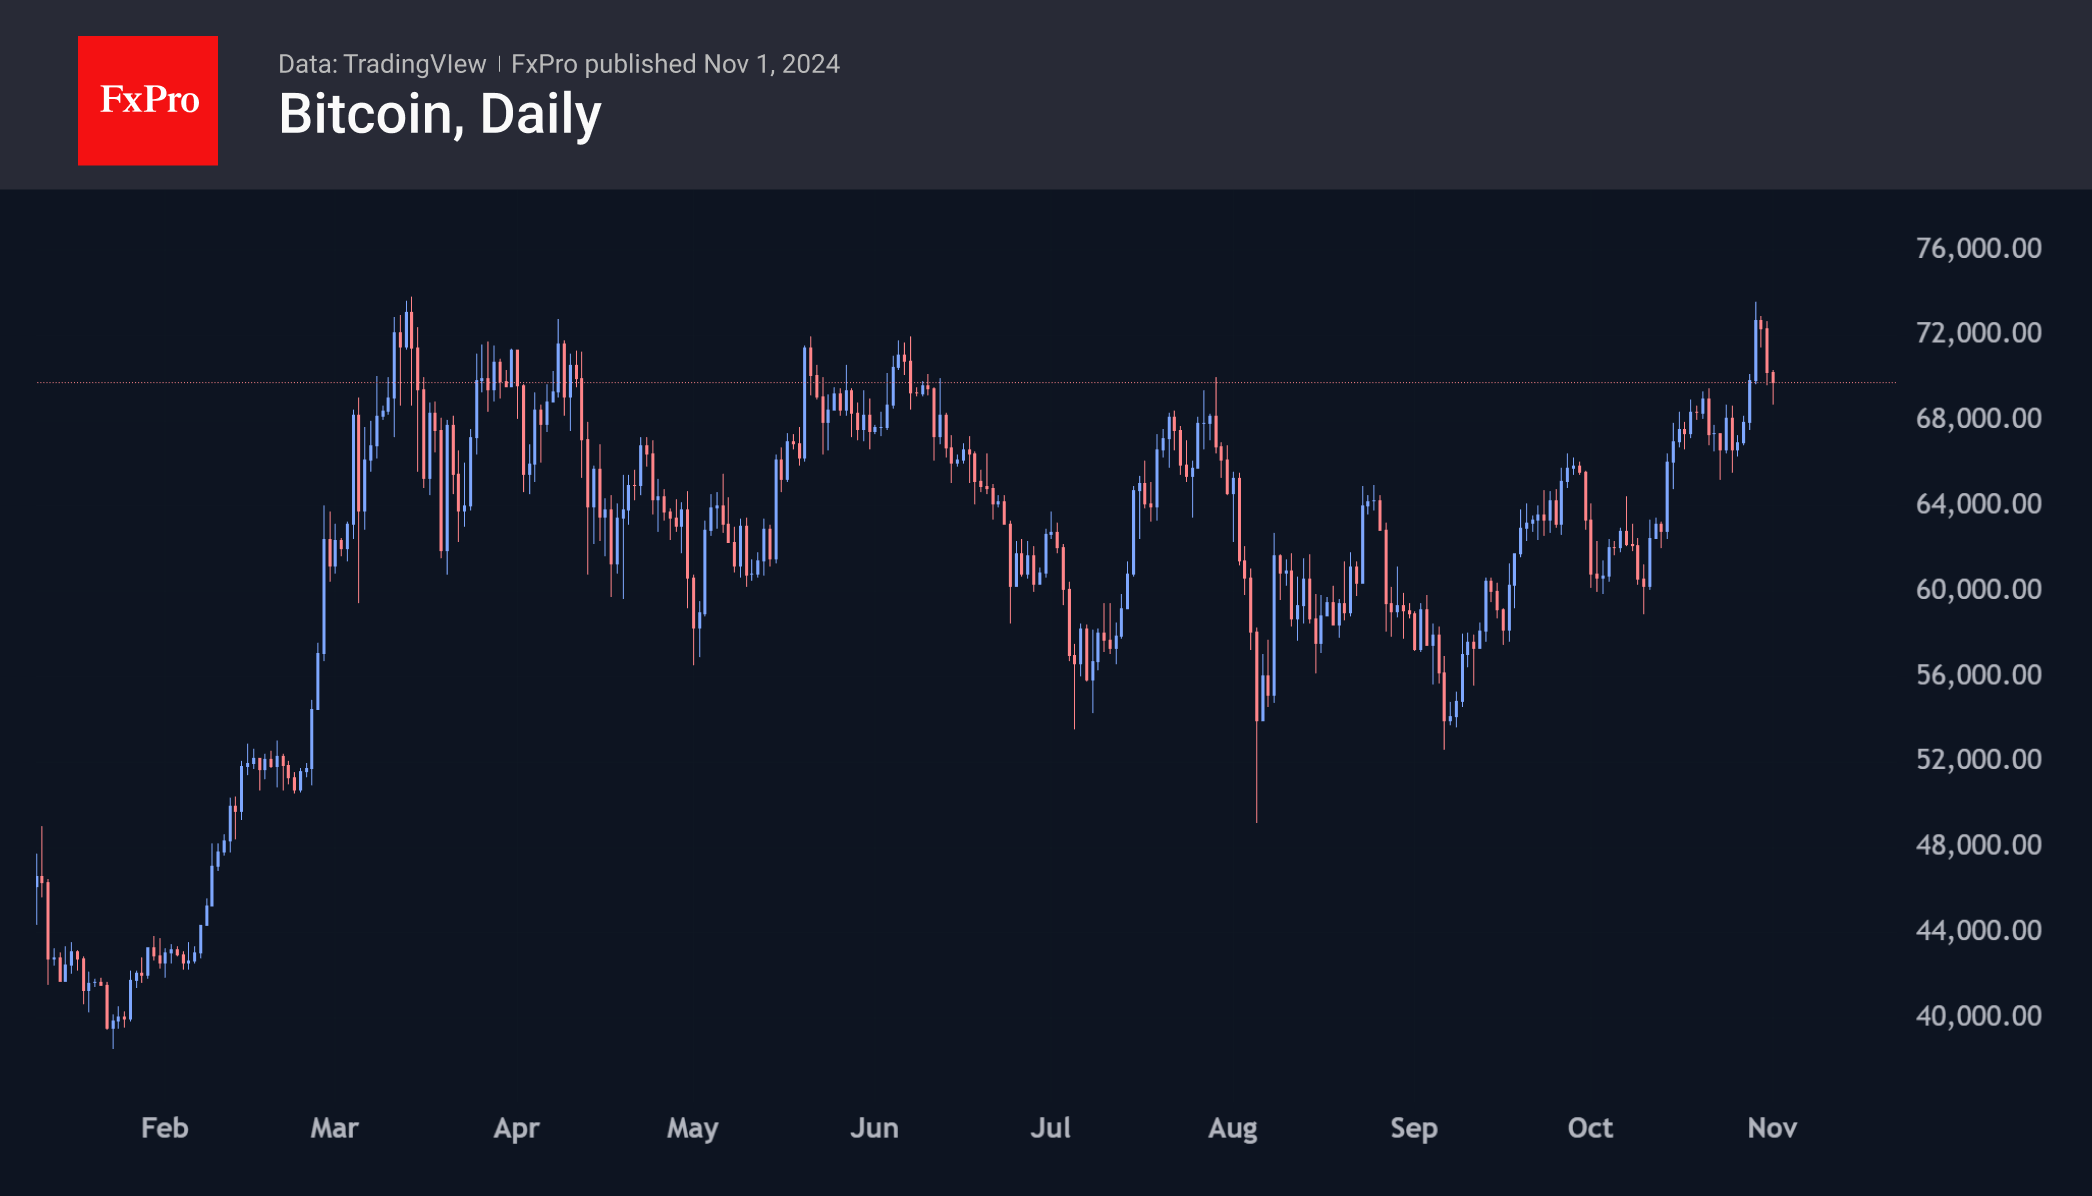
Bitcoin has fallen back just below the $70K area, temporarily turning support into former resistance. After an impressive and rather unexpected attack on all-time highs, Bitcoin is now in news-waiting mode, ready to move either way from current levels. There will be no shortage of volatility and sharp reversals.
At the end of October, bitcoin was up 9.7% at $70K. In terms of seasonality, November is considered a successful month for BTC. Over the past 13 years, bitcoin has ended the month with a gain 8 times, with an average rise of 22% and an average fall of 17%.
News background
Crypto investment firm Canary Capital has filed an S-1 with the SEC to register a spot ETF based on Solana. Solana’s advanced DeFi ecosystem ensures sustained on-chain activity, as evidenced by the number of daily transactions and active and new addresses, while keeping user fees low, the company said in a statement.
In its Q3 report, MicroStrategy unveiled a plan to raise $42 billion to continue its bitcoin acquisition strategy. Since August 2020, the company has spent $6.9 billion to buy 252,220 BTC.
According to its quarterly report, social network Reddit sold nearly $6.9m of its BTC and Ethereum reserves in the third quarter. The company noted that fluctuations in crypto-asset exchange rates have negatively impacted its financial performance, as has the lack of a clear tax regime for cryptocurrencies.
The growth of the stablecoin market has led to increased demand for short-term Treasury securities, the US Treasury Department said in a report. The department estimates that stablecoin issuers have invested $120 billion in US debt.
31 October marked the 16th anniversary of the Bitcoin White Paper. The technical document described the working principles of the peer-to-peer payment system that went on to revolutionise the world of financial technology. Donald Trump congratulated the crypto community on the occasion.